| Param | Original file | Final file |
|---|---|---|
| Filename | modeM0/AS1A13_020T01_9000006040_45068cztM0_level2.fits | modeM0/AS1A13_020T01_9000006040_45068cztM0_level2_quad_clean.evt |
| Size (bytes) | 492,330,240 | 110,024,640 |
| Size | 469.5 MB | 104.9 MB |
| Events in quadrant A | 5,357,630 | 749,789 |
| Events in quadrant B | 3,215,330 | 776,589 |
| Events in quadrant C | 3,093,124 | 748,496 |
| Events in quadrant D | 6,076,309 | 623,016 |
| Mode SS | |||
|---|---|---|---|
| Quadrant | BADHDUFLAG | Total packets | Discarded packets |
| A | 0 | 126 | 0 |
| B | 0 | 126 | 0 |
| C | 0 | 126 | 0 |
| D | 0 | 126 | 0 |
| Mode M9 | |||
|---|---|---|---|
| Quadrant | BADHDUFLAG | Total packets | Discarded packets |
| A | 0 | 12 | 0 |
| B | 0 | 12 | 0 |
| C | 0 | 12 | 0 |
| D | 0 | 12 | 0 |
| Mode M0 | |||
|---|---|---|---|
| Quadrant | BADHDUFLAG | Total packets | Discarded packets |
| A | 0 | 19995 | 1 |
| B | 0 | 13464 | 1 |
| C | 0 | 13149 | 1 |
| D | 0 | 22319 | 1 |
| Quadrant | Total seconds | Saturated seconds | Saturation percentage |
|---|---|---|---|
| A | 6215 | 158 | 2.542237% |
| B | 6216 | 109 | 1.753539% |
| C | 6216 | 82 | 1.319176% |
| D | 6216 | 709 | 11.406049% |
Noise dominated data is calculated using 1-second bins in cleaned event files. If a bin has >2000 counts, and if more than 50% of those come from <1% of pixels, then it is considered to be noise-dominated and hence unusable.
| Quadrant | # 1 sec bins | Bins with >0 counts | Bins with >2000 counts | High rate bins dominated by noise | Noise dominated (total time) | Noise dominated (detector-on time) | Marked lightcurve |
|---|---|---|---|---|---|---|---|
| A | 7405 | 6216 | 9 | 9 | 0.12% | 0.14% | 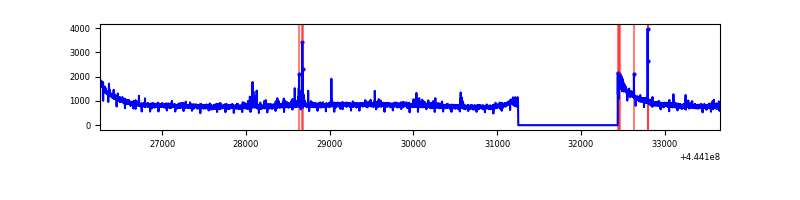 |
| B | 7406 | 6217 | 14 | 14 | 0.19% | 0.23% | 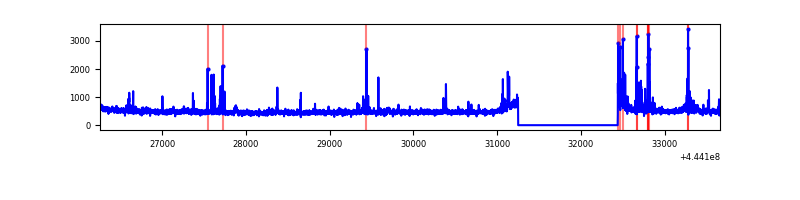 |
| C | 7406 | 6217 | 18 | 18 | 0.24% | 0.29% | 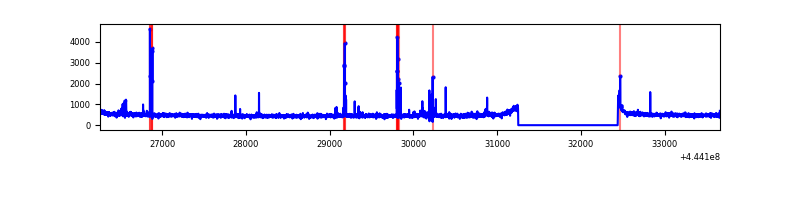 |
| D | 7406 | 6217 | 513 | 513 | 6.93% | 8.25% | 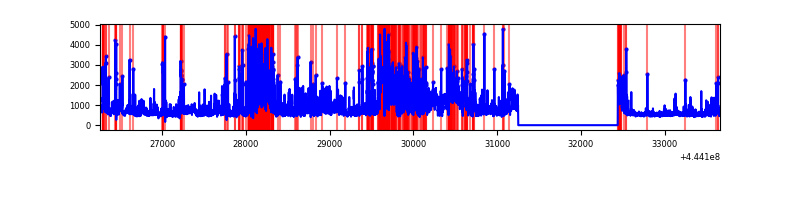 |
Top three noisy pixels from each quadrant. If the there are fewer than three noisy pixels in the level2.evt file, extra rows are filled as -1
| Pixel properties | Quadrant properties | ||||||
|---|---|---|---|---|---|---|---|
| Quadrant | DetID | PixID | Counts | Sigma | Mean | Median | Sigma |
| A | 10 | 83 | 2343958 | 15089.69 | 757 | 741 | 155.3 |
| A | 13 | 248 | 38968 | 246.17 | 757 | 741 | 155.3 |
| A | 7 | 3 | 20610 | 127.95 | 757 | 741 | 155.3 |
| B | 10 | 3 | 124606 | 850.45 | 751 | 730 | 145.7 |
| B | 5 | 255 | 58013 | 393.27 | 751 | 730 | 145.7 |
| B | 4 | 171 | 21219 | 140.66 | 751 | 730 | 145.7 |
| C | 1 | 3 | 39073 | 219.16 | 750 | 758 | 174.8 |
| C | 12 | 250 | 36028 | 201.75 | 750 | 758 | 174.8 |
| C | 0 | 207 | 30692 | 171.22 | 750 | 758 | 174.8 |
| D | 1 | 52 | 753757 | 4259.1 | 714 | 695 | 176.8 |
| D | 13 | 249 | 629542 | 3556.58 | 714 | 695 | 176.8 |
| D | 5 | 235 | 378021 | 2134.05 | 714 | 695 | 176.8 |
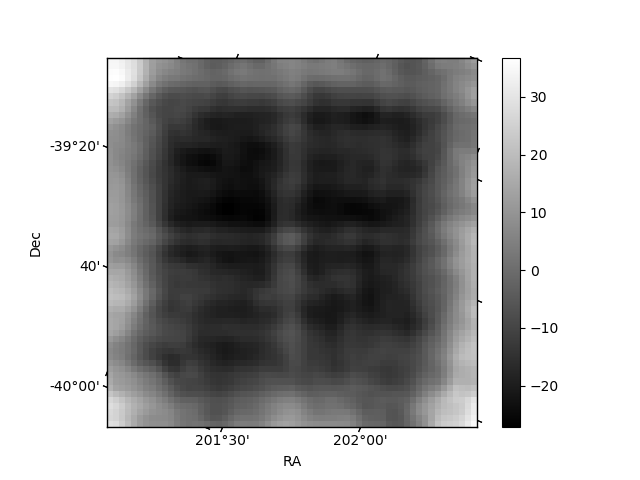
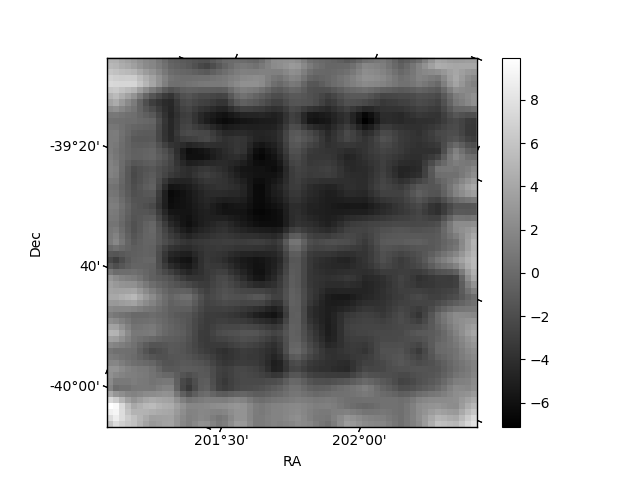
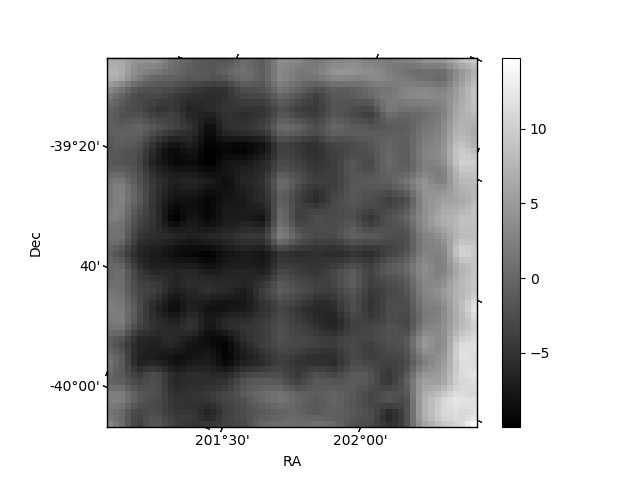
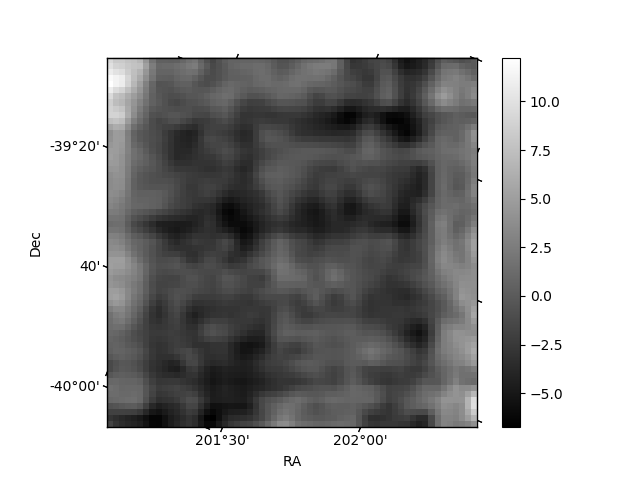
Histogram calculated using DETX and DETY for each event in the final _common_clean file
| Quadrant A | 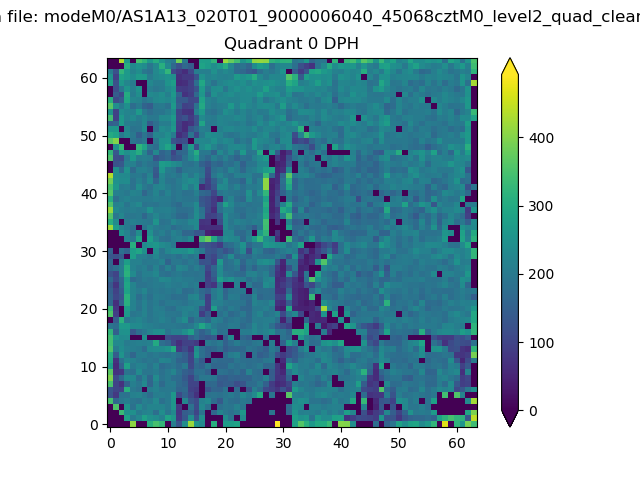 |
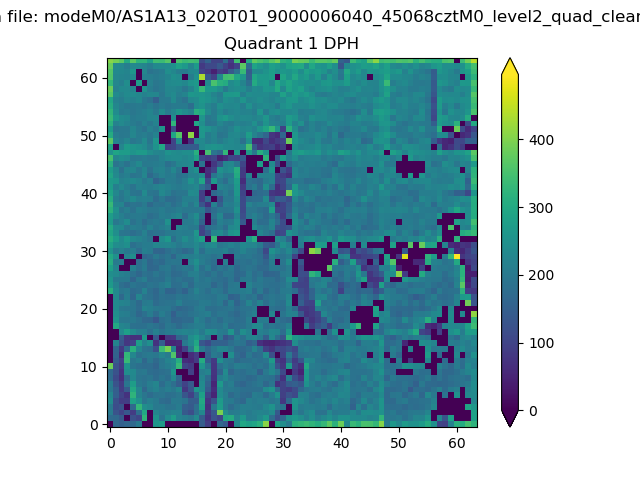 |
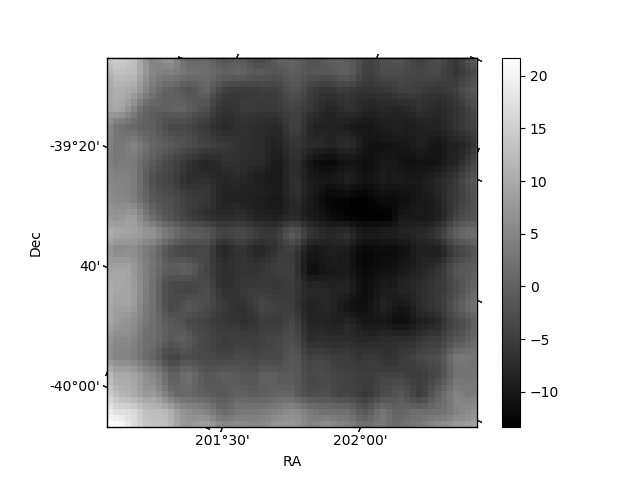
Quadrant B |
|---|---|---|---|
| Quadrant D | 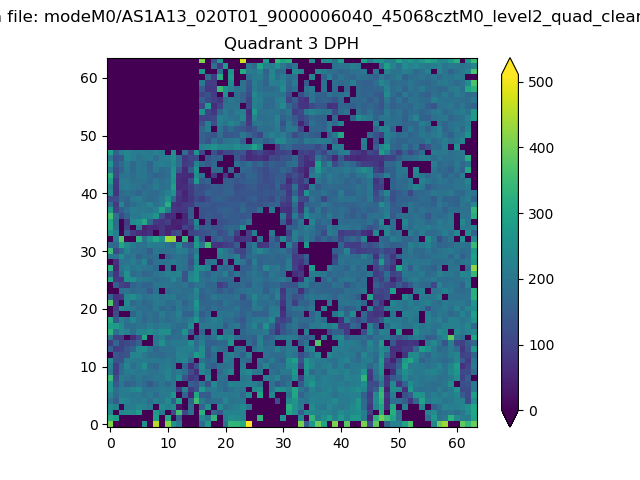 |
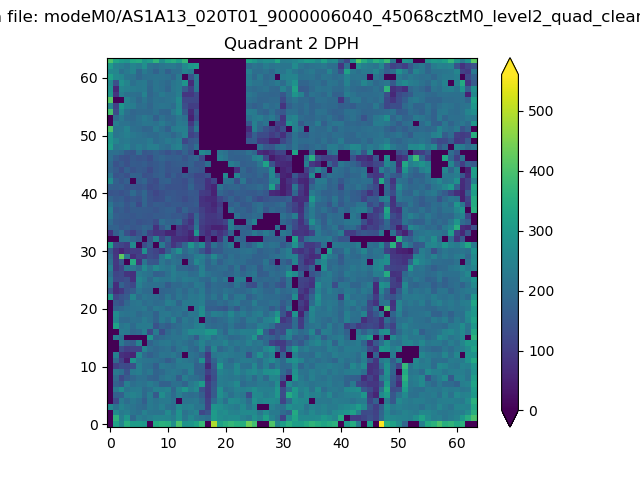 |
Quadrant C |
| Plot type | Count rate plots | Images |
|---|---|---|
| Comparison with Poisson distribution Blue bars denote a histogram of data divided into 1 sec bins. Red curve is a Poisson curve with rate = median count rate of data. |
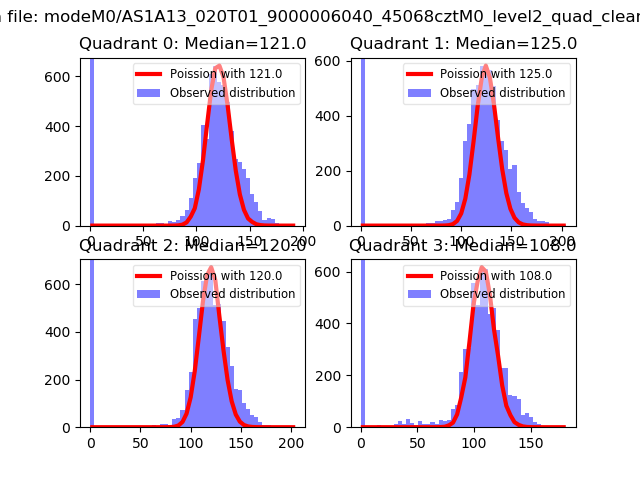 |
 |
| Quadrant-wise count rates Data is divided into 100 sec bins |
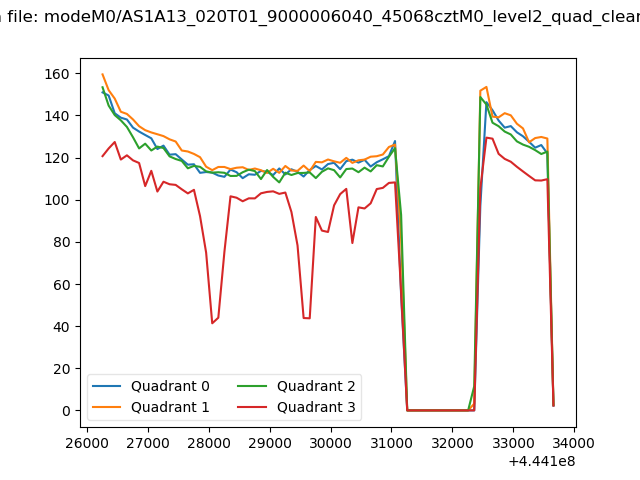 |
|
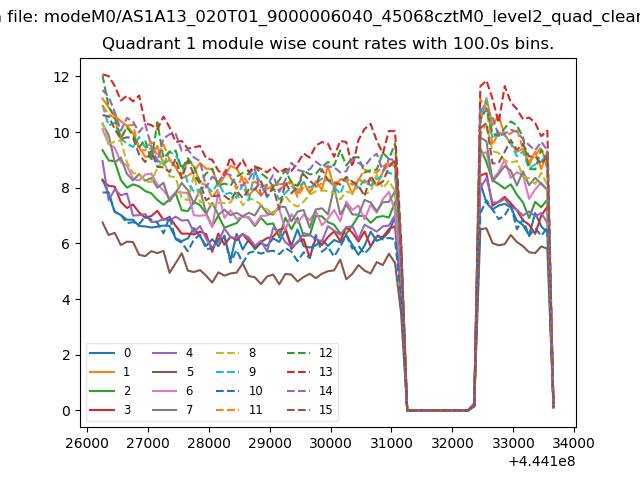
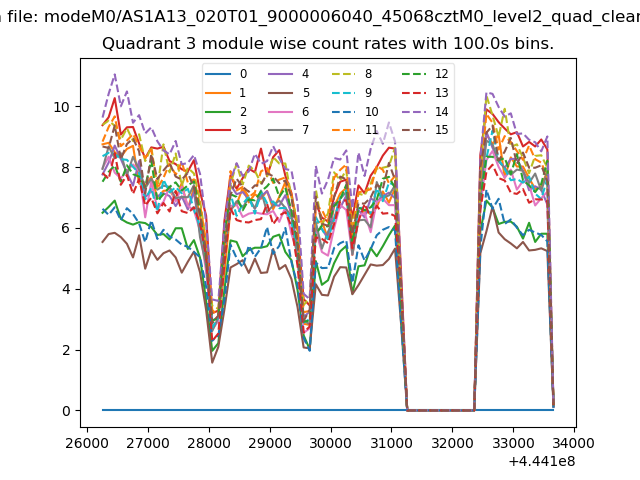
| Module-wise count rates for Quadrant A Data is divided into 100 sec bins |
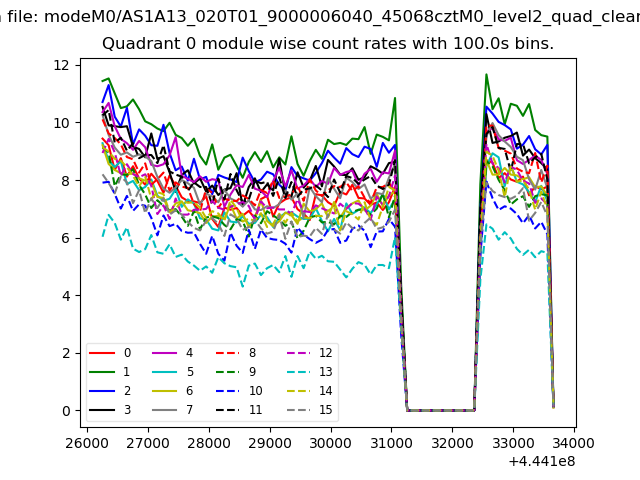 |
 |
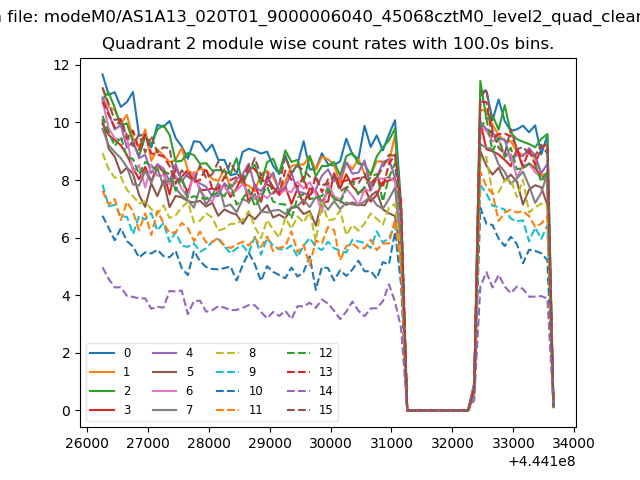
| Module-wise count rates for Quadrant B Data is divided into 100 sec bins |
 |
 |
| Module-wise count rates for Quadrant C Data is divided into 100 sec bins |
 |
 |
| Module-wise count rates for Quadrant D Data is divided into 100 sec bins |
 |
 |
| Parameter | Plot |
|---|---|
| CZT HV Monitor | 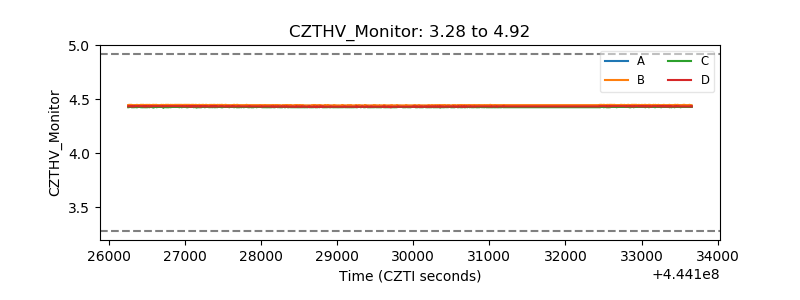 |
| D_VDD | 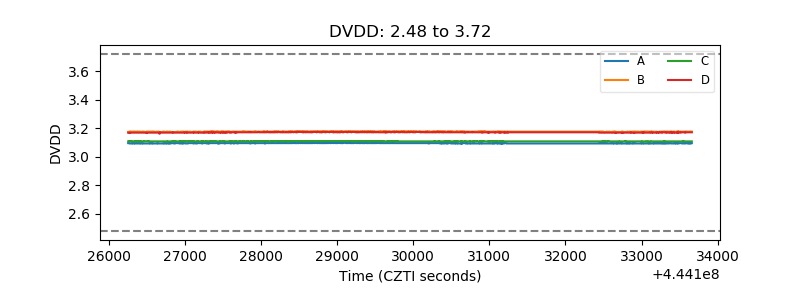 |
| Temperature 1 | 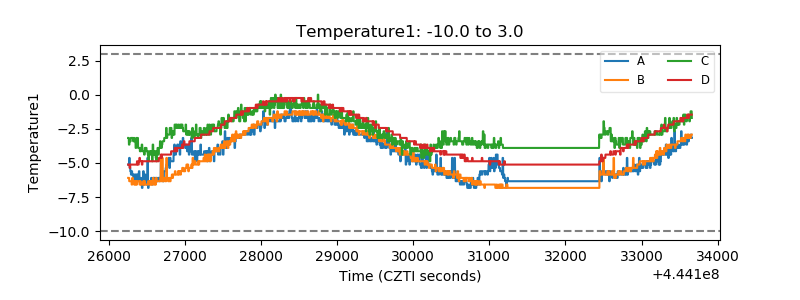 |
| Veto HV Monitor | 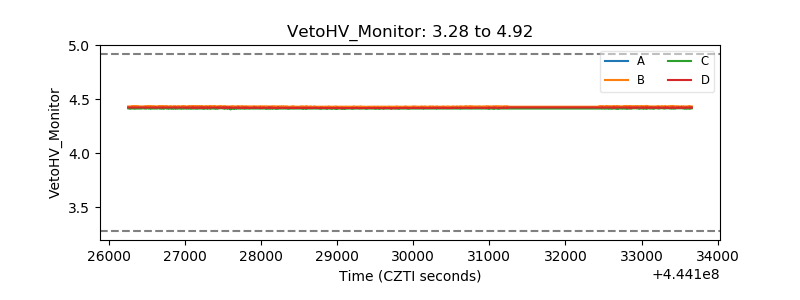 |
| Veto LLD | 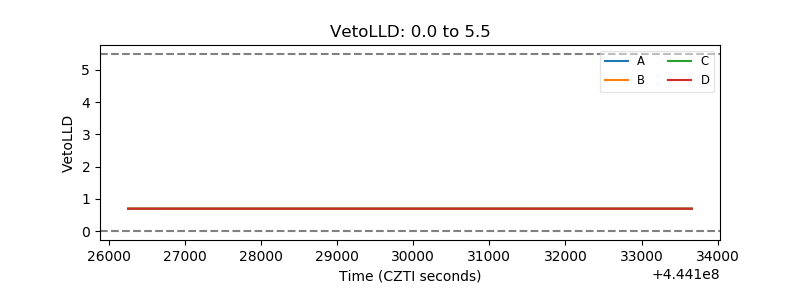 |
| Alpha Counter | 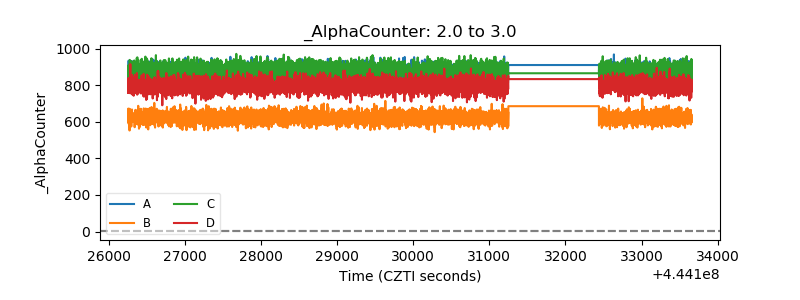 |
| _CPM_Rate | 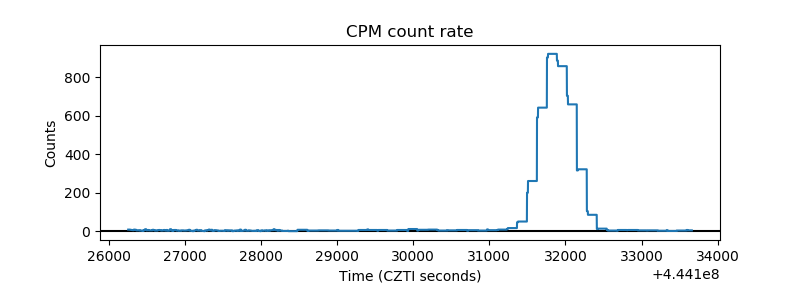 |
| CZT Counter | 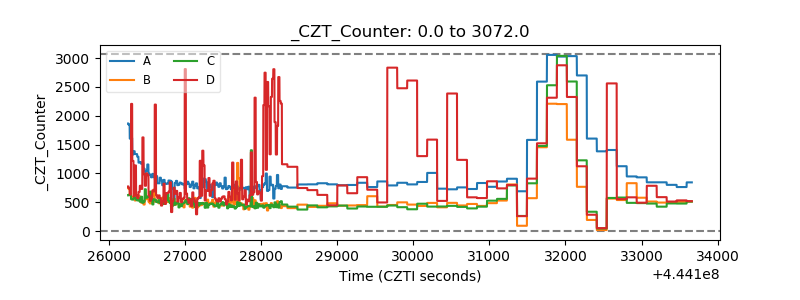 |
| +2.5 Volts monitor | 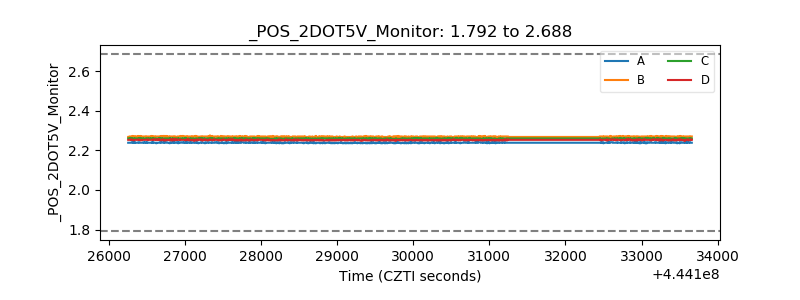 |
| +5 Volts monitor | 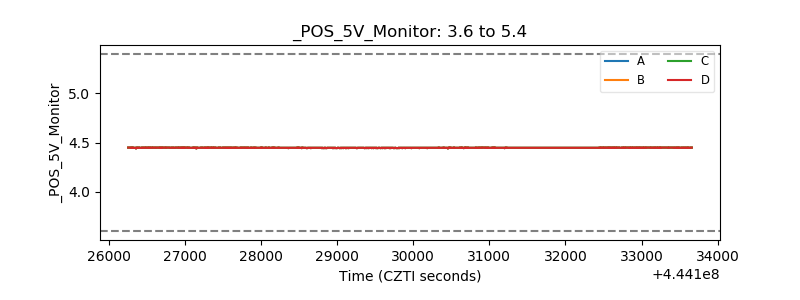 |
| _ROLL_ROT | 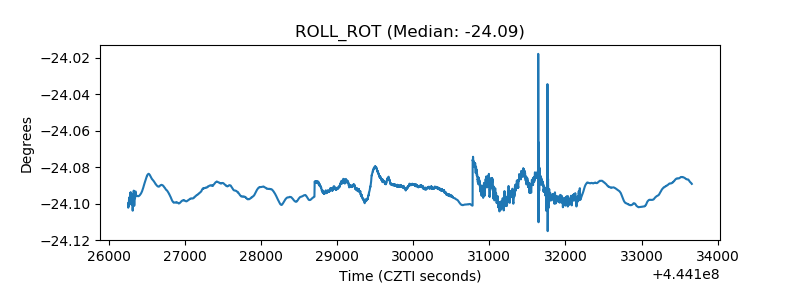 |
| _Roll_DEC | 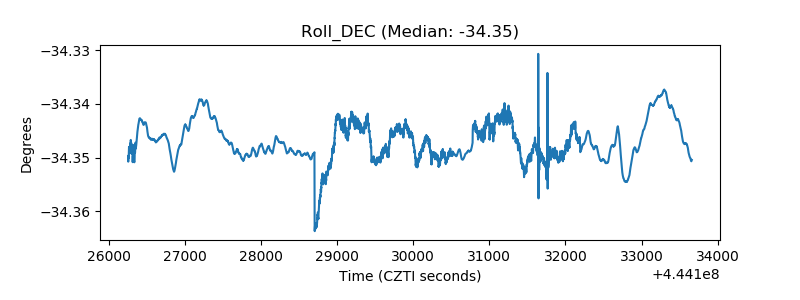 |
| _Roll_RA | 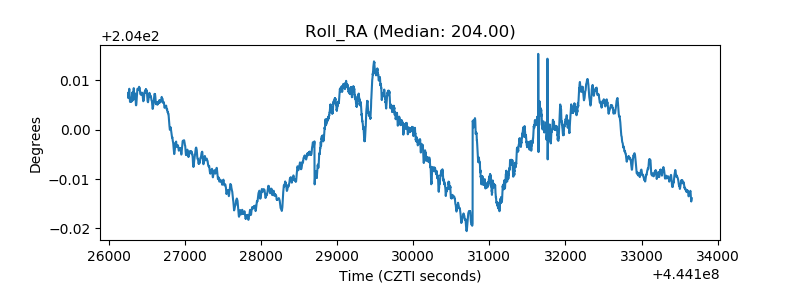 |
| Veto Counter | 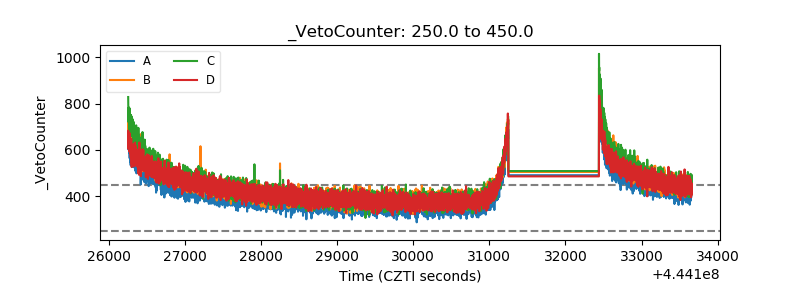 |