| Param | Original file | Final file |
|---|---|---|
| Filename | modeM0/AS1A13_020T01_9000006040_45069cztM0_level2.fits | modeM0/AS1A13_020T01_9000006040_45069cztM0_level2_quad_clean.evt |
| Size (bytes) | 454,944,960 | 109,644,480 |
| Size | 433.9 MB | 104.6 MB |
| Events in quadrant A | 5,212,266 | 736,679 |
| Events in quadrant B | 3,228,600 | 764,077 |
| Events in quadrant C | 3,130,997 | 727,736 |
| Events in quadrant D | 4,780,624 | 653,024 |
| Mode SS | |||
|---|---|---|---|
| Quadrant | BADHDUFLAG | Total packets | Discarded packets |
| A | 0 | 128 | 0 |
| B | 0 | 128 | 0 |
| C | 0 | 128 | 0 |
| D | 0 | 128 | 0 |
| Mode M9 | |||
|---|---|---|---|
| Quadrant | BADHDUFLAG | Total packets | Discarded packets |
| A | 0 | 11 | 0 |
| B | 0 | 11 | 0 |
| C | 0 | 11 | 0 |
| D | 0 | 11 | 0 |
| Mode M0 | |||
|---|---|---|---|
| Quadrant | BADHDUFLAG | Total packets | Discarded packets |
| A | 0 | 19760 | 1 |
| B | 0 | 13561 | 1 |
| C | 0 | 13420 | 1 |
| D | 0 | 18315 | 1 |
| Quadrant | Total seconds | Saturated seconds | Saturation percentage |
|---|---|---|---|
| A | 6283 | 198 | 3.151361% |
| B | 6284 | 154 | 2.450668% |
| C | 6284 | 152 | 2.418842% |
| D | 6284 | 361 | 5.744749% |
Noise dominated data is calculated using 1-second bins in cleaned event files. If a bin has >2000 counts, and if more than 50% of those come from <1% of pixels, then it is considered to be noise-dominated and hence unusable.
| Quadrant | # 1 sec bins | Bins with >0 counts | Bins with >2000 counts | High rate bins dominated by noise | Noise dominated (total time) | Noise dominated (detector-on time) | Marked lightcurve |
|---|---|---|---|---|---|---|---|
| A | 7418 | 6284 | 4 | 4 | 0.05% | 0.06% | 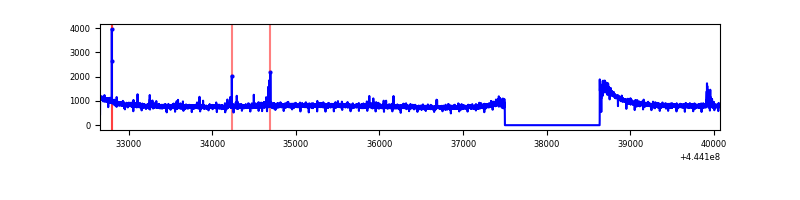 |
| B | 7419 | 6285 | 11 | 11 | 0.15% | 0.18% | 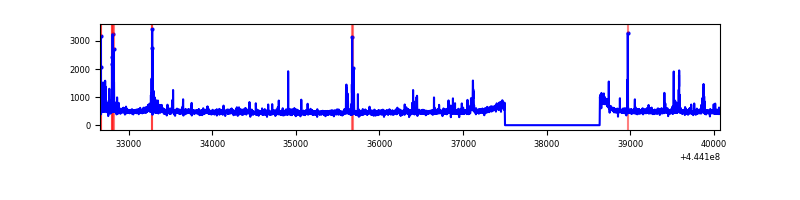 |
| C | 7419 | 6285 | 51 | 51 | 0.69% | 0.81% | 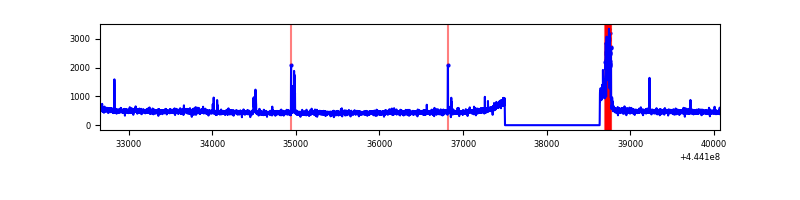 |
| D | 7419 | 6285 | 235 | 235 | 3.17% | 3.74% | 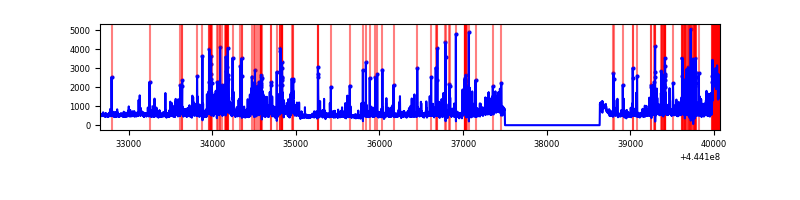 |
Top three noisy pixels from each quadrant. If the there are fewer than three noisy pixels in the level2.evt file, extra rows are filled as -1
| Pixel properties | Quadrant properties | ||||||
|---|---|---|---|---|---|---|---|
| Quadrant | DetID | PixID | Counts | Sigma | Mean | Median | Sigma |
| A | 10 | 83 | 2222832 | 14187.55 | 757 | 742 | 156.6 |
| A | 10 | 248 | 22286 | 137.55 | 757 | 742 | 156.6 |
| A | 7 | 3 | 21967 | 135.52 | 757 | 742 | 156.6 |
| B | 5 | 255 | 87852 | 595.13 | 756 | 733 | 146.4 |
| B | 10 | 3 | 69000 | 466.34 | 756 | 733 | 146.4 |
| B | 0 | 183 | 60196 | 406.2 | 756 | 733 | 146.4 |
| C | 1 | 241 | 144722 | 823.01 | 749 | 754 | 174.9 |
| C | 0 | 207 | 27947 | 155.45 | 749 | 754 | 174.9 |
| C | 3 | 233 | 16641 | 90.82 | 749 | 754 | 174.9 |
| D | 13 | 187 | 439086 | 2369.63 | 744 | 724 | 185.0 |
| D | 11 | 241 | 369430 | 1993.1 | 744 | 724 | 185.0 |
| D | 13 | 249 | 199967 | 1077.04 | 744 | 724 | 185.0 |
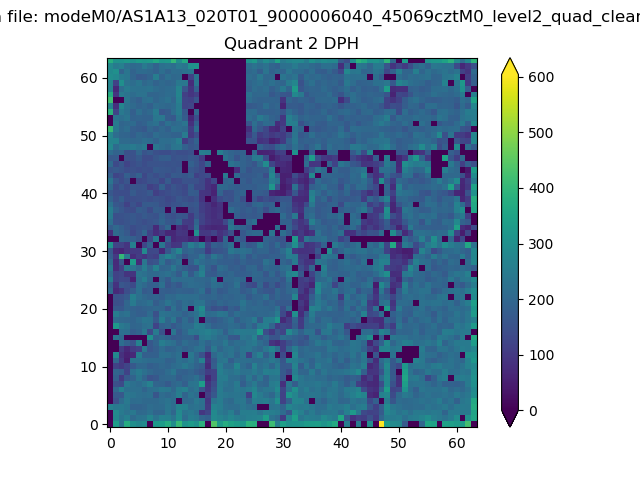
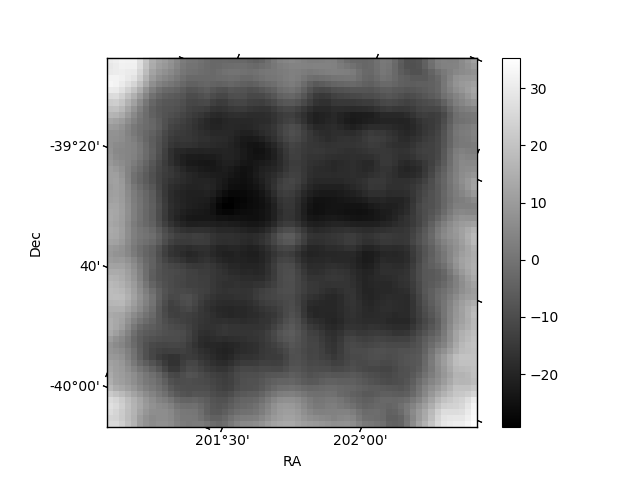
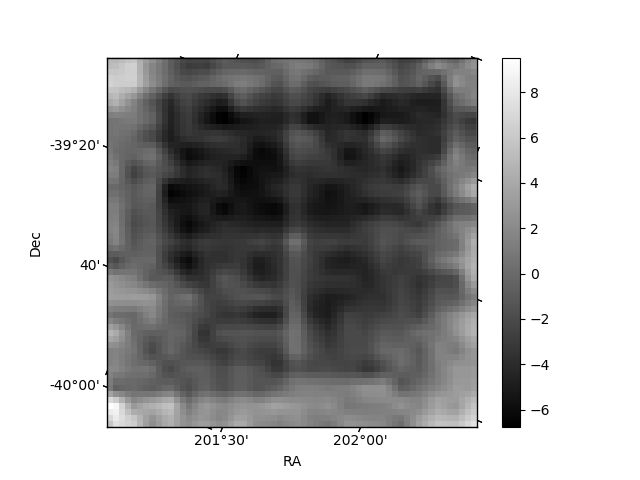
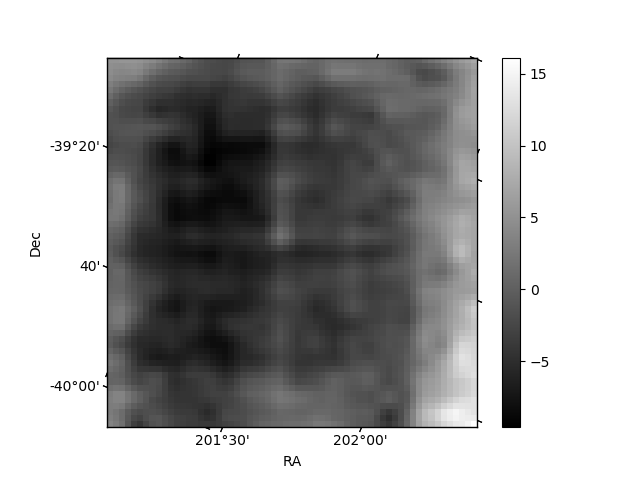
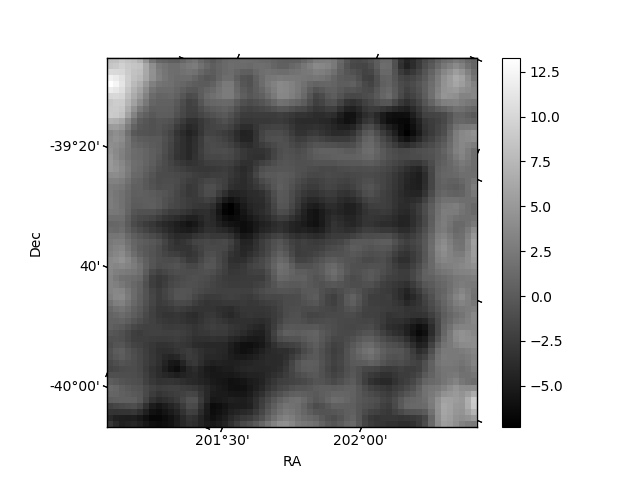
Histogram calculated using DETX and DETY for each event in the final _common_clean file
| Quadrant A | 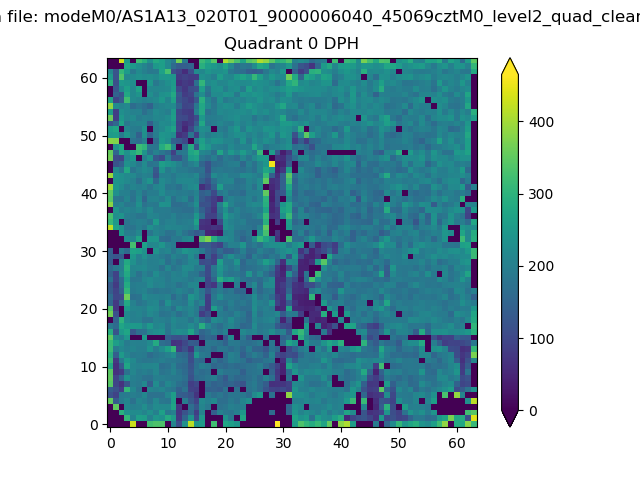 |
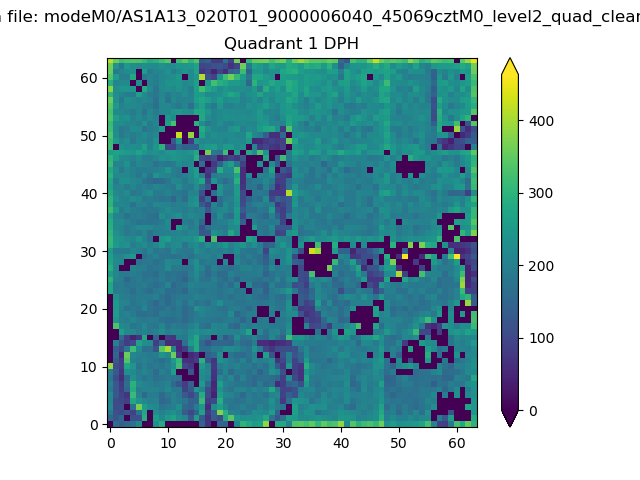 |
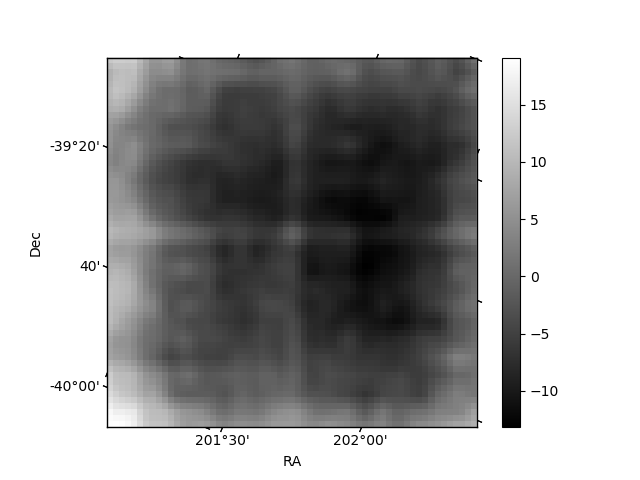
Quadrant B |
|---|---|---|---|
| Quadrant D | 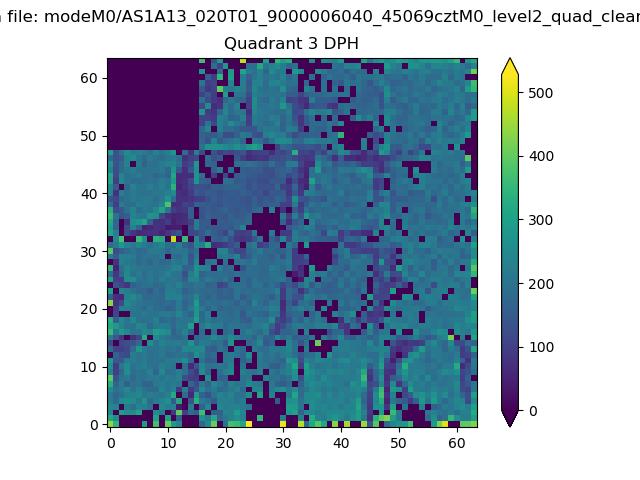 |
 |
Quadrant C |
| Plot type | Count rate plots | Images |
|---|---|---|
| Comparison with Poisson distribution Blue bars denote a histogram of data divided into 1 sec bins. Red curve is a Poisson curve with rate = median count rate of data. |
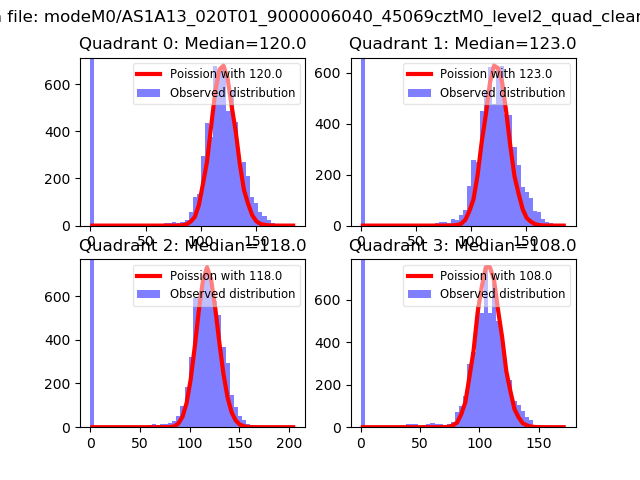 |
 |
| Quadrant-wise count rates Data is divided into 100 sec bins |
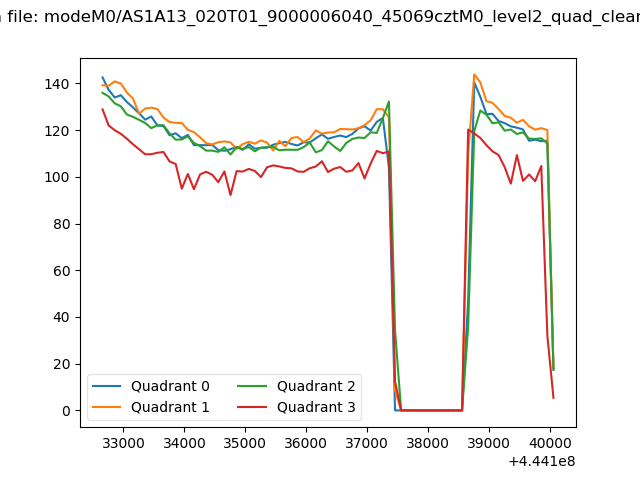 |
|
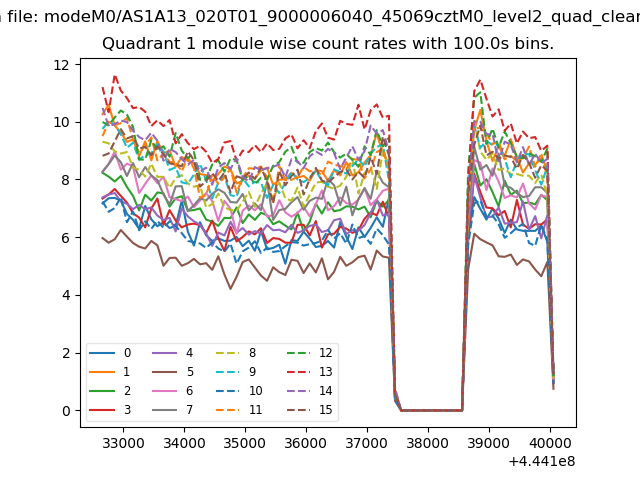
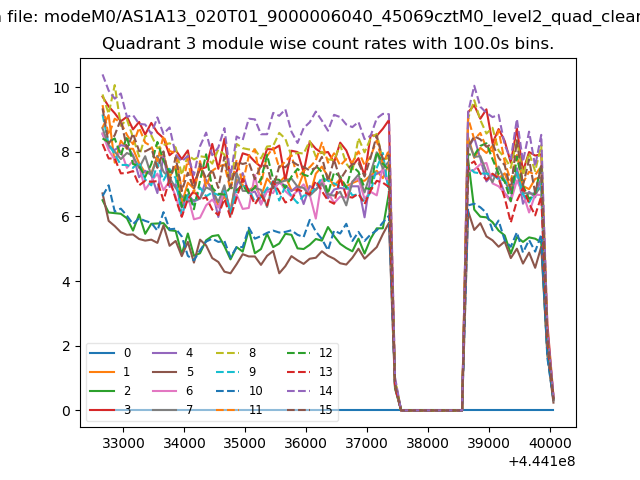
| Module-wise count rates for Quadrant A Data is divided into 100 sec bins |
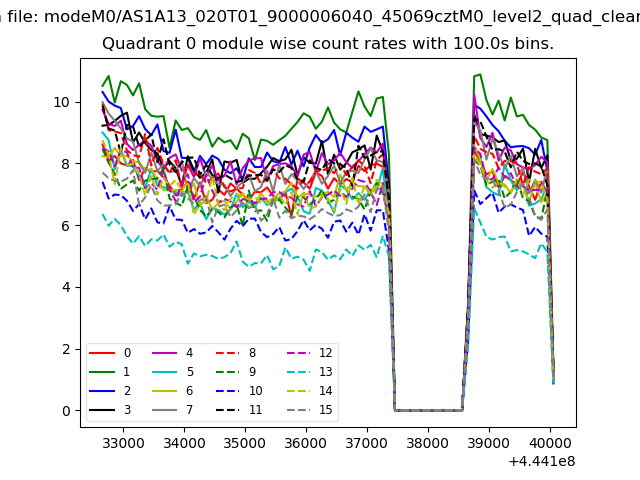 |
 |
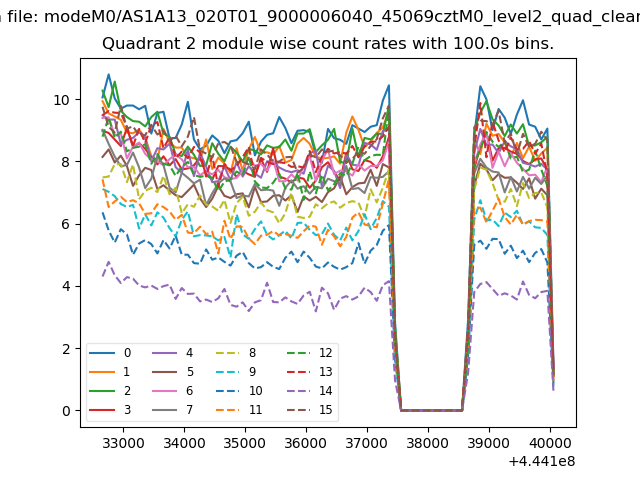
| Module-wise count rates for Quadrant B Data is divided into 100 sec bins |
 |
 |
| Module-wise count rates for Quadrant C Data is divided into 100 sec bins |
 |
 |
| Module-wise count rates for Quadrant D Data is divided into 100 sec bins |
 |
 |
| Parameter | Plot |
|---|---|
| CZT HV Monitor | 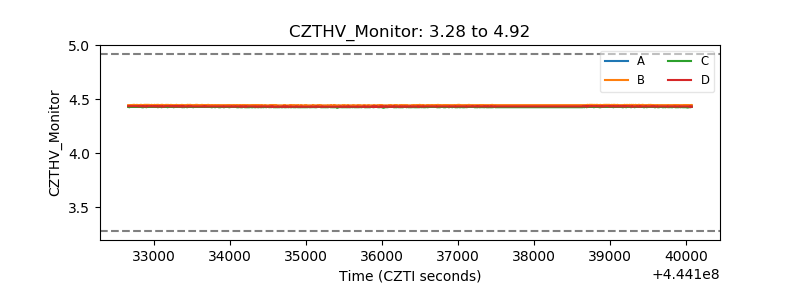 |
| D_VDD | 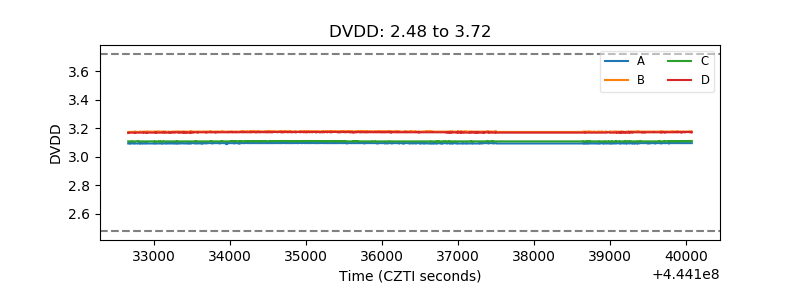 |
| Temperature 1 | 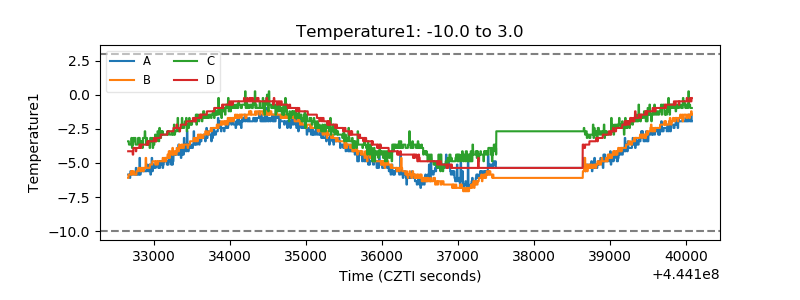 |
| Veto HV Monitor | 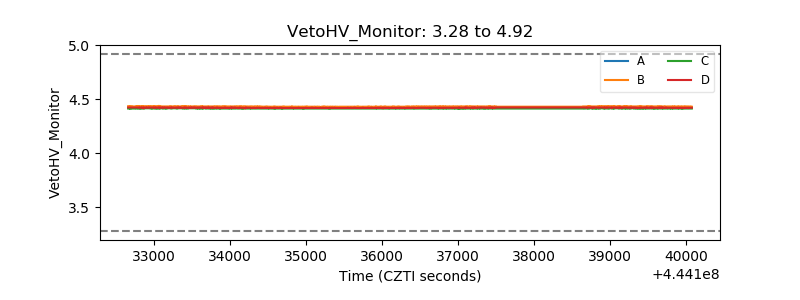 |
| Veto LLD | 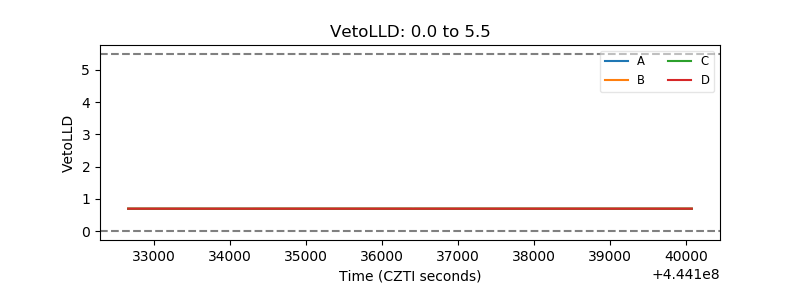 |
| Alpha Counter | 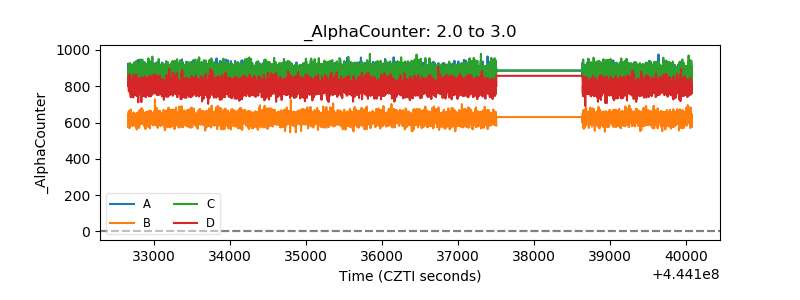 |
| _CPM_Rate | 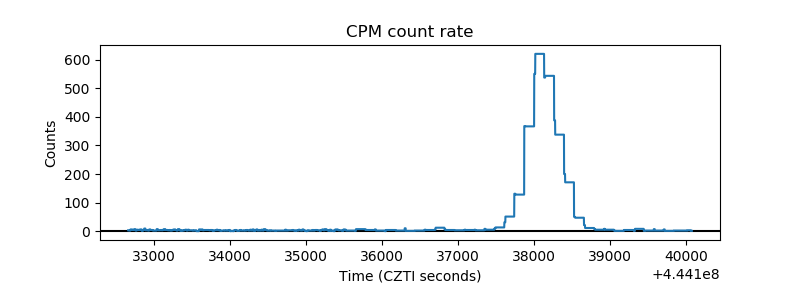 |
| CZT Counter | 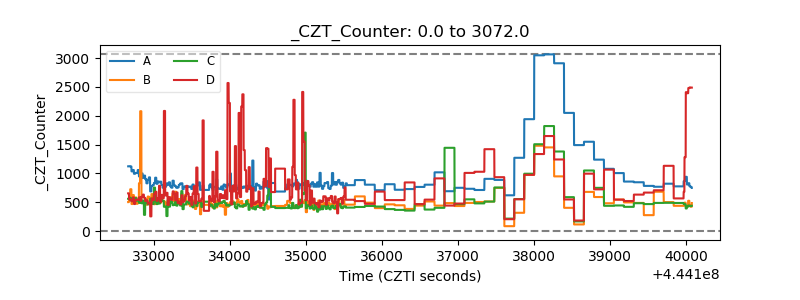 |
| +2.5 Volts monitor | 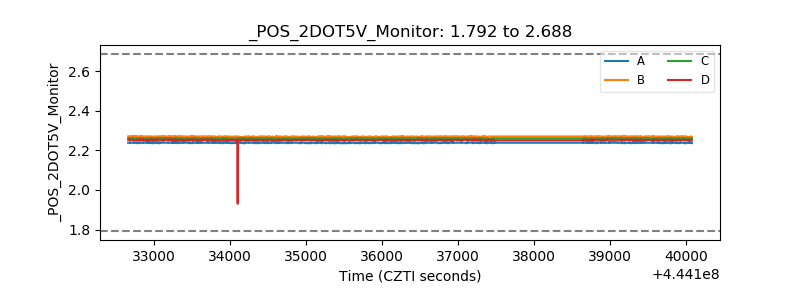 |
| +5 Volts monitor | 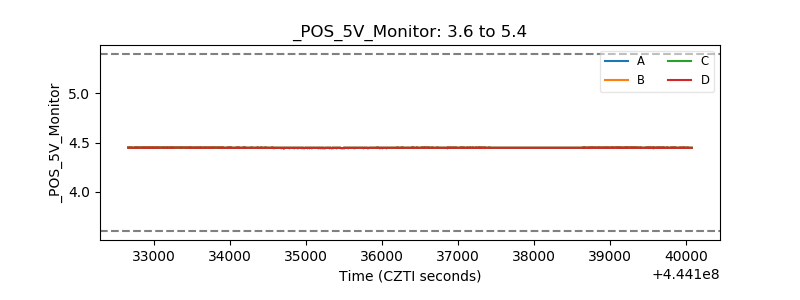 |
| _ROLL_ROT | 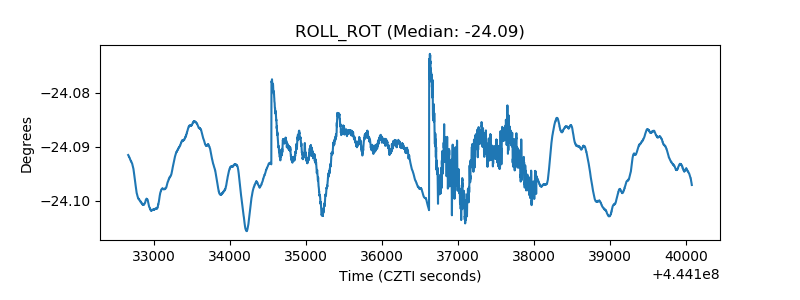 |
| _Roll_DEC | 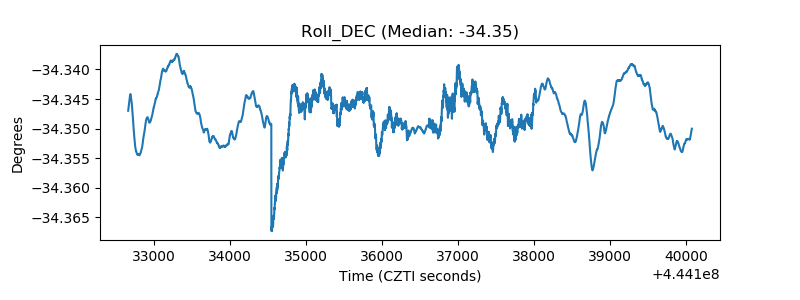 |
| _Roll_RA | 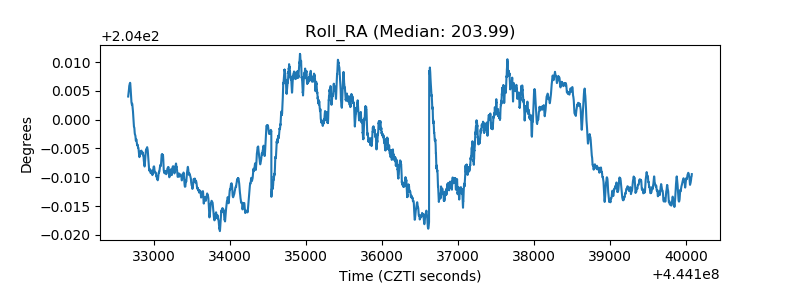 |
| Veto Counter | 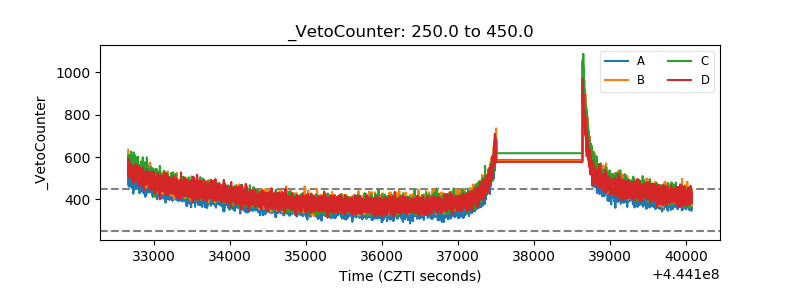 |