| Param | Original file | Final file |
|---|---|---|
| Filename | modeM0/AS1A13_020T01_9000006040_45070cztM0_level2.fits | modeM0/AS1A13_020T01_9000006040_45070cztM0_level2_quad_clean.evt |
| Size (bytes) | 557,303,040 | 116,824,320 |
| Size | 531.5 MB | 111.4 MB |
| Events in quadrant A | 6,106,010 | 773,188 |
| Events in quadrant B | 3,625,217 | 812,219 |
| Events in quadrant C | 3,622,945 | 779,309 |
| Events in quadrant D | 6,727,616 | 680,586 |
| Mode SS | |||
|---|---|---|---|
| Quadrant | BADHDUFLAG | Total packets | Discarded packets |
| A | 0 | 144 | 0 |
| B | 0 | 144 | 0 |
| C | 0 | 144 | 0 |
| D | 0 | 144 | 0 |
| Mode M9 | |||
|---|---|---|---|
| Quadrant | BADHDUFLAG | Total packets | Discarded packets |
| A | 0 | 10 | 0 |
| B | 0 | 10 | 0 |
| C | 0 | 10 | 0 |
| D | 0 | 10 | 0 |
| Mode M0 | |||
|---|---|---|---|
| Quadrant | BADHDUFLAG | Total packets | Discarded packets |
| A | 0 | 22927 | 5 |
| B | 0 | 15386 | 2 |
| C | 0 | 15566 | 2 |
| D | 0 | 25048 | 2 |
| Quadrant | Total seconds | Saturated seconds | Saturation percentage |
|---|---|---|---|
| A | 7063 | 427 | 6.045590% |
| B | 7064 | 281 | 3.977916% |
| C | 7064 | 267 | 3.779728% |
| D | 7064 | 702 | 9.937712% |
Noise dominated data is calculated using 1-second bins in cleaned event files. If a bin has >2000 counts, and if more than 50% of those come from <1% of pixels, then it is considered to be noise-dominated and hence unusable.
| Quadrant | # 1 sec bins | Bins with >0 counts | Bins with >2000 counts | High rate bins dominated by noise | Noise dominated (total time) | Noise dominated (detector-on time) | Marked lightcurve |
|---|---|---|---|---|---|---|---|
| A | 8038 | 7064 | 46 | 46 | 0.57% | 0.65% | 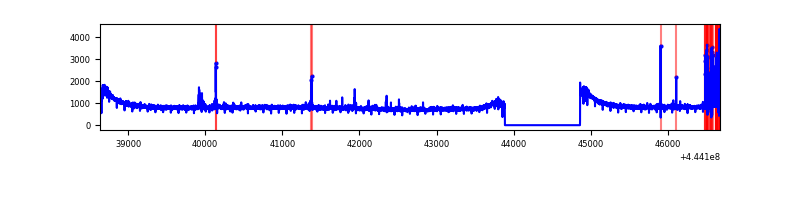 |
| B | 8039 | 7065 | 22 | 22 | 0.27% | 0.31% | 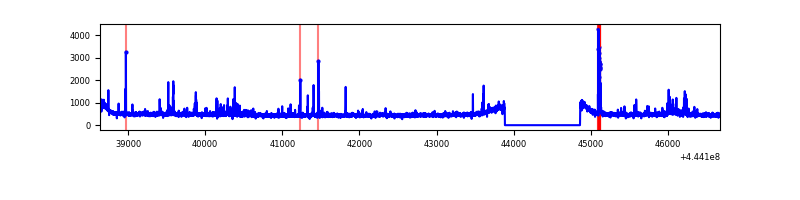 |
| C | 8039 | 7065 | 64 | 64 | 0.80% | 0.91% | 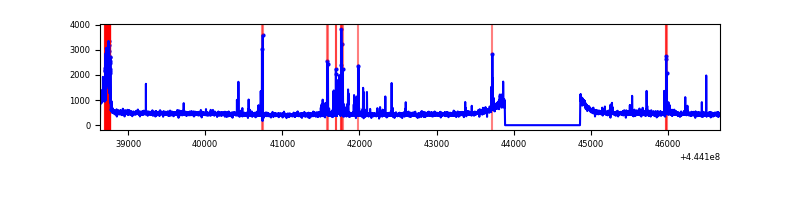 |
| D | 8039 | 7065 | 463 | 463 | 5.76% | 6.55% | 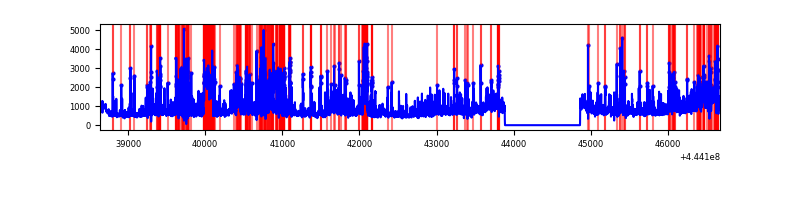 |
Top three noisy pixels from each quadrant. If the there are fewer than three noisy pixels in the level2.evt file, extra rows are filled as -1
| Pixel properties | Quadrant properties | ||||||
|---|---|---|---|---|---|---|---|
| Quadrant | DetID | PixID | Counts | Sigma | Mean | Median | Sigma |
| A | 10 | 83 | 2637449 | 15048.37 | 844 | 828 | 175.2 |
| A | 13 | 248 | 157863 | 896.27 | 844 | 828 | 175.2 |
| A | 10 | 248 | 29154 | 161.67 | 844 | 828 | 175.2 |
| B | 5 | 255 | 155862 | 924.45 | 847 | 822 | 167.7 |
| B | 0 | 183 | 45334 | 265.41 | 847 | 822 | 167.7 |
| B | 0 | 186 | 32212 | 187.17 | 847 | 822 | 167.7 |
| C | 14 | 254 | 163295 | 828.43 | 838 | 842 | 196.1 |
| C | 1 | 241 | 144390 | 732.02 | 838 | 842 | 196.1 |
| C | 1 | 3 | 35340 | 175.92 | 838 | 842 | 196.1 |
| D | 11 | 241 | 1510980 | 7315.64 | 824 | 799 | 206.4 |
| D | 13 | 187 | 520251 | 2516.34 | 824 | 799 | 206.4 |
| D | 1 | 52 | 398507 | 1926.58 | 824 | 799 | 206.4 |
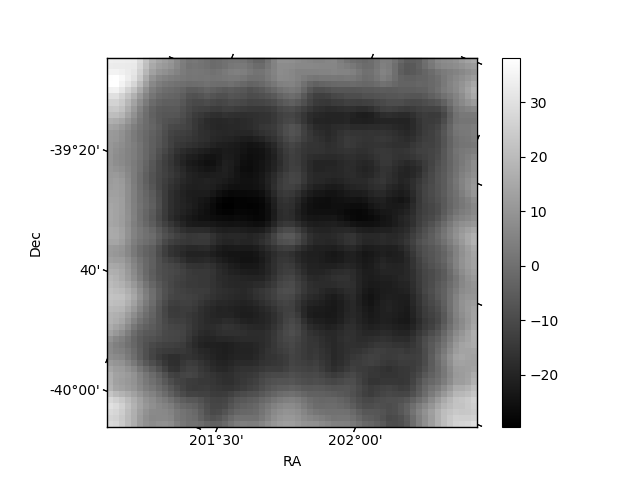
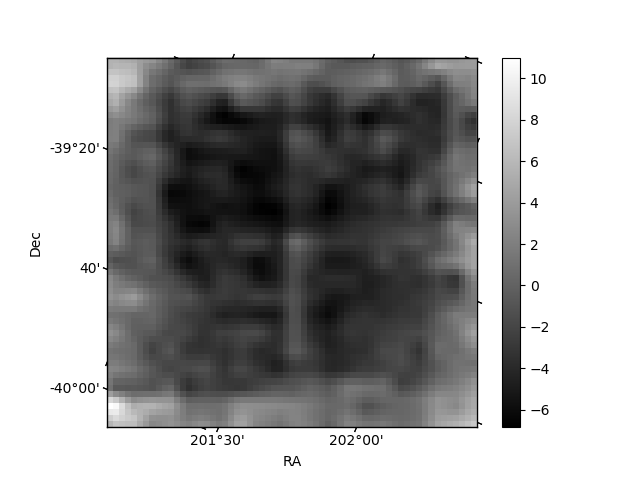
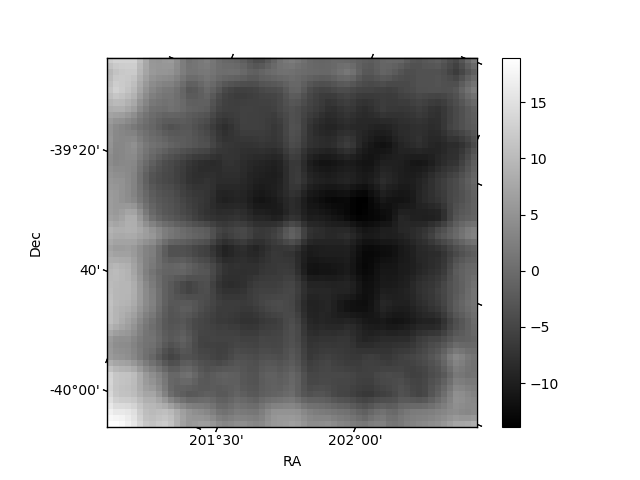
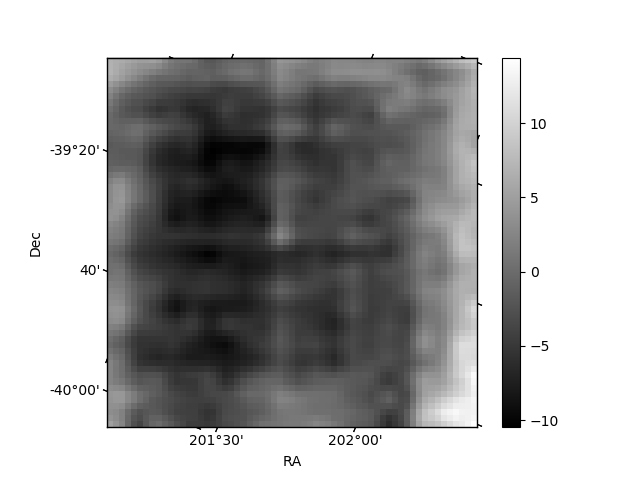
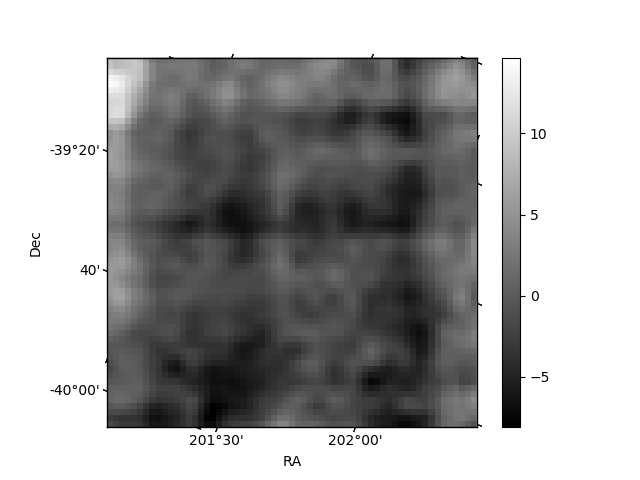
Histogram calculated using DETX and DETY for each event in the final _common_clean file
| Quadrant A | 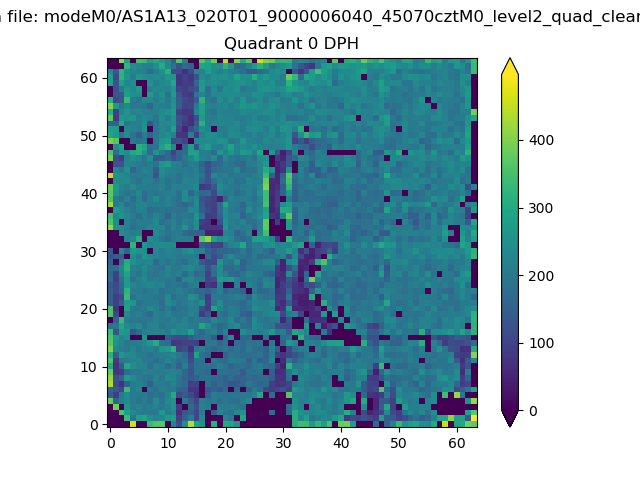 |
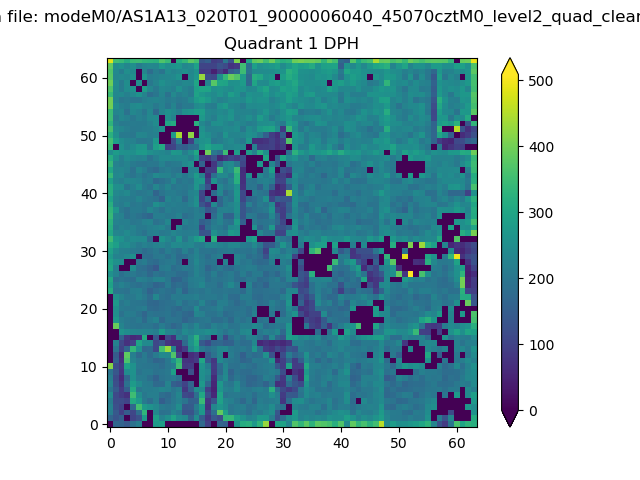 |
Quadrant B |
|---|---|---|---|
| Quadrant D | 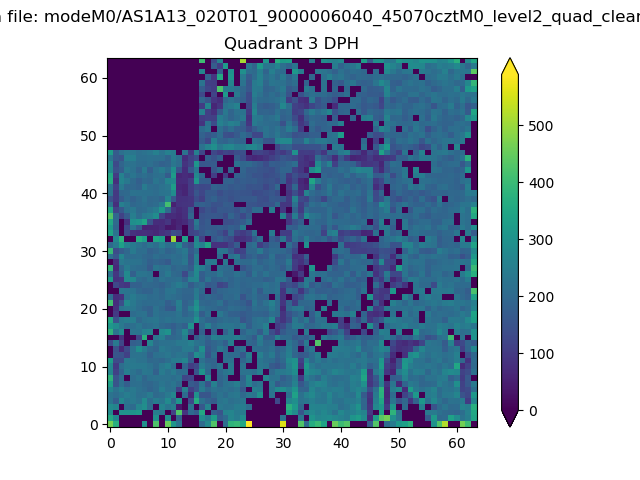 |
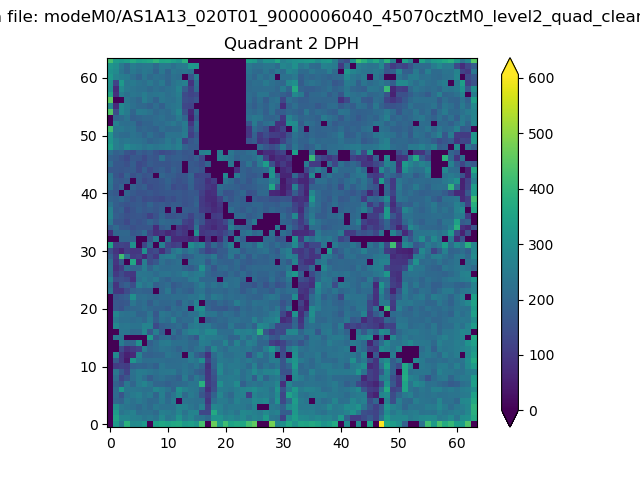 |
Quadrant C |
| Plot type | Count rate plots | Images |
|---|---|---|
| Comparison with Poisson distribution Blue bars denote a histogram of data divided into 1 sec bins. Red curve is a Poisson curve with rate = median count rate of data. |
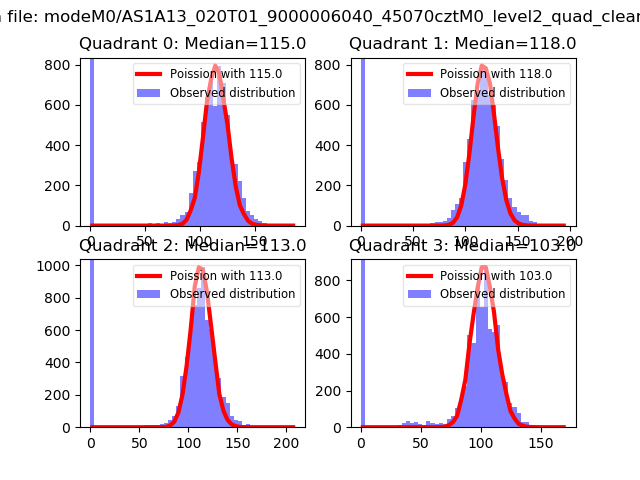 |
 |
| Quadrant-wise count rates Data is divided into 100 sec bins |
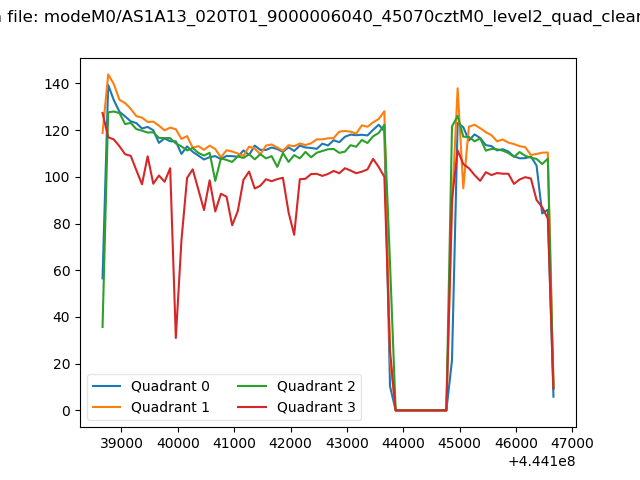 |
|
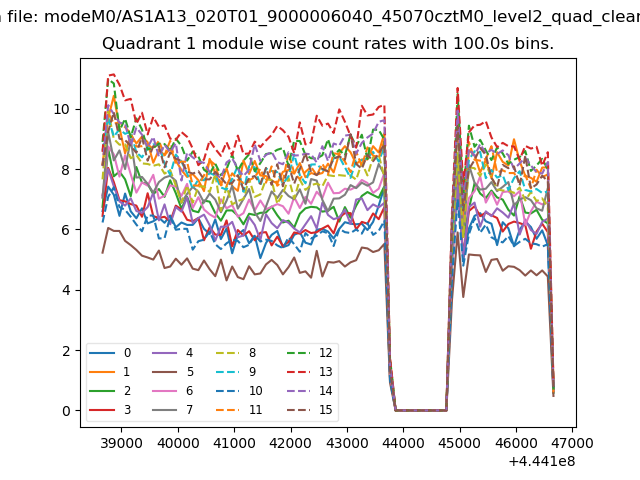
| Module-wise count rates for Quadrant A Data is divided into 100 sec bins |
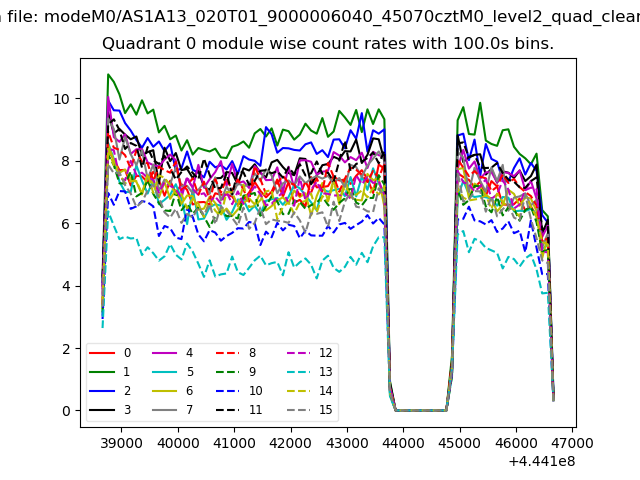 |
 |
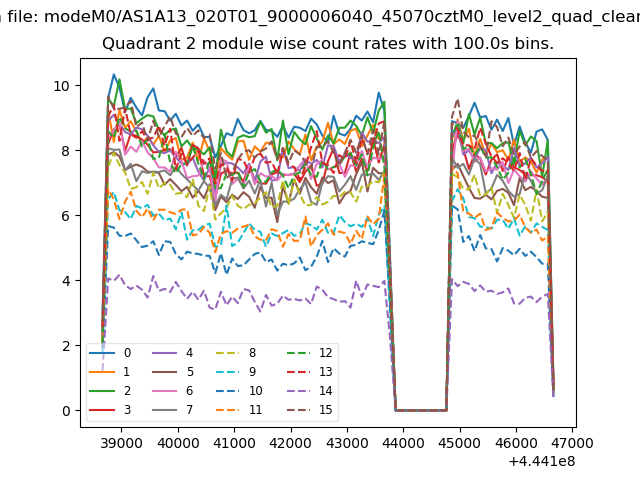
| Module-wise count rates for Quadrant B Data is divided into 100 sec bins |
 |
 |
| Module-wise count rates for Quadrant C Data is divided into 100 sec bins |
 |
 |
| Module-wise count rates for Quadrant D Data is divided into 100 sec bins |
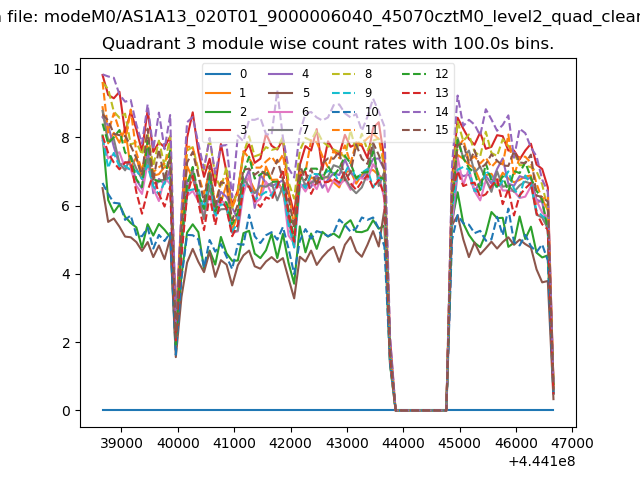 |
 |
| Parameter | Plot |
|---|---|
| CZT HV Monitor | 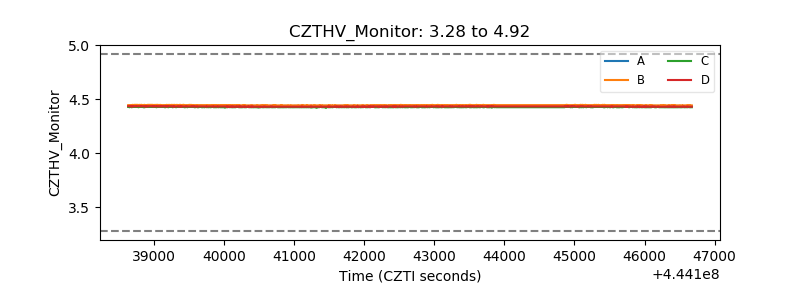 |
| D_VDD | 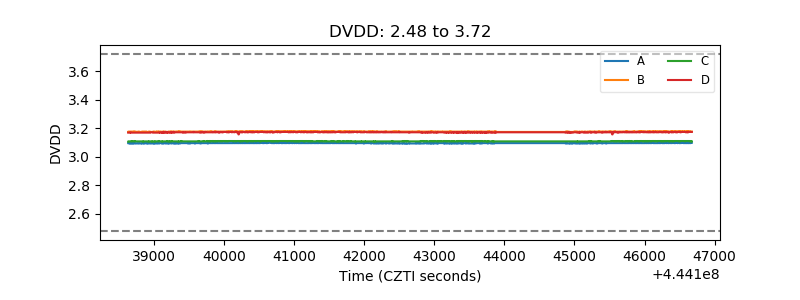 |
| Temperature 1 | 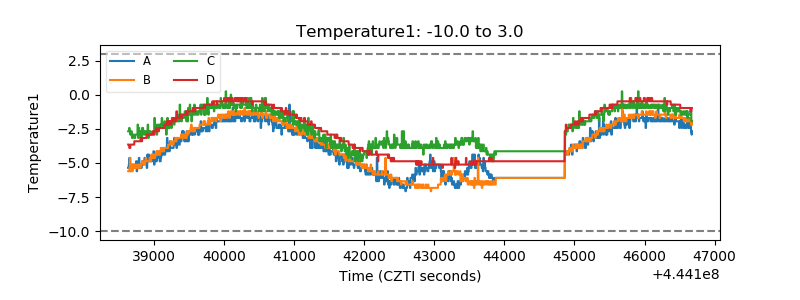 |
| Veto HV Monitor |  |
| Veto LLD | 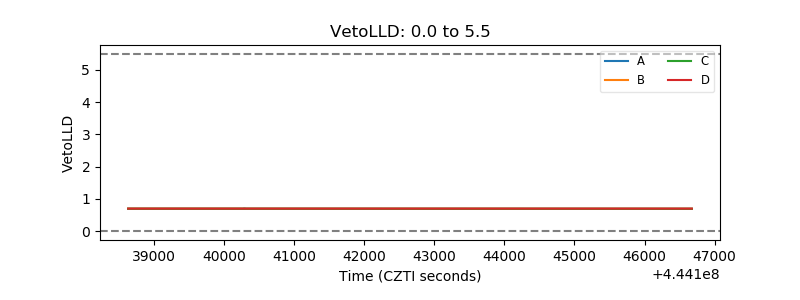 |
| Alpha Counter | 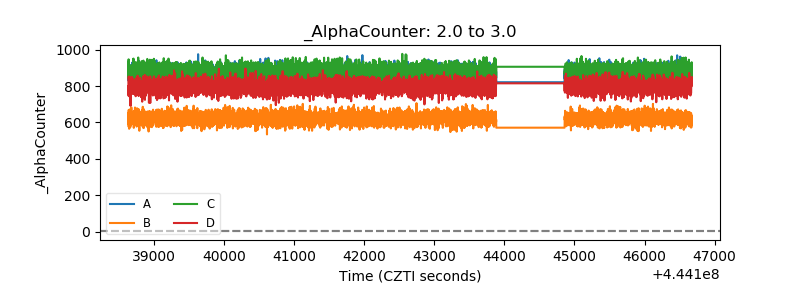 |
| _CPM_Rate | 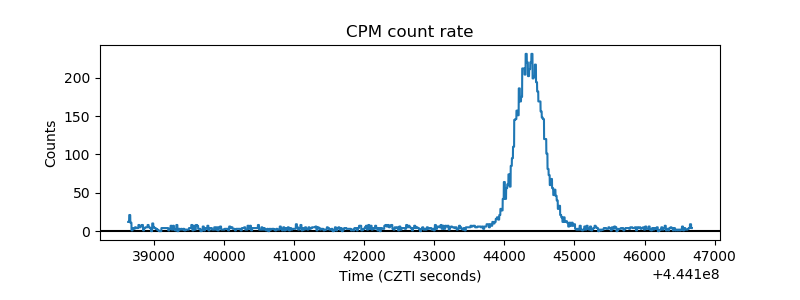 |
| CZT Counter | 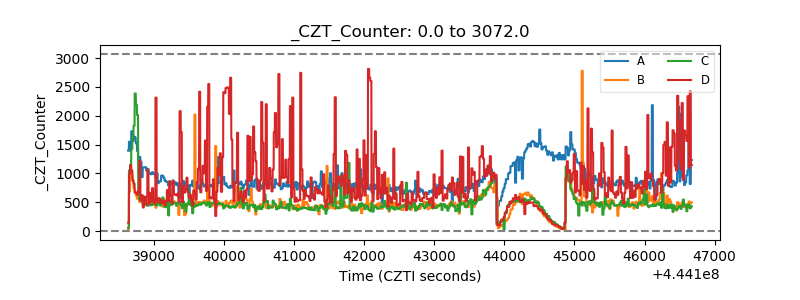 |
| +2.5 Volts monitor | 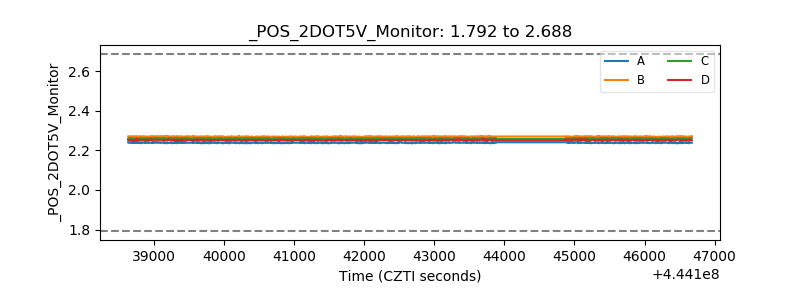 |
| +5 Volts monitor | 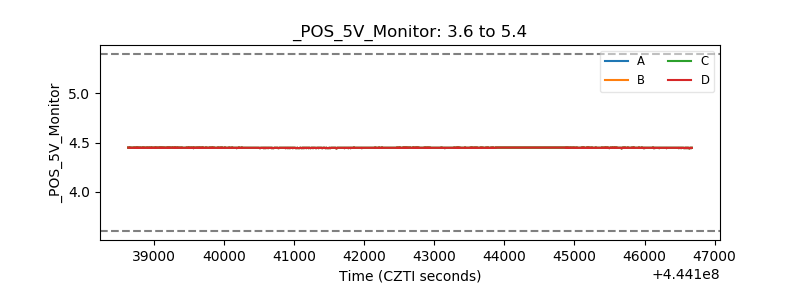 |
| _ROLL_ROT | 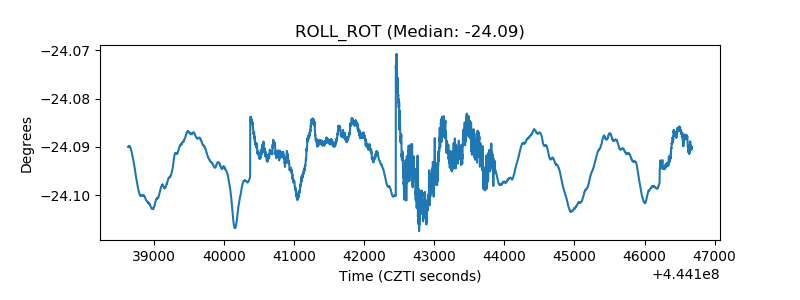 |
| _Roll_DEC | 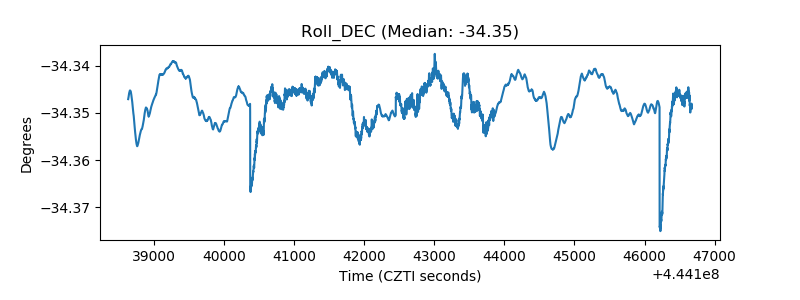 |
| _Roll_RA | 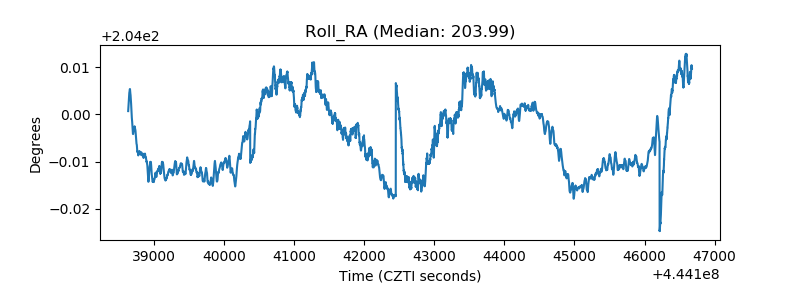 |
| Veto Counter | 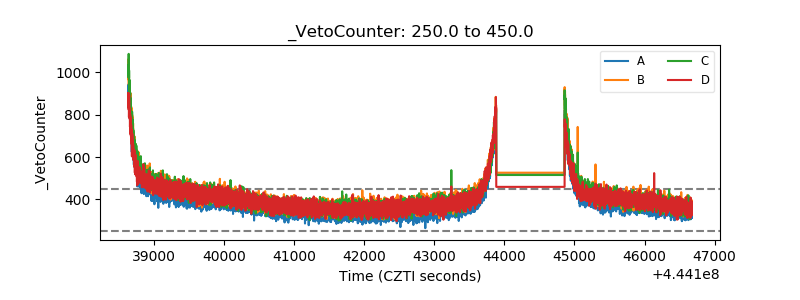 |