| Param | Original file | Final file |
|---|---|---|
| Filename | modeM0/AS1A13_020T01_9000006040_45071cztM0_level2.fits | modeM0/AS1A13_020T01_9000006040_45071cztM0_level2_quad_clean.evt |
| Size (bytes) | 562,659,840 | 110,730,240 |
| Size | 536.6 MB | 105.6 MB |
| Events in quadrant A | 5,803,781 | 730,070 |
| Events in quadrant B | 3,437,735 | 762,882 |
| Events in quadrant C | 3,370,365 | 745,468 |
| Events in quadrant D | 7,678,041 | 631,108 |
| Mode SS | |||
|---|---|---|---|
| Quadrant | BADHDUFLAG | Total packets | Discarded packets |
| A | 0 | 140 | 0 |
| B | 0 | 140 | 0 |
| C | 0 | 140 | 0 |
| D | 0 | 140 | 0 |
| Mode M9 | |||
|---|---|---|---|
| Quadrant | BADHDUFLAG | Total packets | Discarded packets |
| A | 0 | 7 | 0 |
| B | 0 | 7 | 0 |
| C | 0 | 7 | 0 |
| D | 0 | 7 | 0 |
| Mode M0 | |||
|---|---|---|---|
| Quadrant | BADHDUFLAG | Total packets | Discarded packets |
| A | 0 | 22114 | 1 |
| B | 0 | 14874 | 1 |
| C | 0 | 14939 | 1 |
| D | 0 | 27756 | 3 |
| Quadrant | Total seconds | Saturated seconds | Saturation percentage |
|---|---|---|---|
| A | 6937 | 359 | 5.175148% |
| B | 6938 | 212 | 3.055636% |
| C | 6938 | 169 | 2.435860% |
| D | 6937 | 878 | 12.656768% |
Noise dominated data is calculated using 1-second bins in cleaned event files. If a bin has >2000 counts, and if more than 50% of those come from <1% of pixels, then it is considered to be noise-dominated and hence unusable.
| Quadrant | # 1 sec bins | Bins with >0 counts | Bins with >2000 counts | High rate bins dominated by noise | Noise dominated (total time) | Noise dominated (detector-on time) | Marked lightcurve |
|---|---|---|---|---|---|---|---|
| A | 7607 | 6938 | 65 | 65 | 0.85% | 0.94% | 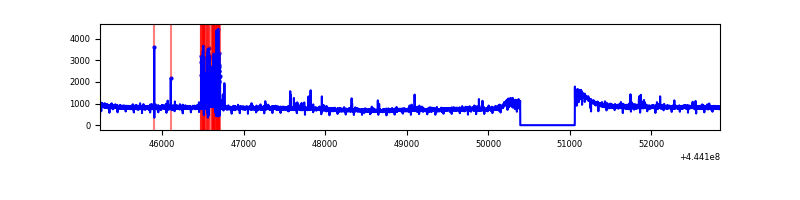 |
| B | 7608 | 6939 | 9 | 9 | 0.12% | 0.13% | 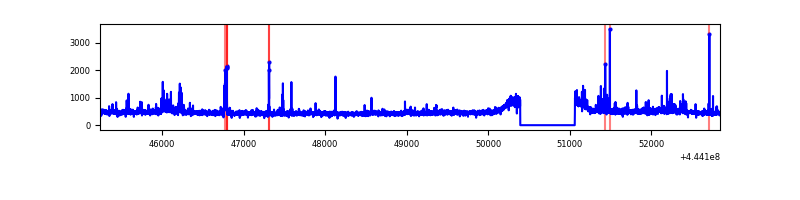 |
| C | 7608 | 6939 | 36 | 36 | 0.47% | 0.52% | 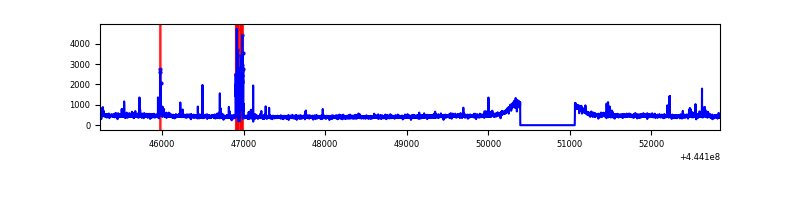 |
| D | 7607 | 6938 | 684 | 684 | 8.99% | 9.86% | 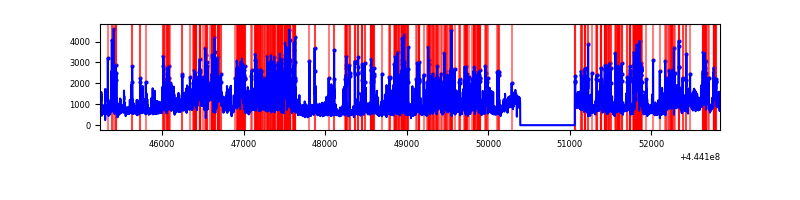 |
Top three noisy pixels from each quadrant. If the there are fewer than three noisy pixels in the level2.evt file, extra rows are filled as -1
| Pixel properties | Quadrant properties | ||||||
|---|---|---|---|---|---|---|---|
| Quadrant | DetID | PixID | Counts | Sigma | Mean | Median | Sigma |
| A | 10 | 83 | 2434609 | 14522.52 | 803 | 786 | 167.6 |
| A | 13 | 248 | 221721 | 1318.31 | 803 | 786 | 167.6 |
| A | 10 | 248 | 25211 | 145.74 | 803 | 786 | 167.6 |
| B | 0 | 186 | 68537 | 420.68 | 807 | 782 | 161.1 |
| B | 0 | 183 | 54946 | 336.3 | 807 | 782 | 161.1 |
| B | 5 | 255 | 40645 | 247.51 | 807 | 782 | 161.1 |
| C | 14 | 254 | 179279 | 938.5 | 801 | 807 | 190.2 |
| C | 15 | 208 | 29650 | 151.67 | 801 | 807 | 190.2 |
| C | 3 | 233 | 19551 | 98.57 | 801 | 807 | 190.2 |
| D | 11 | 241 | 2604279 | 13173.88 | 775 | 751 | 197.6 |
| D | 13 | 249 | 419017 | 2116.43 | 775 | 751 | 197.6 |
| D | 5 | 235 | 417068 | 2106.57 | 775 | 751 | 197.6 |
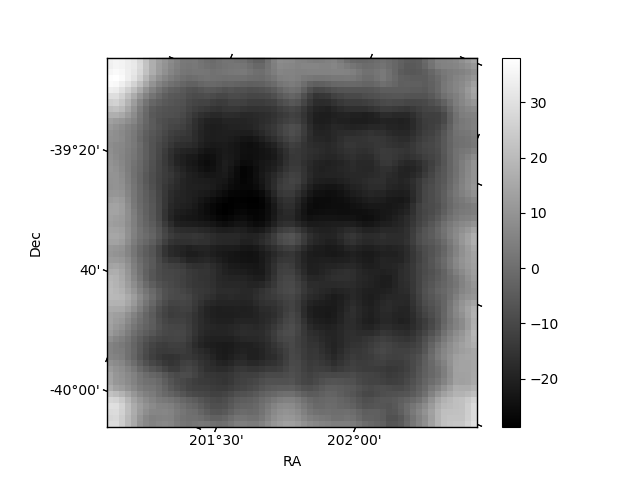
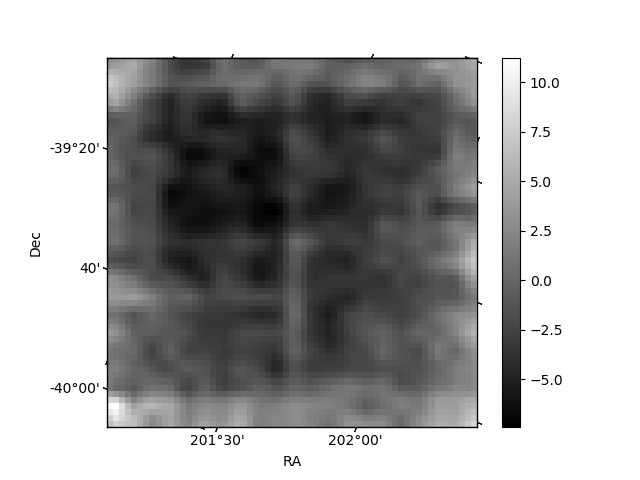
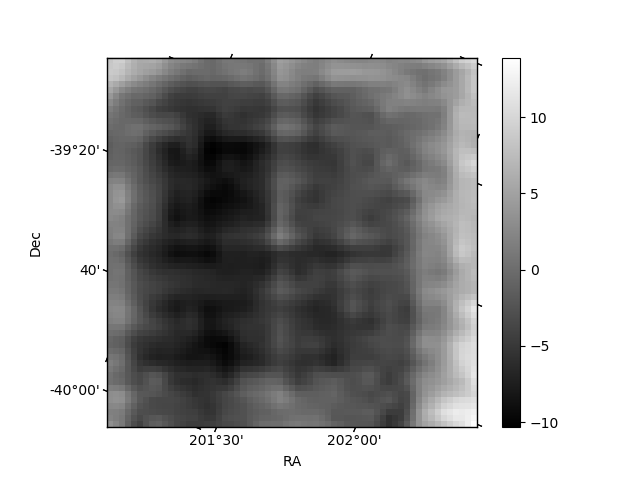
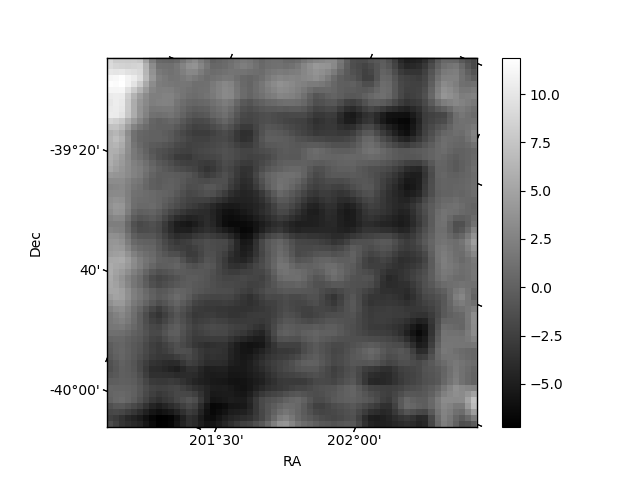
Histogram calculated using DETX and DETY for each event in the final _common_clean file
| Quadrant A | 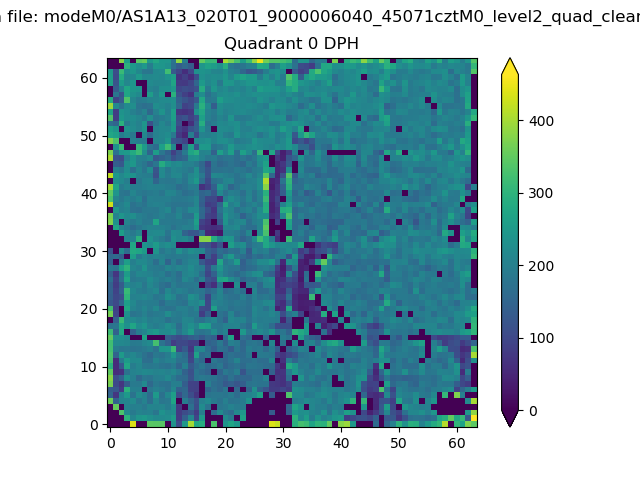 |
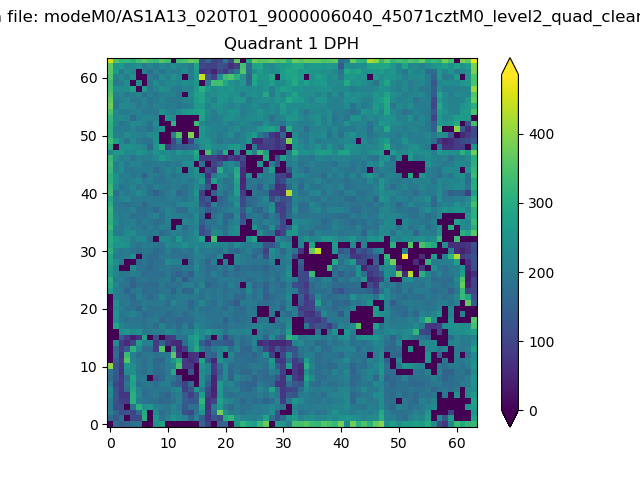 |
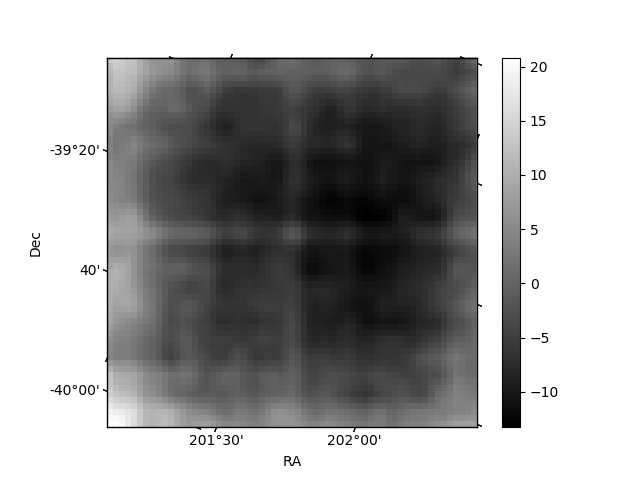
Quadrant B |
|---|---|---|---|
| Quadrant D | 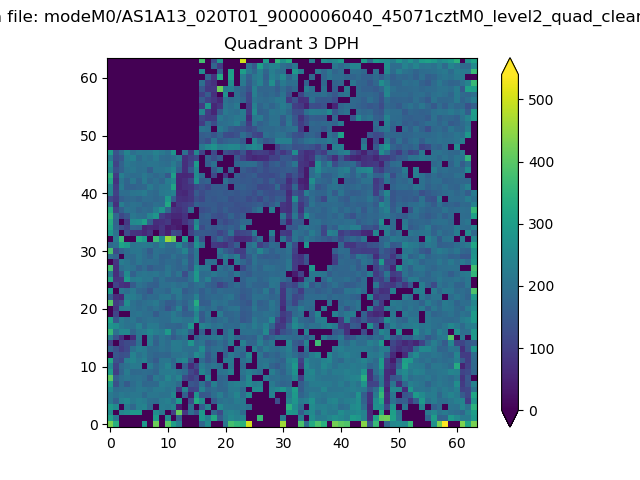 |
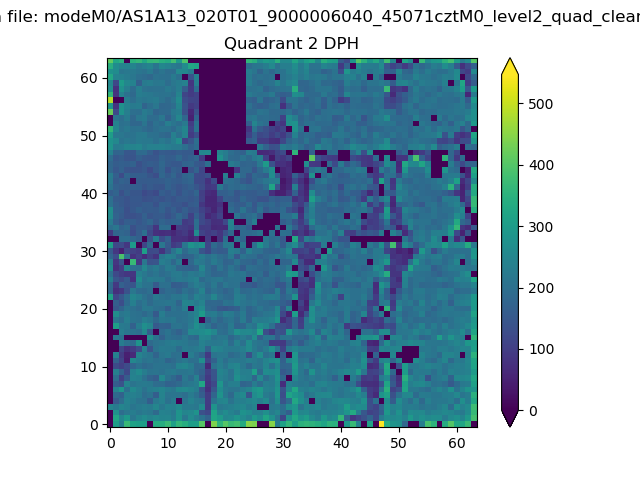 |
Quadrant C |
| Plot type | Count rate plots | Images |
|---|---|---|
| Comparison with Poisson distribution Blue bars denote a histogram of data divided into 1 sec bins. Red curve is a Poisson curve with rate = median count rate of data. |
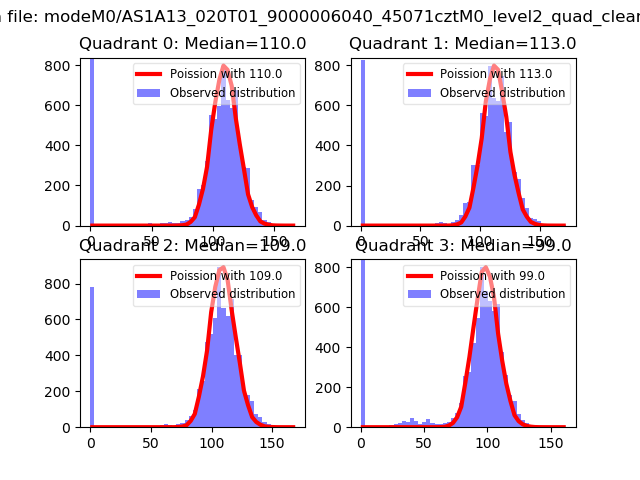 |
 |
| Quadrant-wise count rates Data is divided into 100 sec bins |
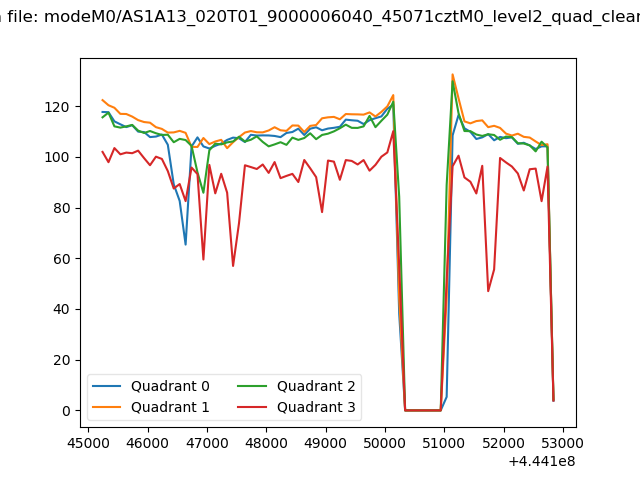 |
|
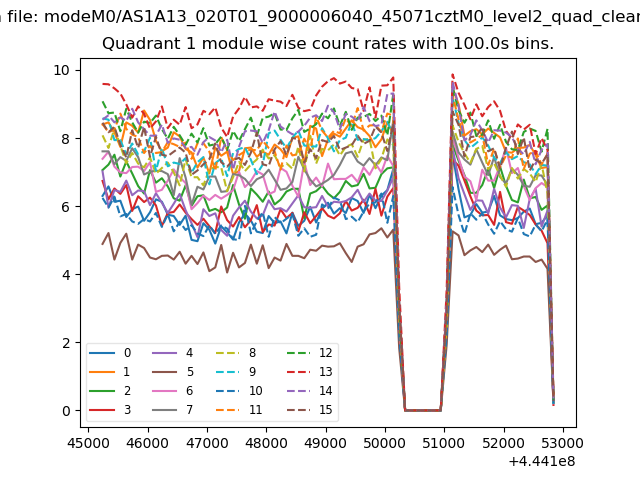
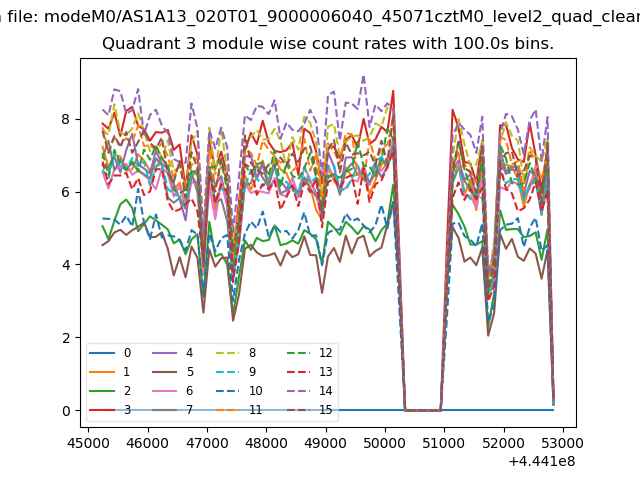
| Module-wise count rates for Quadrant A Data is divided into 100 sec bins |
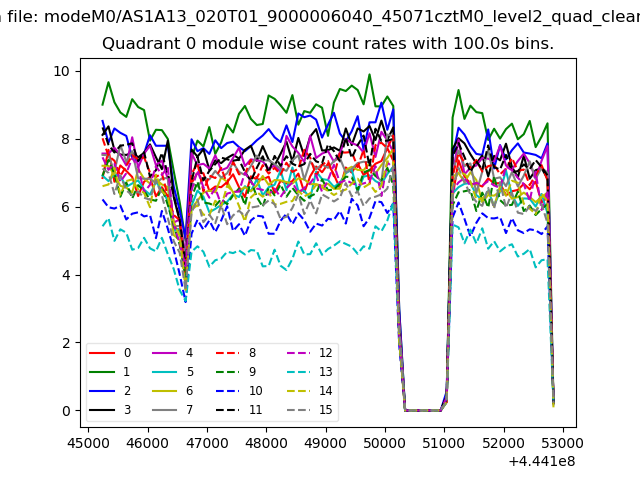 |
 |
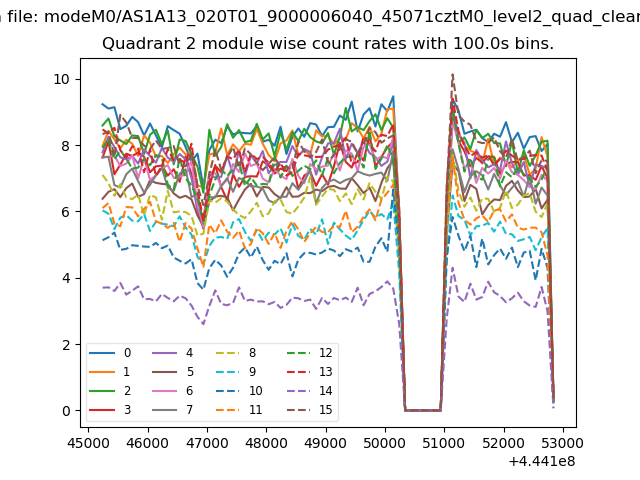
| Module-wise count rates for Quadrant B Data is divided into 100 sec bins |
 |
 |
| Module-wise count rates for Quadrant C Data is divided into 100 sec bins |
 |
 |
| Module-wise count rates for Quadrant D Data is divided into 100 sec bins |
 |
 |
| Parameter | Plot |
|---|---|
| CZT HV Monitor | 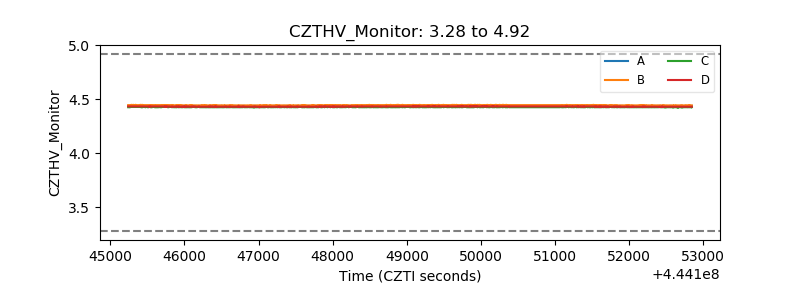 |
| D_VDD | 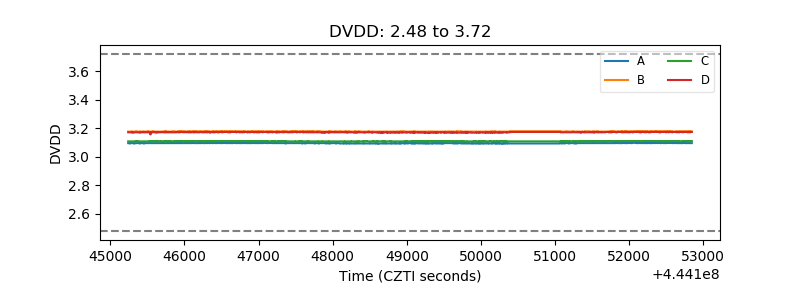 |
| Temperature 1 | 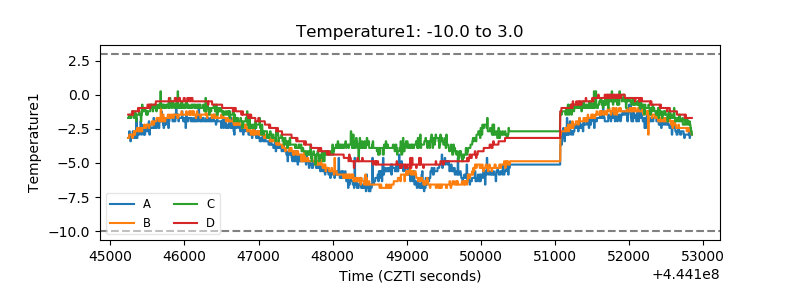 |
| Veto HV Monitor | 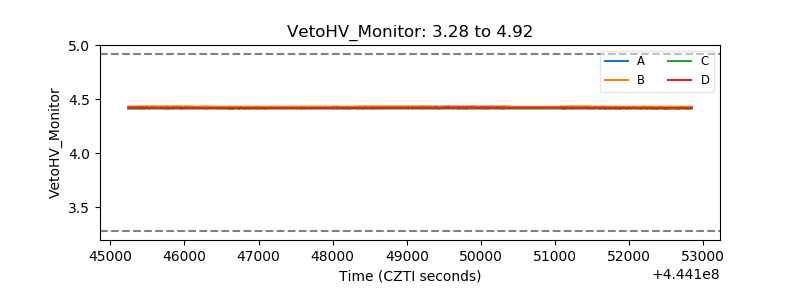 |
| Veto LLD | 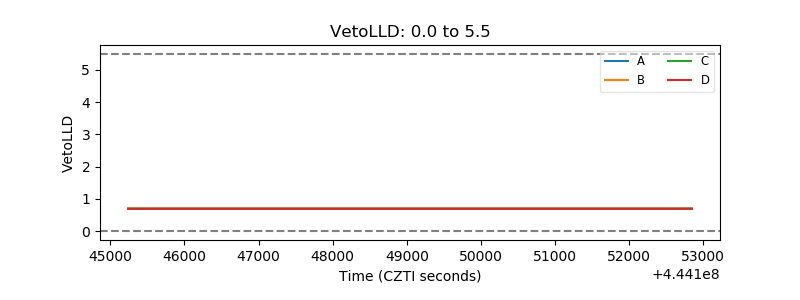 |
| Alpha Counter | 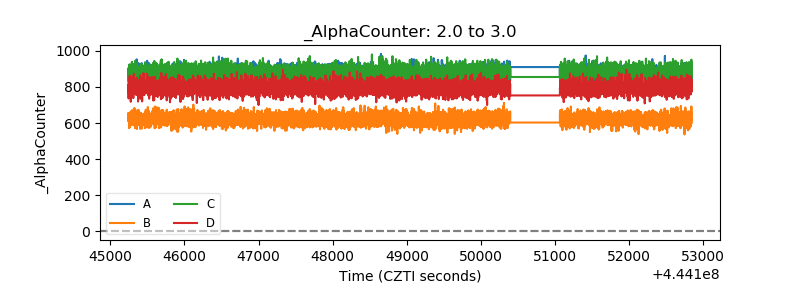 |
| _CPM_Rate | 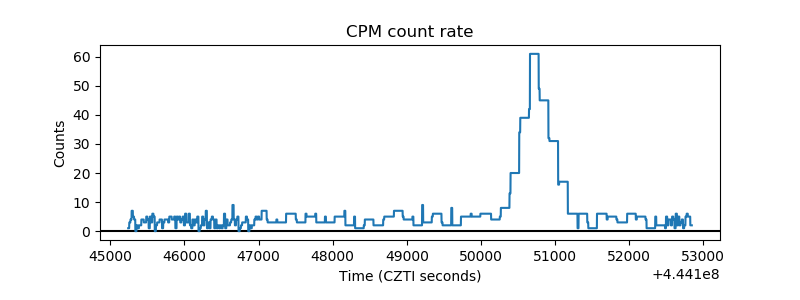 |
| CZT Counter | 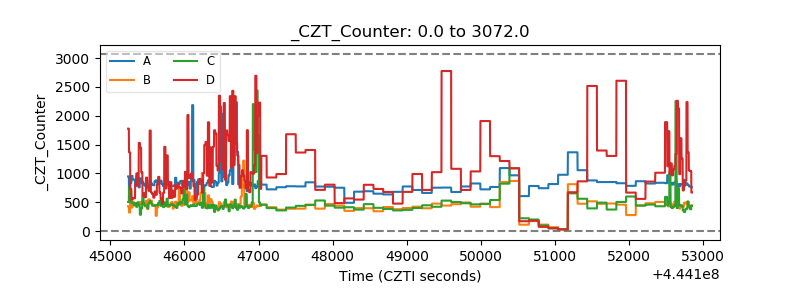 |
| +2.5 Volts monitor | 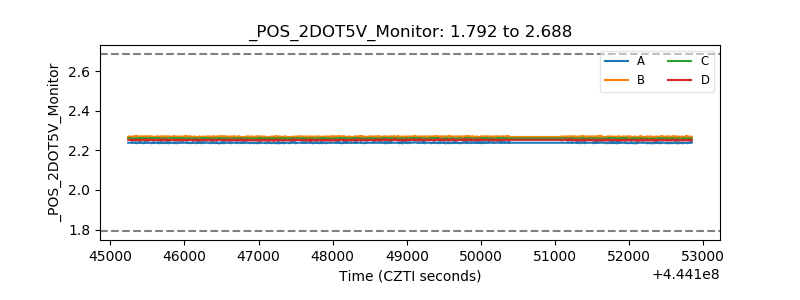 |
| +5 Volts monitor | 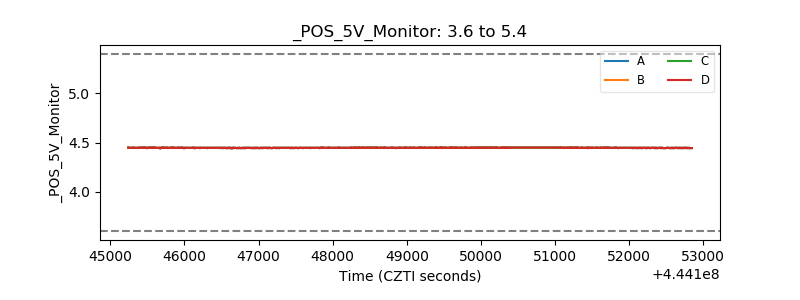 |
| _ROLL_ROT | 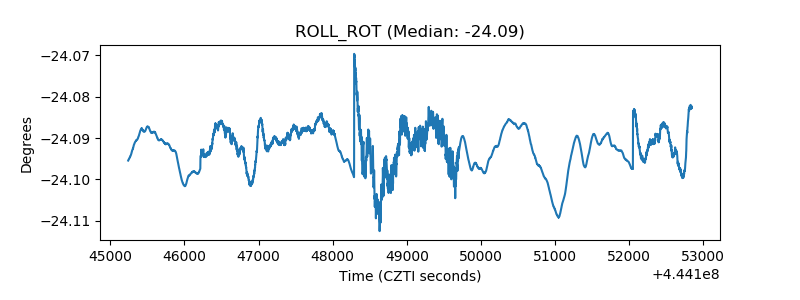 |
| _Roll_DEC | 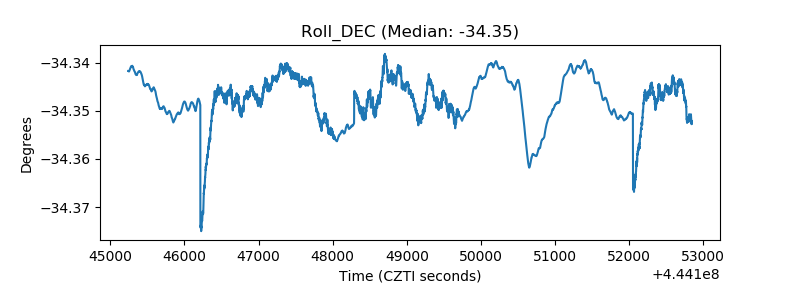 |
| _Roll_RA | 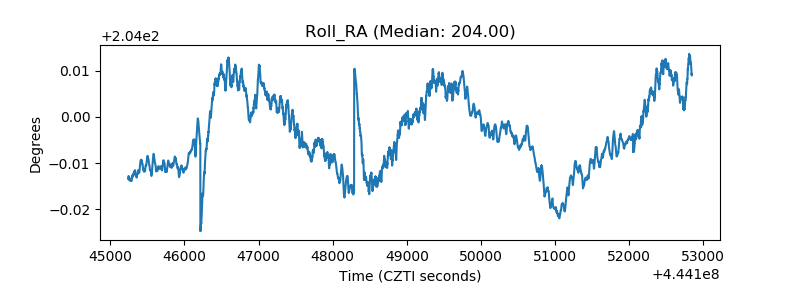 |
| Veto Counter | 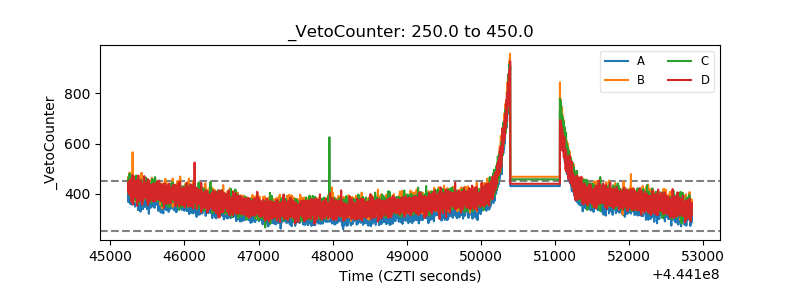 |