| Param | Original file | Final file |
|---|---|---|
| Filename | modeM0/AS1A13_020T01_9000006040_45072cztM0_level2.fits | modeM0/AS1A13_020T01_9000006040_45072cztM0_level2_quad_clean.evt |
| Size (bytes) | 602,130,240 | 123,122,880 |
| Size | 574.2 MB | 117.4 MB |
| Events in quadrant A | 6,428,828 | 803,790 |
| Events in quadrant B | 3,927,333 | 838,817 |
| Events in quadrant C | 3,758,716 | 834,538 |
| Events in quadrant D | 7,573,259 | 711,783 |
| Mode SS | |||
|---|---|---|---|
| Quadrant | BADHDUFLAG | Total packets | Discarded packets |
| A | 0 | 156 | 0 |
| B | 0 | 156 | 0 |
| C | 0 | 156 | 0 |
| D | 0 | 156 | 0 |
| Mode M9 | |||
|---|---|---|---|
| Quadrant | BADHDUFLAG | Total packets | Discarded packets |
| A | 0 | 5 | 0 |
| B | 0 | 6 | 0 |
| C | 0 | 6 | 0 |
| D | 0 | 6 | 0 |
| Mode M0 | |||
|---|---|---|---|
| Quadrant | BADHDUFLAG | Total packets | Discarded packets |
| A | 0 | 24594 | 3 |
| B | 0 | 16907 | 2 |
| C | 0 | 16742 | 2 |
| D | 0 | 27914 | 2 |
| Quadrant | Total seconds | Saturated seconds | Saturation percentage |
|---|---|---|---|
| A | 7751 | 406 | 5.238034% |
| B | 7751 | 296 | 3.818862% |
| C | 7751 | 120 | 1.548187% |
| D | 7751 | 820 | 10.579280% |
Noise dominated data is calculated using 1-second bins in cleaned event files. If a bin has >2000 counts, and if more than 50% of those come from <1% of pixels, then it is considered to be noise-dominated and hence unusable.
| Quadrant | # 1 sec bins | Bins with >0 counts | Bins with >2000 counts | High rate bins dominated by noise | Noise dominated (total time) | Noise dominated (detector-on time) | Marked lightcurve |
|---|---|---|---|---|---|---|---|
| A | 7976 | 7752 | 7 | 7 | 0.09% | 0.09% | 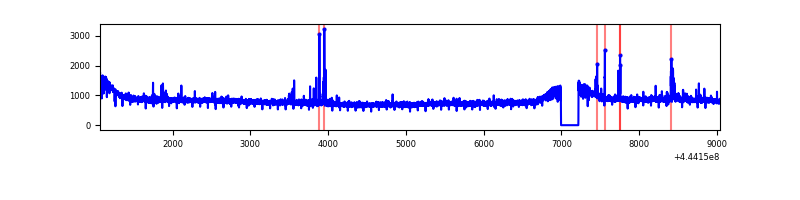 |
| B | 7976 | 7752 | 11 | 11 | 0.14% | 0.14% | 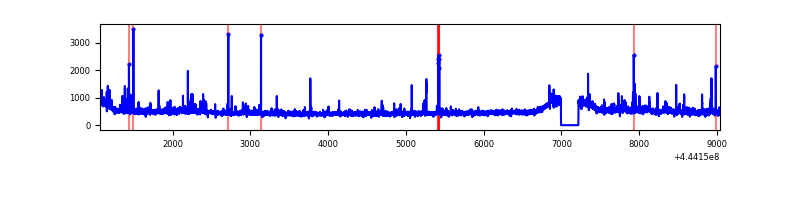 |
| C | 7976 | 7752 | 17 | 17 | 0.21% | 0.22% | 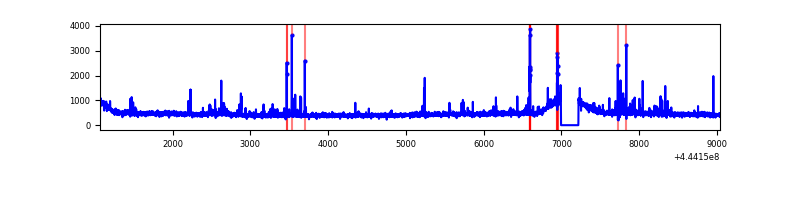 |
| D | 7976 | 7752 | 537 | 537 | 6.73% | 6.93% | 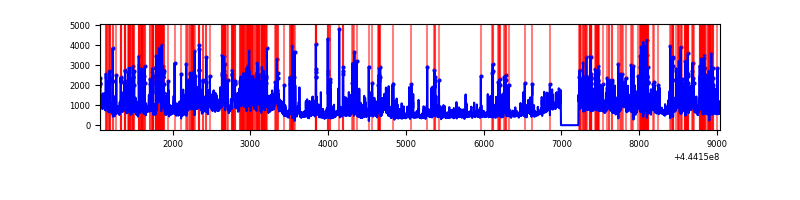 |
Top three noisy pixels from each quadrant. If the there are fewer than three noisy pixels in the level2.evt file, extra rows are filled as -1
| Pixel properties | Quadrant properties | ||||||
|---|---|---|---|---|---|---|---|
| Quadrant | DetID | PixID | Counts | Sigma | Mean | Median | Sigma |
| A | 10 | 83 | 2785120 | 14472.04 | 913 | 889 | 192.4 |
| A | 10 | 248 | 48724 | 248.64 | 913 | 889 | 192.4 |
| A | 13 | 248 | 37169 | 188.58 | 913 | 889 | 192.4 |
| B | 0 | 183 | 102462 | 550.27 | 913 | 881 | 184.6 |
| B | 10 | 3 | 49855 | 265.3 | 913 | 881 | 184.6 |
| B | 5 | 255 | 47823 | 254.29 | 913 | 881 | 184.6 |
| C | 14 | 254 | 98044 | 453.77 | 904 | 910 | 214.1 |
| C | 15 | 208 | 36048 | 164.15 | 904 | 910 | 214.1 |
| C | 1 | 3 | 28498 | 128.88 | 904 | 910 | 214.1 |
| D | 11 | 241 | 1512757 | 6802.48 | 876 | 850 | 222.3 |
| D | 1 | 52 | 897450 | 4034.05 | 876 | 850 | 222.3 |
| D | 5 | 235 | 398281 | 1788.15 | 876 | 850 | 222.3 |
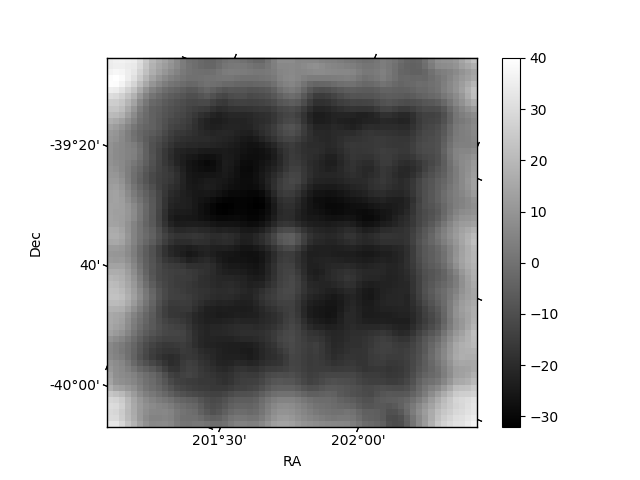
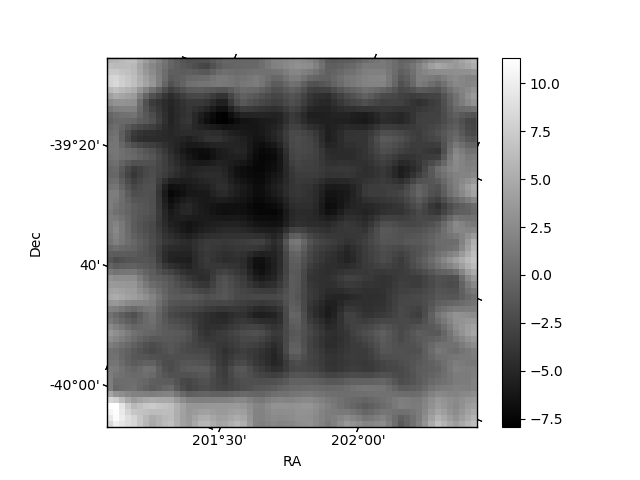
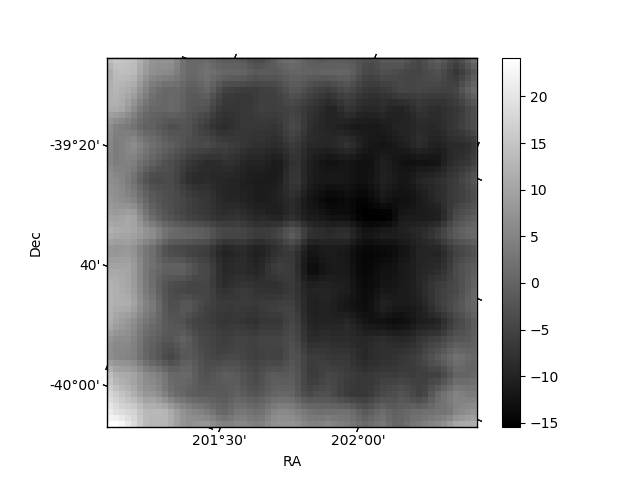
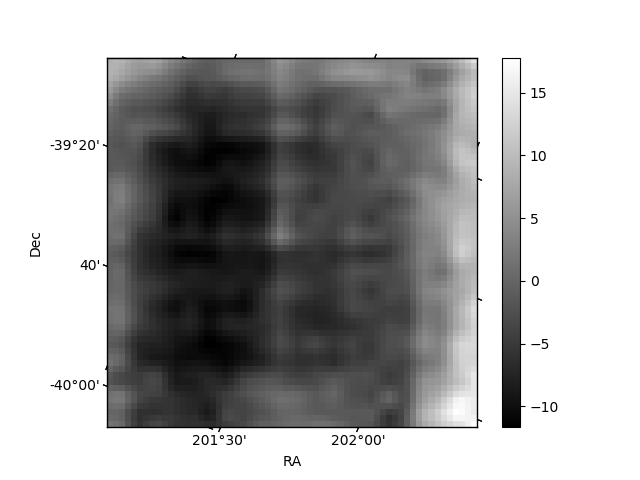
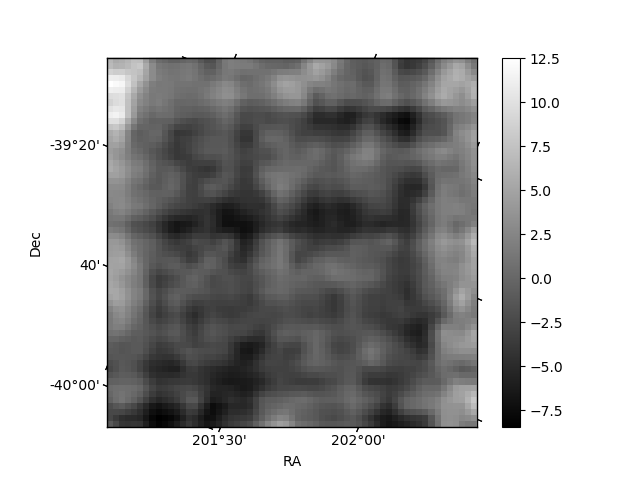
Histogram calculated using DETX and DETY for each event in the final _common_clean file
| Quadrant A | 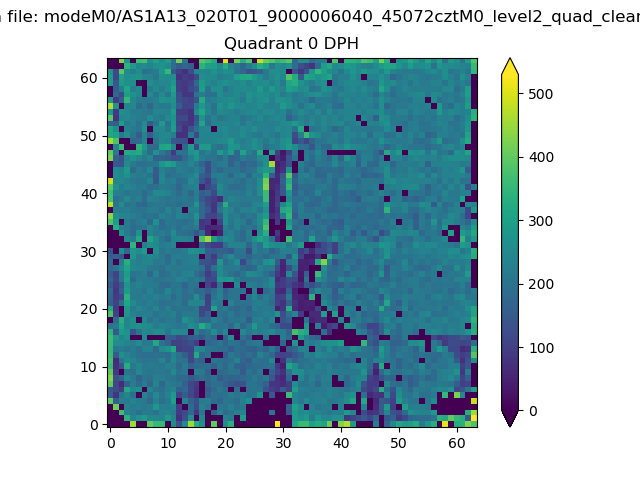 |
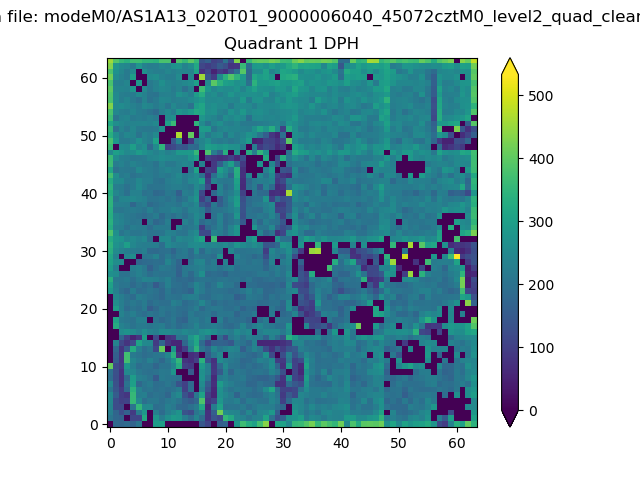 |
Quadrant B |
|---|---|---|---|
| Quadrant D | 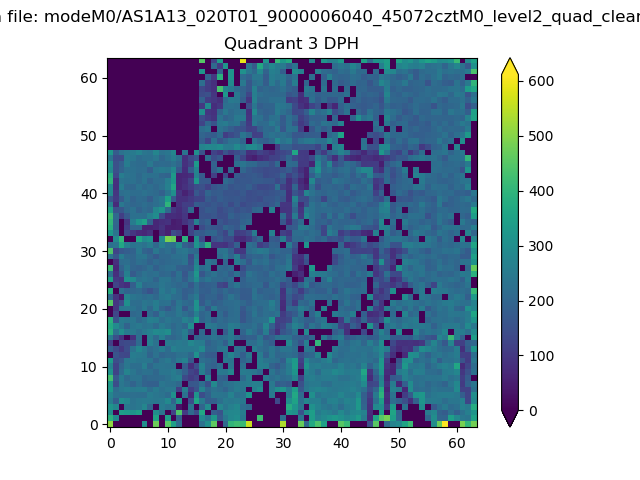 |
 |
Quadrant C |
| Plot type | Count rate plots | Images |
|---|---|---|
| Comparison with Poisson distribution Blue bars denote a histogram of data divided into 1 sec bins. Red curve is a Poisson curve with rate = median count rate of data. |
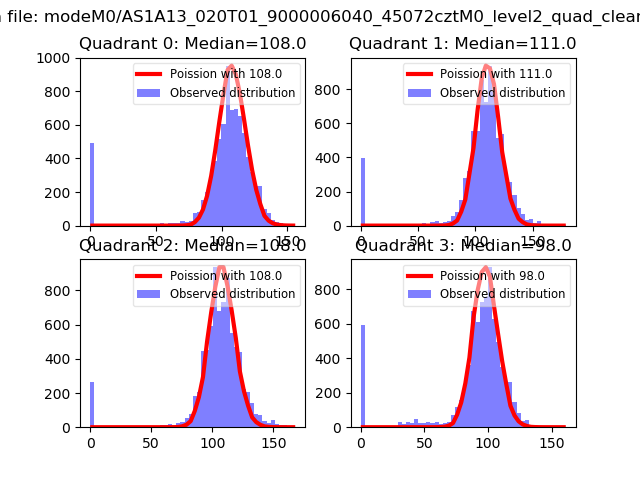 |
 |
| Quadrant-wise count rates Data is divided into 100 sec bins |
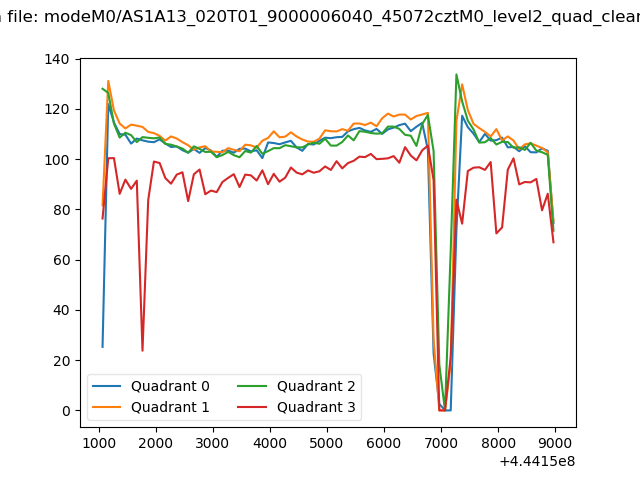 |
|
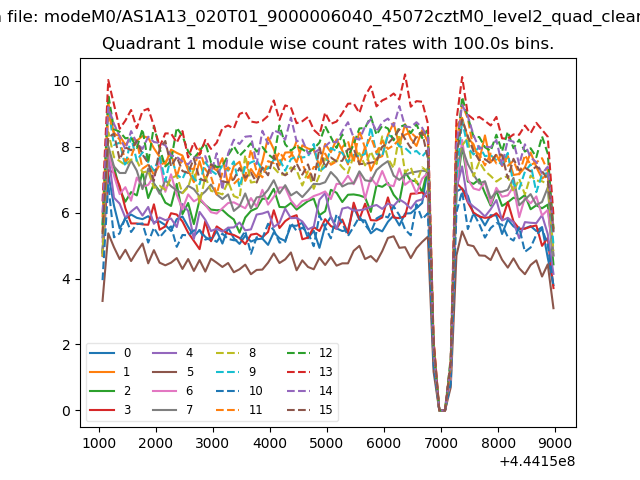
| Module-wise count rates for Quadrant A Data is divided into 100 sec bins |
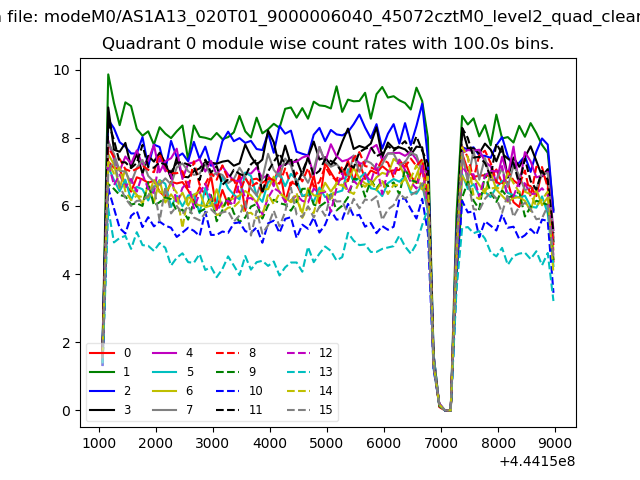 |
 |
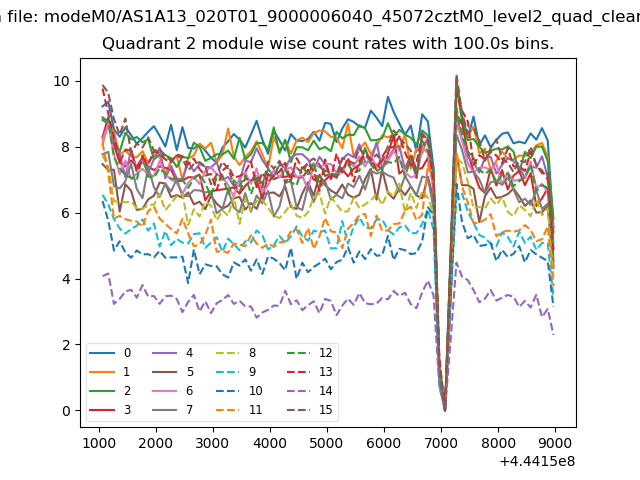
| Module-wise count rates for Quadrant B Data is divided into 100 sec bins |
 |
 |
| Module-wise count rates for Quadrant C Data is divided into 100 sec bins |
 |
 |
| Module-wise count rates for Quadrant D Data is divided into 100 sec bins |
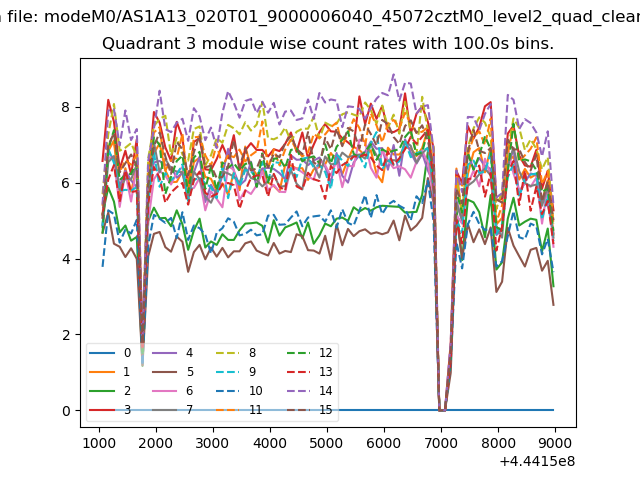 |
 |
| Parameter | Plot |
|---|---|
| CZT HV Monitor | 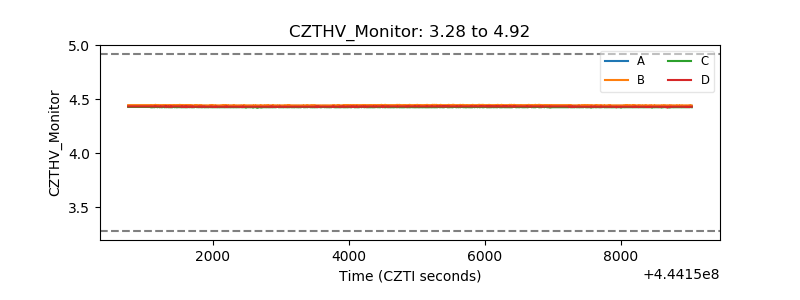 |
| D_VDD | 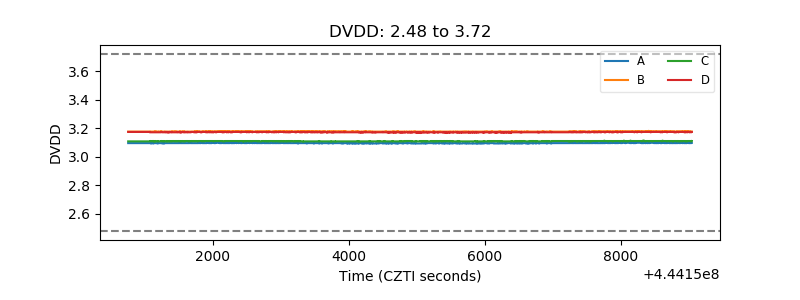 |
| Temperature 1 | 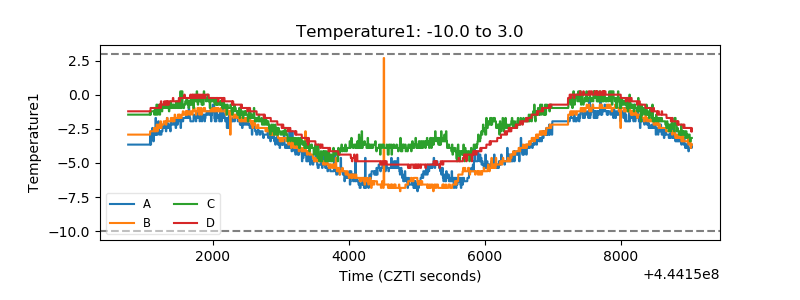 |
| Veto HV Monitor | 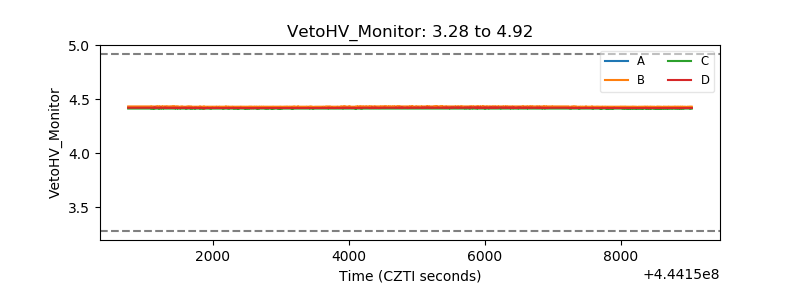 |
| Veto LLD | 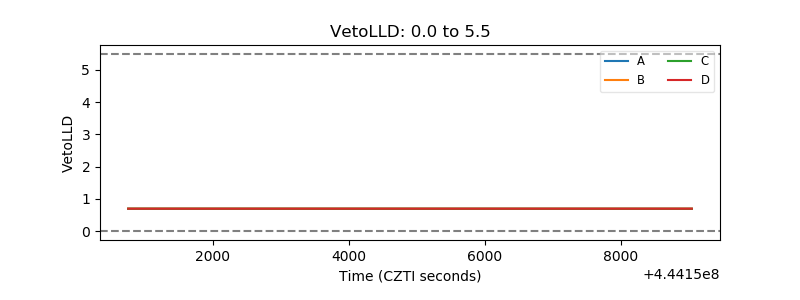 |
| Alpha Counter | 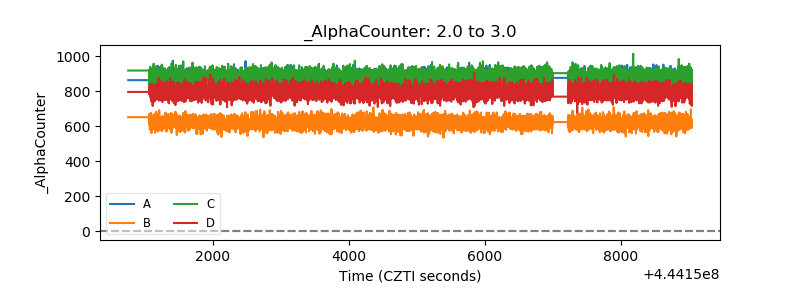 |
| _CPM_Rate | 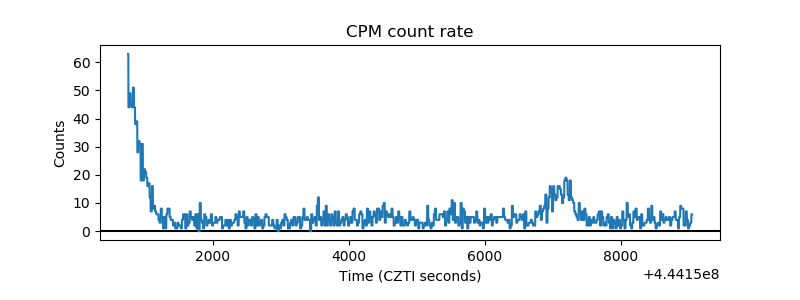 |
| CZT Counter | 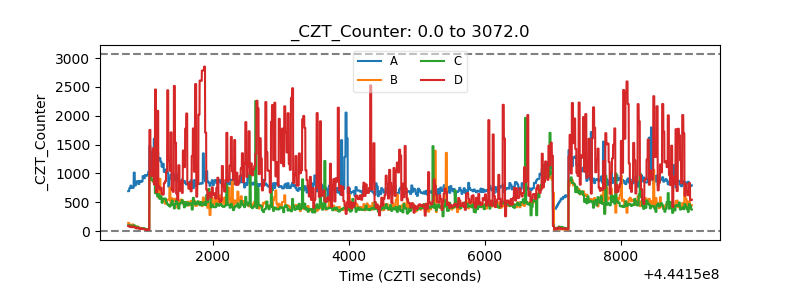 |
| +2.5 Volts monitor | 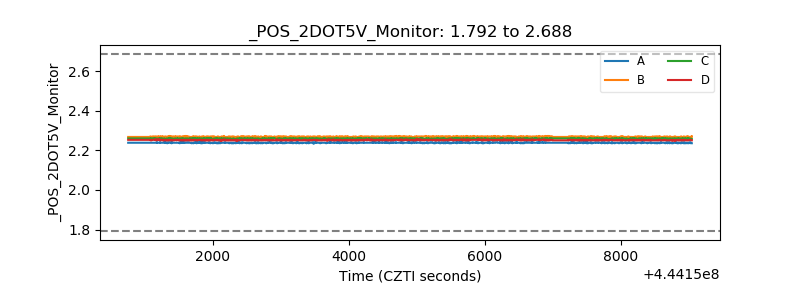 |
| +5 Volts monitor | 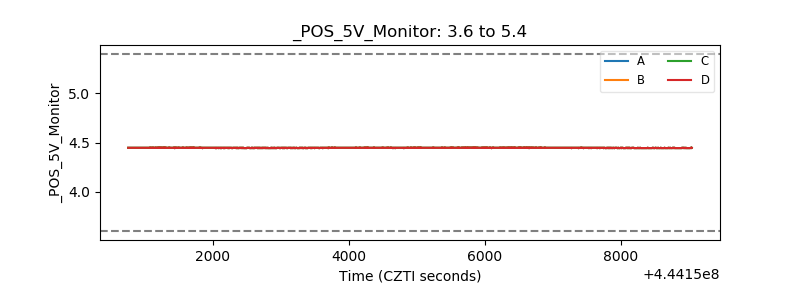 |
| _ROLL_ROT | 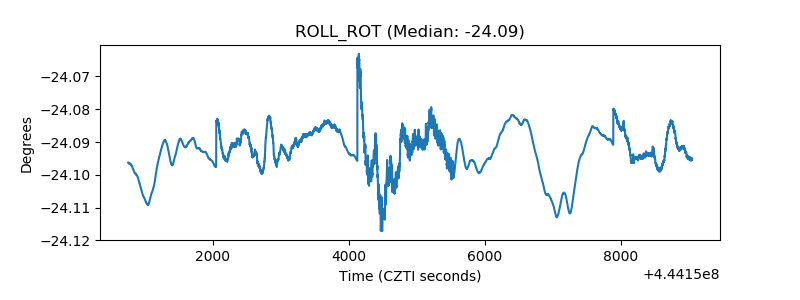 |
| _Roll_DEC | 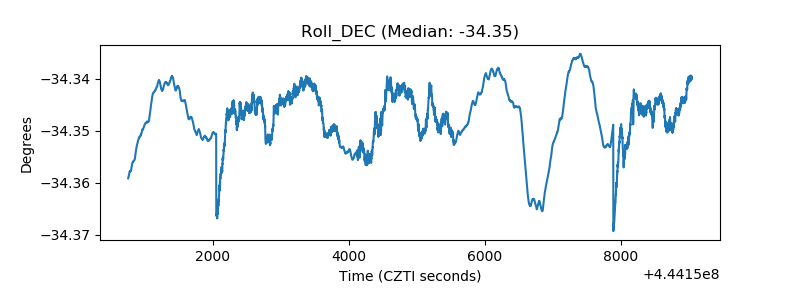 |
| _Roll_RA | 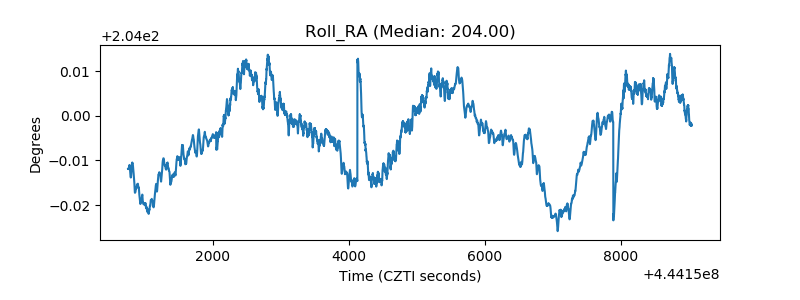 |
| Veto Counter | 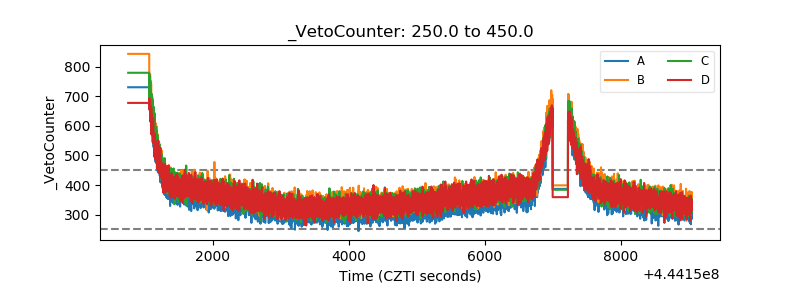 |