| Param | Original file | Final file |
|---|---|---|
| Filename | modeM0/AS1A13_020T01_9000006040_45073cztM0_level2.fits | modeM0/AS1A13_020T01_9000006040_45073cztM0_level2_quad_clean.evt |
| Size (bytes) | 581,483,520 | 120,672,000 |
| Size | 554.5 MB | 115.1 MB |
| Events in quadrant A | 6,277,435 | 801,730 |
| Events in quadrant B | 3,809,165 | 829,252 |
| Events in quadrant C | 3,474,105 | 805,526 |
| Events in quadrant D | 7,377,549 | 690,718 |
| Mode SS | |||
|---|---|---|---|
| Quadrant | BADHDUFLAG | Total packets | Discarded packets |
| A | 0 | 150 | 0 |
| B | 0 | 150 | 0 |
| C | 0 | 150 | 0 |
| D | 0 | 150 | 0 |
| Mode M0 | |||
|---|---|---|---|
| Quadrant | BADHDUFLAG | Total packets | Discarded packets |
| A | 0 | 24056 | 0 |
| B | 0 | 16433 | 0 |
| C | 0 | 15917 | 0 |
| D | 0 | 27219 | 0 |
| Quadrant | Total seconds | Saturated seconds | Saturation percentage |
|---|---|---|---|
| A | 7568 | 200 | 2.642706% |
| B | 7569 | 122 | 1.611838% |
| C | 7569 | 24 | 0.317083% |
| D | 7569 | 708 | 9.353944% |
Noise dominated data is calculated using 1-second bins in cleaned event files. If a bin has >2000 counts, and if more than 50% of those come from <1% of pixels, then it is considered to be noise-dominated and hence unusable.
| Quadrant | # 1 sec bins | Bins with >0 counts | Bins with >2000 counts | High rate bins dominated by noise | Noise dominated (total time) | Noise dominated (detector-on time) | Marked lightcurve |
|---|---|---|---|---|---|---|---|
| A | 7568 | 7568 | 54 | 54 | 0.71% | 0.71% | 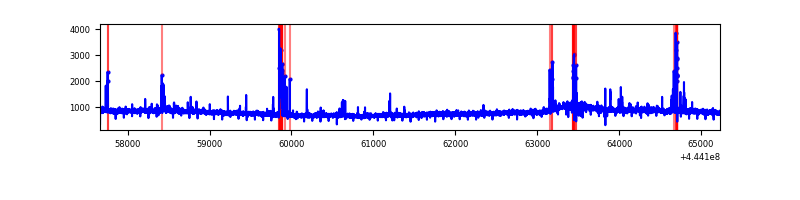 |
| B | 7569 | 7569 | 10 | 10 | 0.13% | 0.13% | 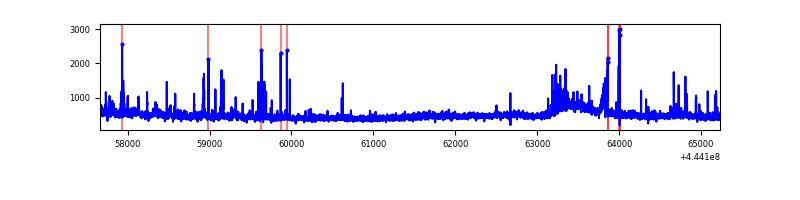 |
| C | 7569 | 7569 | 7 | 7 | 0.09% | 0.09% | 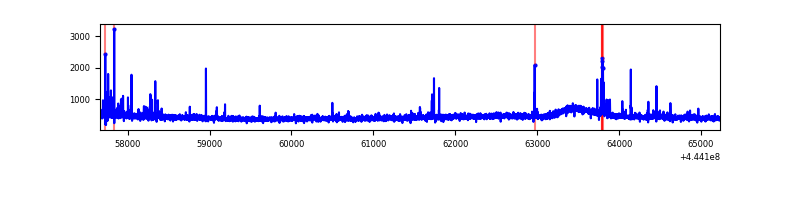 |
| D | 7569 | 7569 | 529 | 529 | 6.99% | 6.99% | 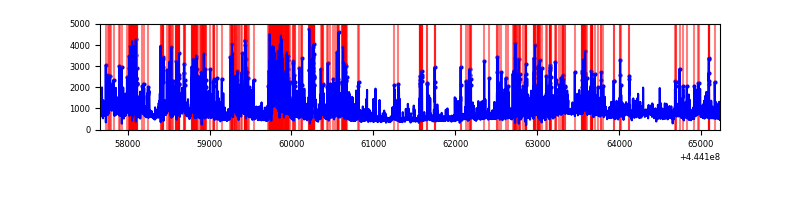 |
Top three noisy pixels from each quadrant. If the there are fewer than three noisy pixels in the level2.evt file, extra rows are filled as -1
| Pixel properties | Quadrant properties | ||||||
|---|---|---|---|---|---|---|---|
| Quadrant | DetID | PixID | Counts | Sigma | Mean | Median | Sigma |
| A | 10 | 83 | 2663557 | 14740.92 | 863 | 842 | 180.6 |
| A | 13 | 248 | 110688 | 608.11 | 863 | 842 | 180.6 |
| A | 15 | 174 | 73150 | 400.3 | 863 | 842 | 180.6 |
| B | 0 | 183 | 122236 | 709.78 | 864 | 835 | 171.0 |
| B | 5 | 255 | 48051 | 276.05 | 864 | 835 | 171.0 |
| B | 15 | 36 | 41940 | 240.32 | 864 | 835 | 171.0 |
| C | 0 | 207 | 75117 | 371.28 | 848 | 854 | 200.0 |
| C | 14 | 254 | 33125 | 161.34 | 848 | 854 | 200.0 |
| C | 12 | 2 | 21570 | 103.57 | 848 | 854 | 200.0 |
| D | 1 | 52 | 1071056 | 5185.74 | 820 | 796 | 206.4 |
| D | 11 | 241 | 809076 | 3916.37 | 820 | 796 | 206.4 |
| D | 2 | 249 | 776007 | 3756.14 | 820 | 796 | 206.4 |
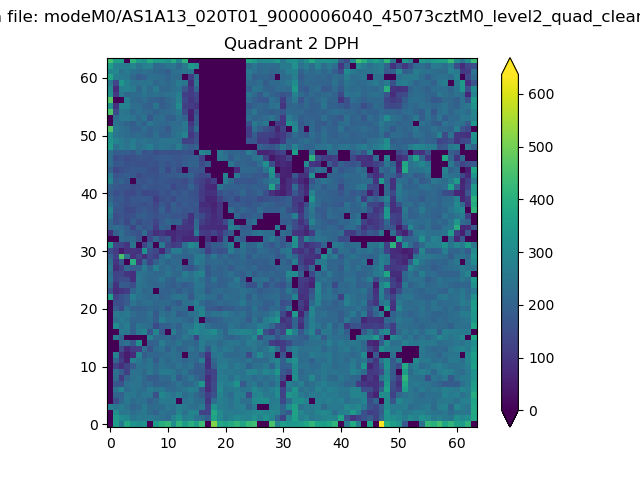
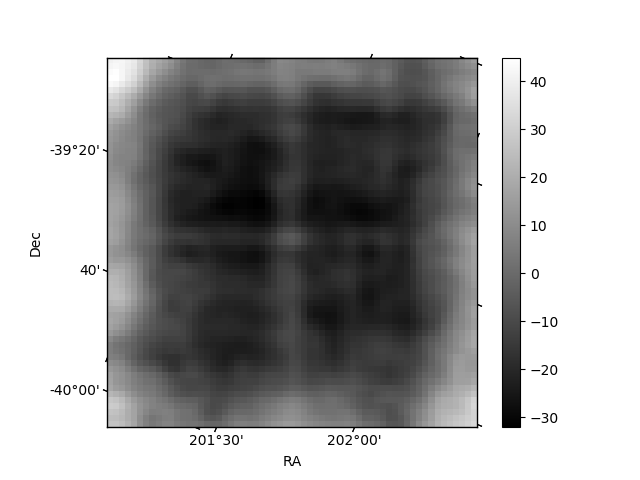
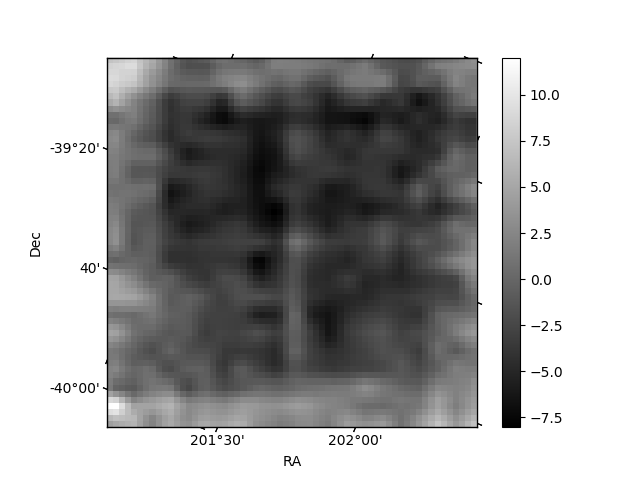
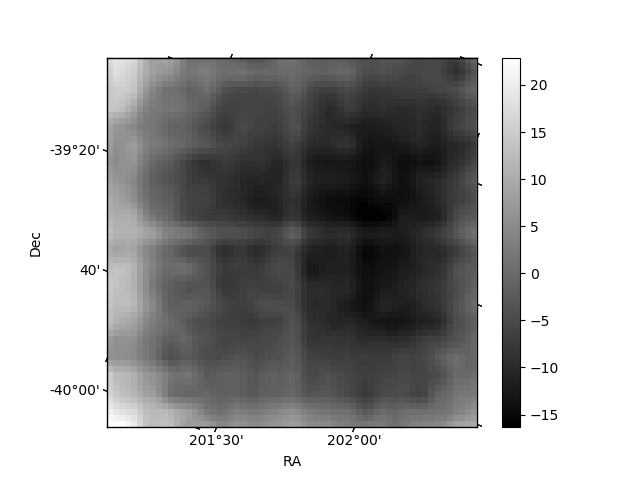
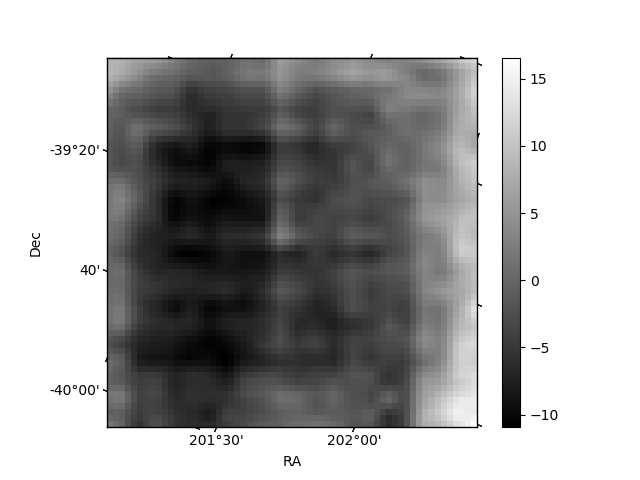
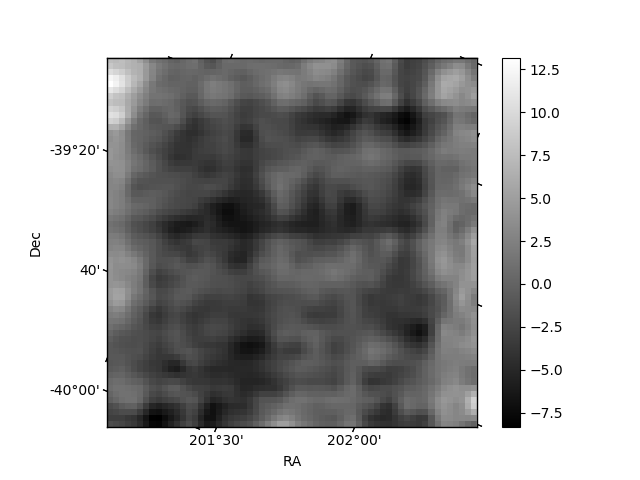
Histogram calculated using DETX and DETY for each event in the final _common_clean file
| Quadrant A | 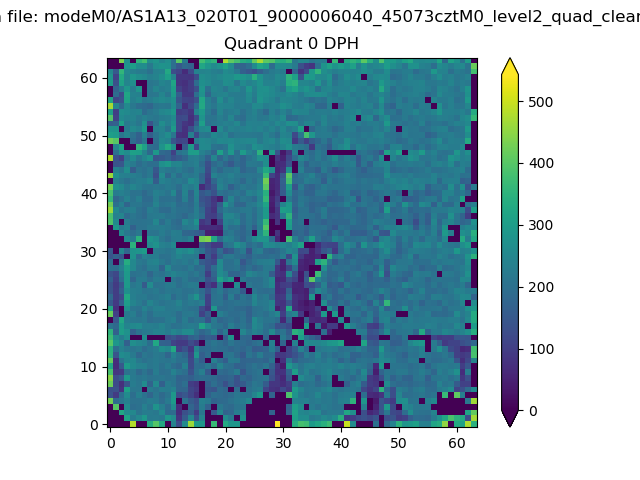 |
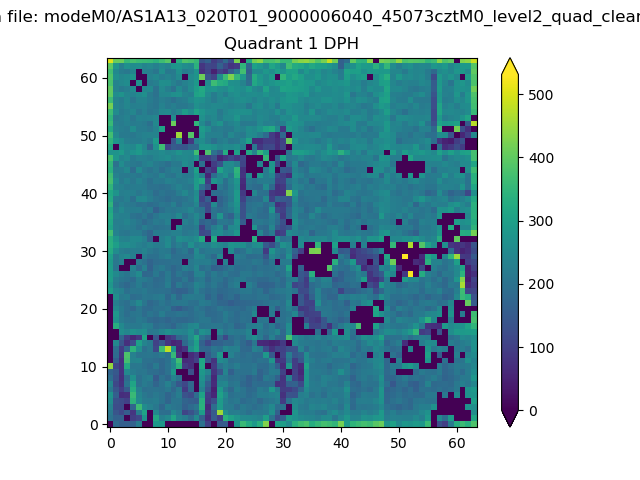 |
Quadrant B |
|---|---|---|---|
| Quadrant D | 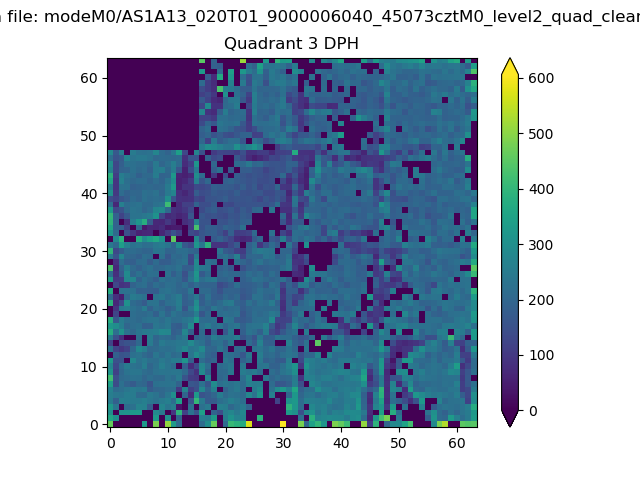 |
 |
Quadrant C |
| Plot type | Count rate plots | Images |
|---|---|---|
| Comparison with Poisson distribution Blue bars denote a histogram of data divided into 1 sec bins. Red curve is a Poisson curve with rate = median count rate of data. |
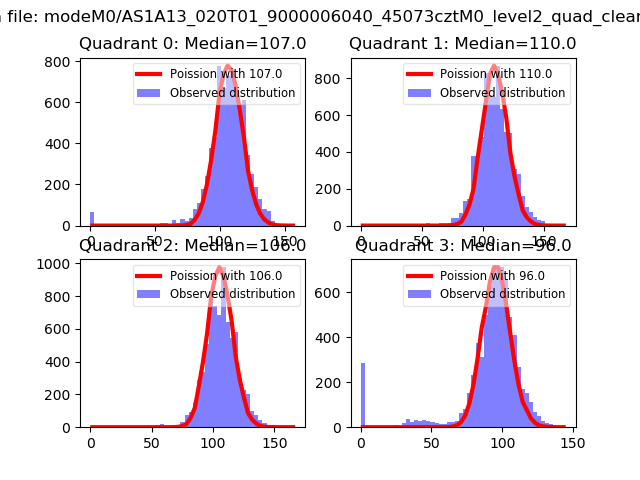 |
 |
| Quadrant-wise count rates Data is divided into 100 sec bins |
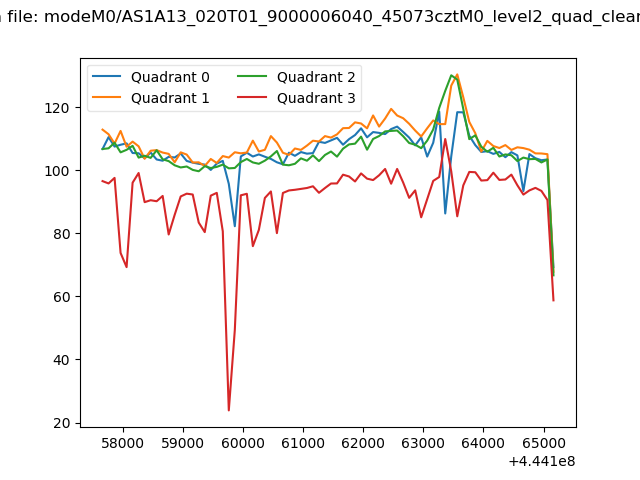 |
|
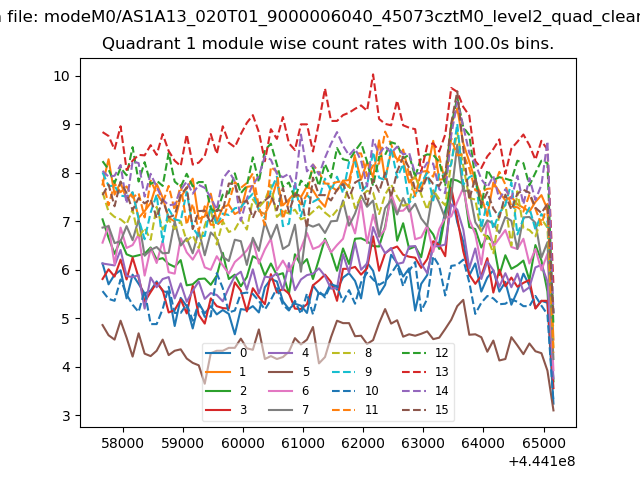
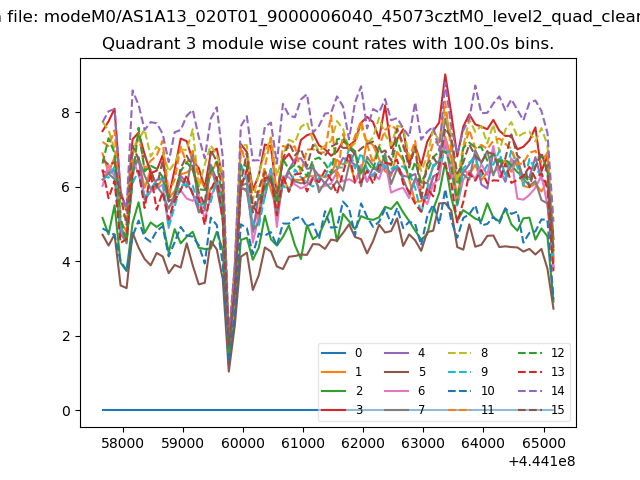
| Module-wise count rates for Quadrant A Data is divided into 100 sec bins |
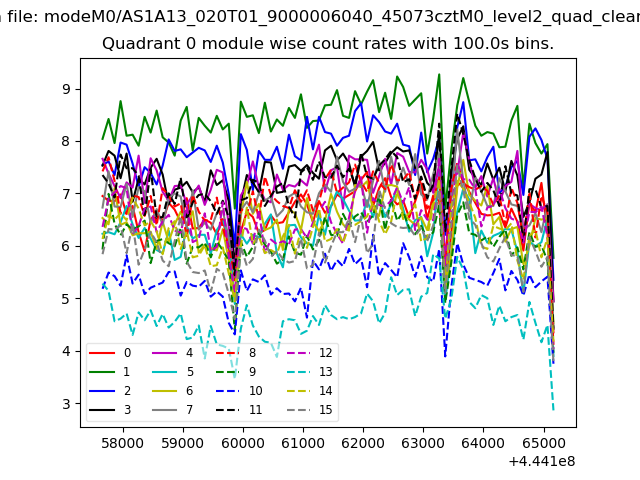 |
 |
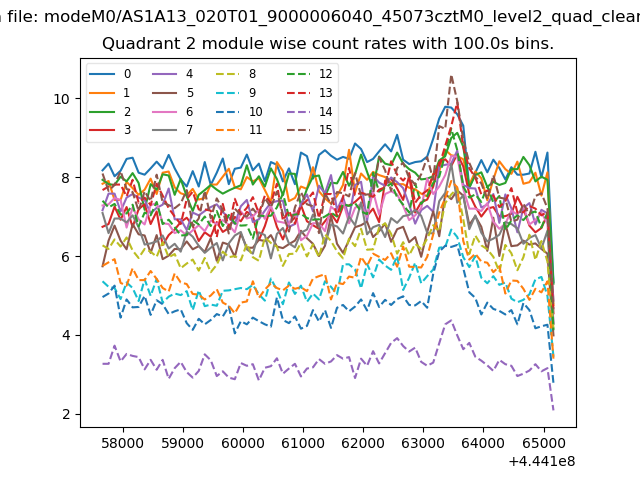
| Module-wise count rates for Quadrant B Data is divided into 100 sec bins |
 |
 |
| Module-wise count rates for Quadrant C Data is divided into 100 sec bins |
 |
 |
| Module-wise count rates for Quadrant D Data is divided into 100 sec bins |
 |
 |
| Parameter | Plot |
|---|---|
| CZT HV Monitor | 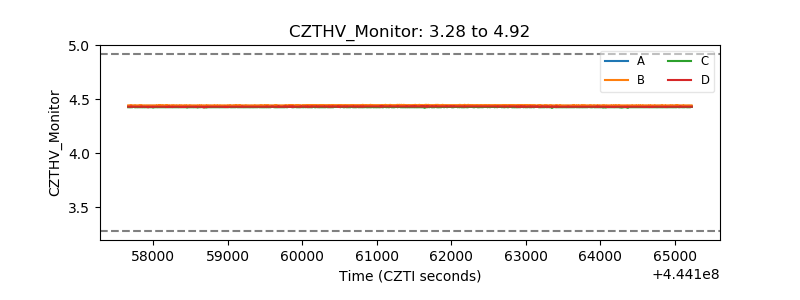 |
| D_VDD | 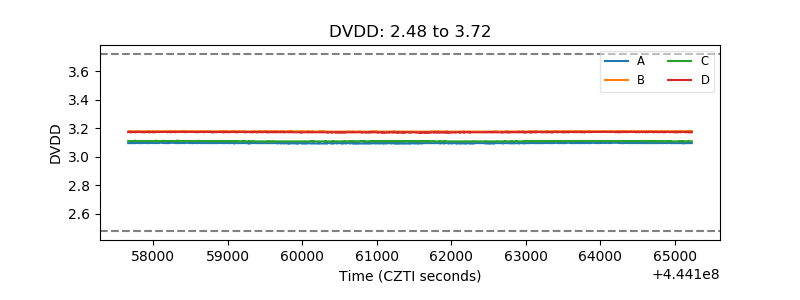 |
| Temperature 1 | 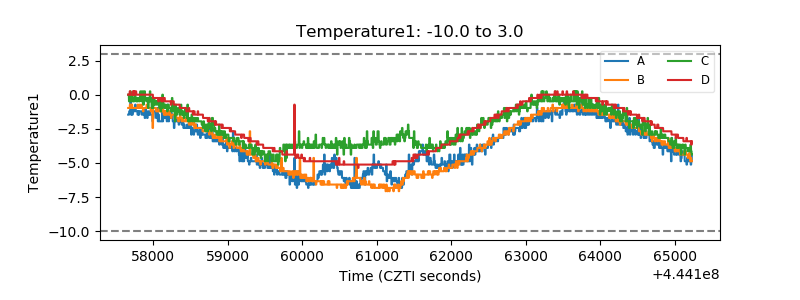 |
| Veto HV Monitor | 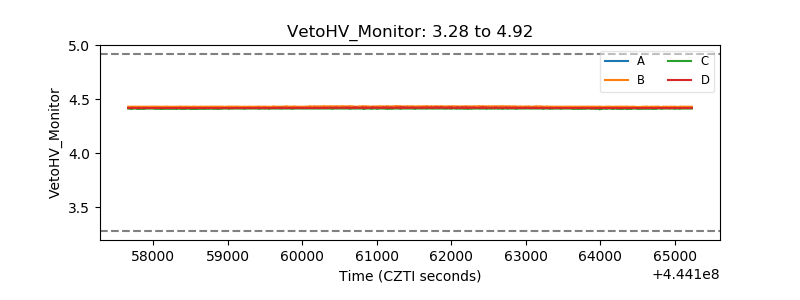 |
| Veto LLD | 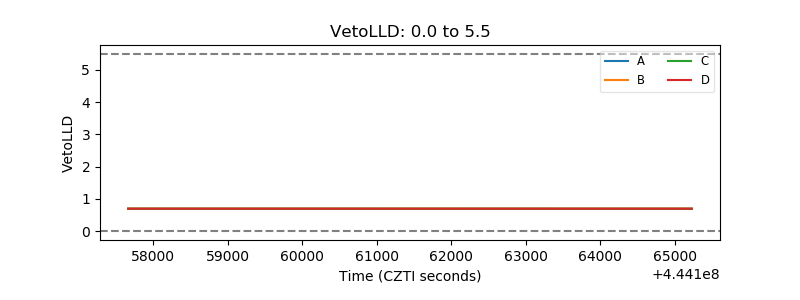 |
| Alpha Counter | 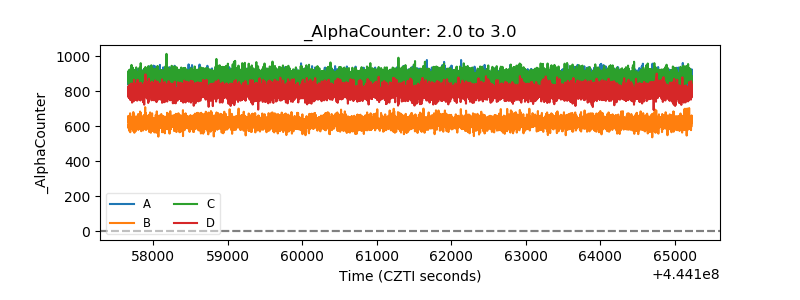 |
| _CPM_Rate | 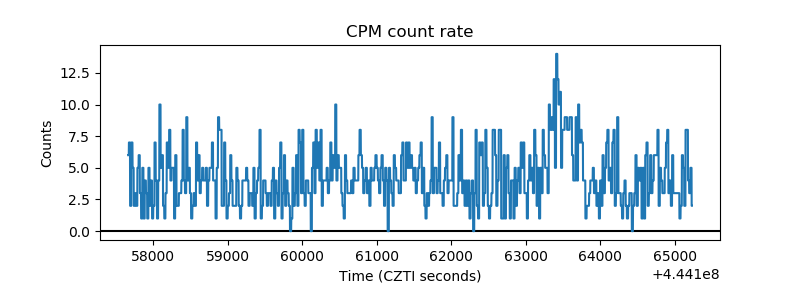 |
| CZT Counter | 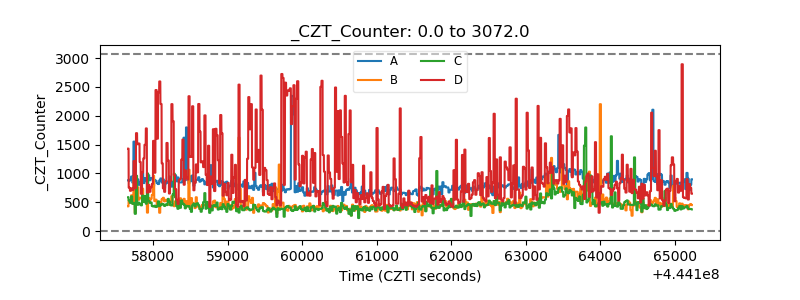 |
| +2.5 Volts monitor | 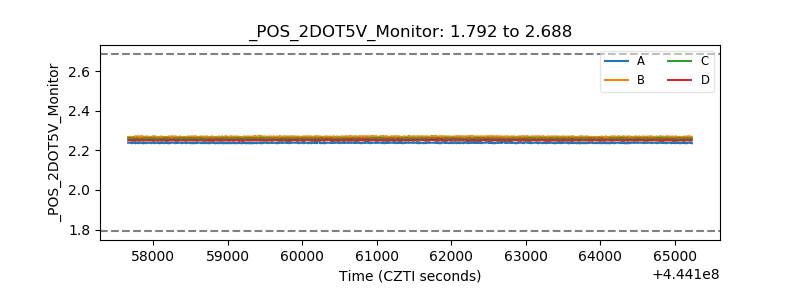 |
| +5 Volts monitor | 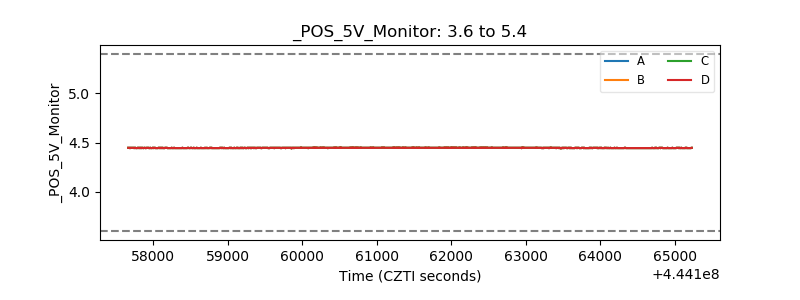 |
| _ROLL_ROT | 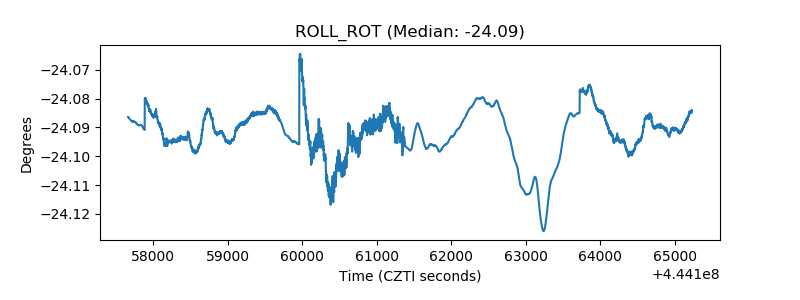 |
| _Roll_DEC | 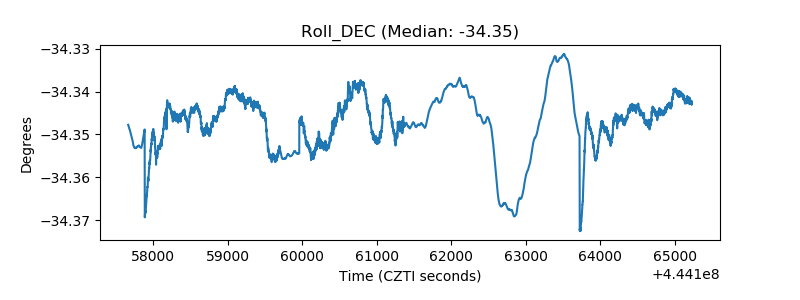 |
| _Roll_RA | 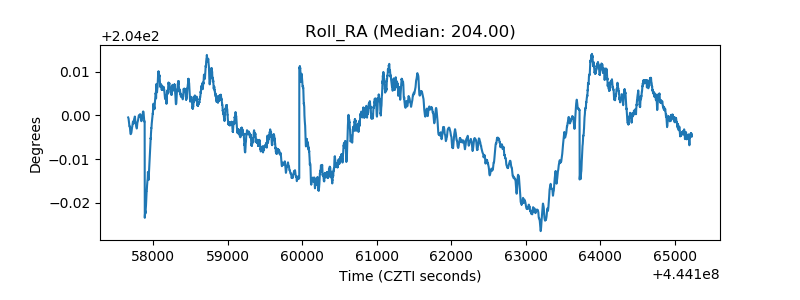 |
| Veto Counter | 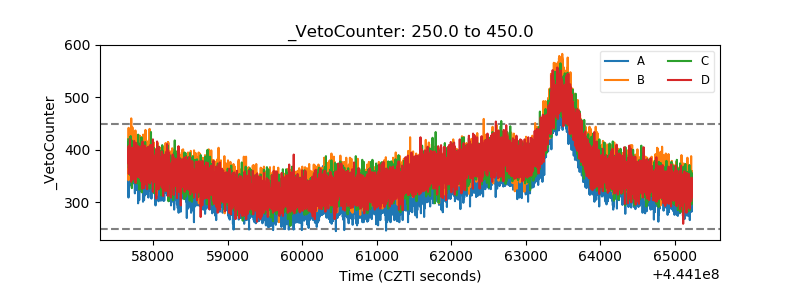 |