| Param | Original file | Final file |
|---|---|---|
| Filename | modeM0/AS1A13_020T01_9000006040_45077cztM0_level2.fits | modeM0/AS1A13_020T01_9000006040_45077cztM0_level2_quad_clean.evt |
| Size (bytes) | 1,308,444,480 | 277,387,200 |
| Size | 1.2 GB | 264.5 MB |
| Events in quadrant A | 14,098,587 | 1,846,922 |
| Events in quadrant B | 8,540,887 | 1,925,956 |
| Events in quadrant C | 9,517,391 | 1,834,875 |
| Events in quadrant D | 14,892,852 | 1,555,841 |
| Mode SS | |||
|---|---|---|---|
| Quadrant | BADHDUFLAG | Total packets | Discarded packets |
| A | 0 | 362 | 0 |
| B | 0 | 362 | 0 |
| C | 0 | 362 | 0 |
| D | 0 | 362 | 0 |
| Mode M9 | |||
|---|---|---|---|
| Quadrant | BADHDUFLAG | Total packets | Discarded packets |
| A | 0 | 18 | 0 |
| B | 0 | 18 | 0 |
| C | 0 | 18 | 0 |
| D | 0 | 18 | 0 |
| Mode M0 | |||
|---|---|---|---|
| Quadrant | BADHDUFLAG | Total packets | Discarded packets |
| A | 0 | 55944 | 3 |
| B | 0 | 37860 | 3 |
| C | 0 | 41053 | 3 |
| D | 0 | 56788 | 3 |
| Quadrant | Total seconds | Saturated seconds | Saturation percentage |
|---|---|---|---|
| A | 17914 | 409 | 2.283131% |
| B | 17915 | 220 | 1.228021% |
| C | 17915 | 466 | 2.601172% |
| D | 17915 | 1630 | 9.098521% |
Noise dominated data is calculated using 1-second bins in cleaned event files. If a bin has >2000 counts, and if more than 50% of those come from <1% of pixels, then it is considered to be noise-dominated and hence unusable.
| Quadrant | # 1 sec bins | Bins with >0 counts | Bins with >2000 counts | High rate bins dominated by noise | Noise dominated (total time) | Noise dominated (detector-on time) | Marked lightcurve |
|---|---|---|---|---|---|---|---|
| A | 19629 | 17917 | 20 | 20 | 0.10% | 0.11% | 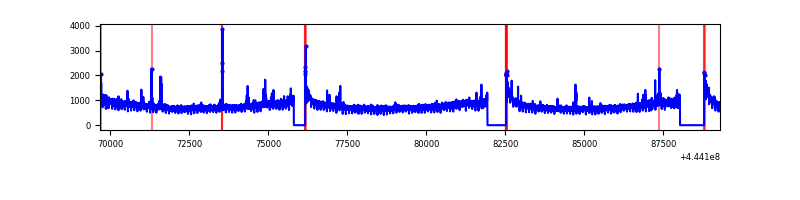 |
| B | 19630 | 17918 | 16 | 16 | 0.08% | 0.09% | 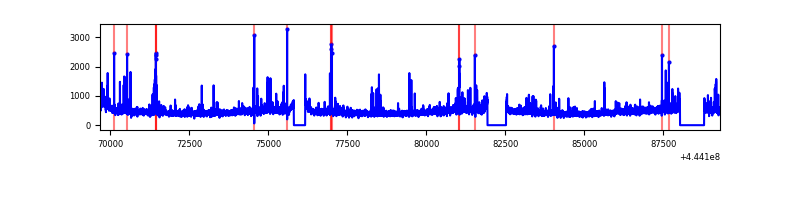 |
| C | 19630 | 17917 | 334 | 334 | 1.70% | 1.86% | 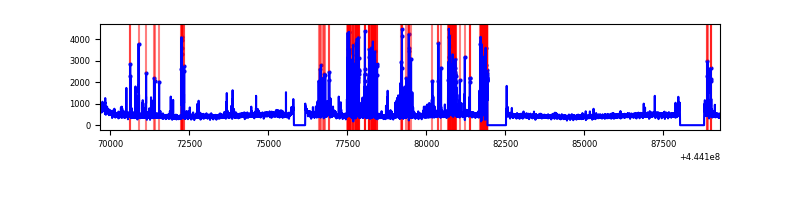 |
| D | 19630 | 17917 | 1224 | 1224 | 6.24% | 6.83% | 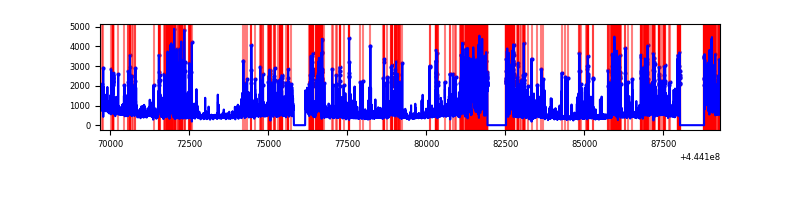 |
Top three noisy pixels from each quadrant. If the there are fewer than three noisy pixels in the level2.evt file, extra rows are filled as -1
| Pixel properties | Quadrant properties | ||||||
|---|---|---|---|---|---|---|---|
| Quadrant | DetID | PixID | Counts | Sigma | Mean | Median | Sigma |
| A | 10 | 83 | 6121158 | 14688.24 | 2010 | 1967 | 416.6 |
| A | 13 | 248 | 76150 | 178.07 | 2010 | 1967 | 416.6 |
| A | 10 | 248 | 60884 | 141.42 | 2010 | 1967 | 416.6 |
| B | 0 | 183 | 279743 | 692.2 | 2018 | 1952 | 401.3 |
| B | 5 | 255 | 107884 | 263.96 | 2018 | 1952 | 401.3 |
| B | 0 | 186 | 65506 | 158.36 | 2018 | 1952 | 401.3 |
| C | 14 | 254 | 1624185 | 3505.48 | 1966 | 1976 | 462.8 |
| C | 3 | 233 | 70060 | 147.12 | 1966 | 1976 | 462.8 |
| C | 12 | 2 | 53187 | 110.66 | 1966 | 1976 | 462.8 |
| D | 5 | 235 | 2595749 | 5444.92 | 1906 | 1853 | 476.4 |
| D | 2 | 249 | 1130572 | 2369.33 | 1906 | 1853 | 476.4 |
| D | 9 | 49 | 675582 | 1414.24 | 1906 | 1853 | 476.4 |
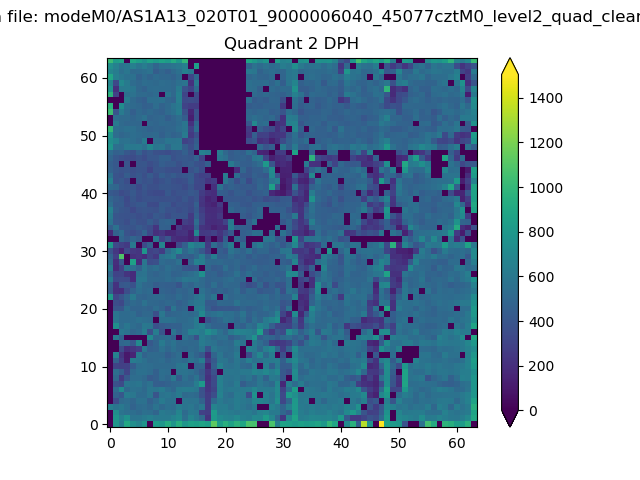
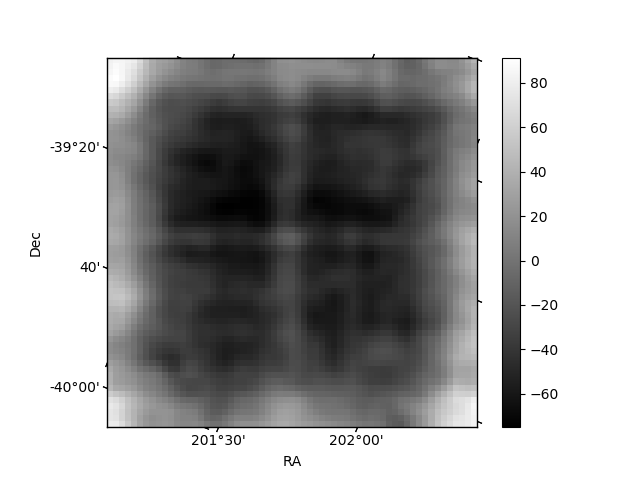
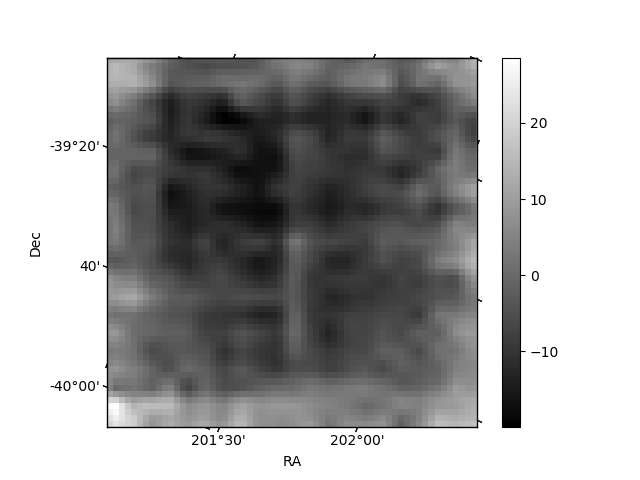
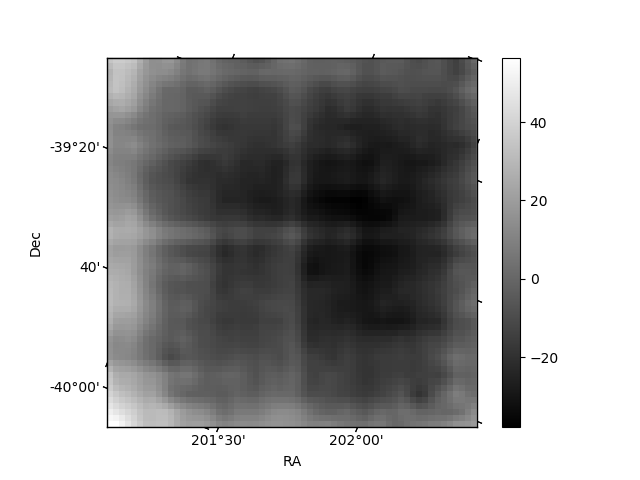
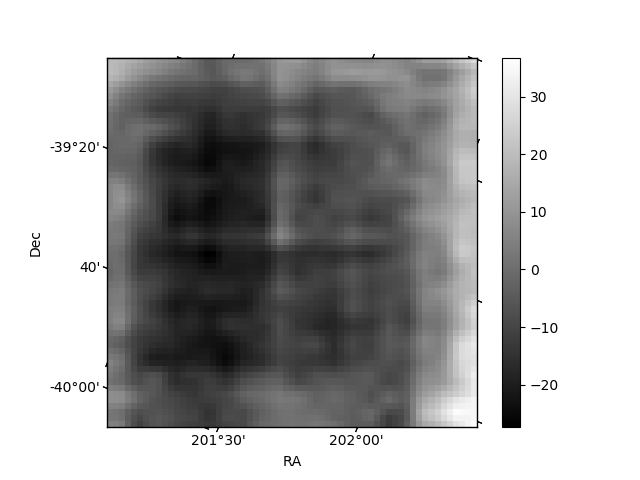
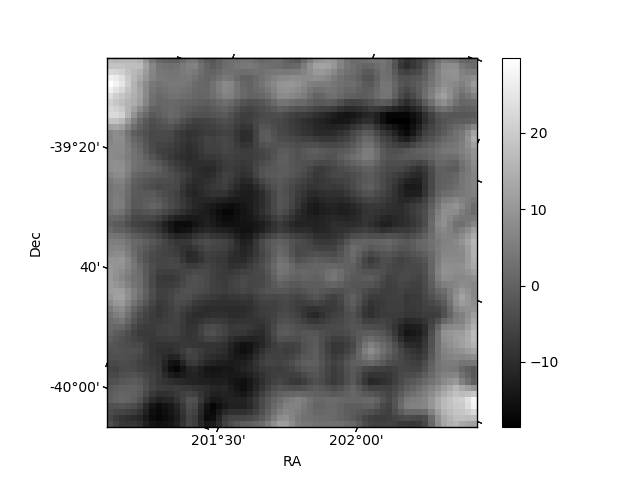
Histogram calculated using DETX and DETY for each event in the final _common_clean file
| Quadrant A | 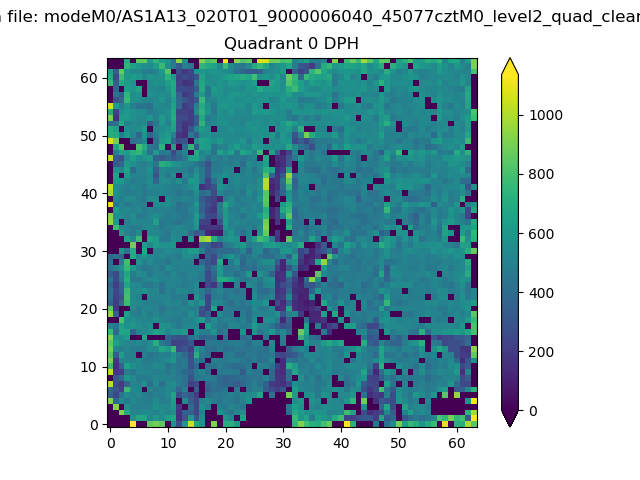 |
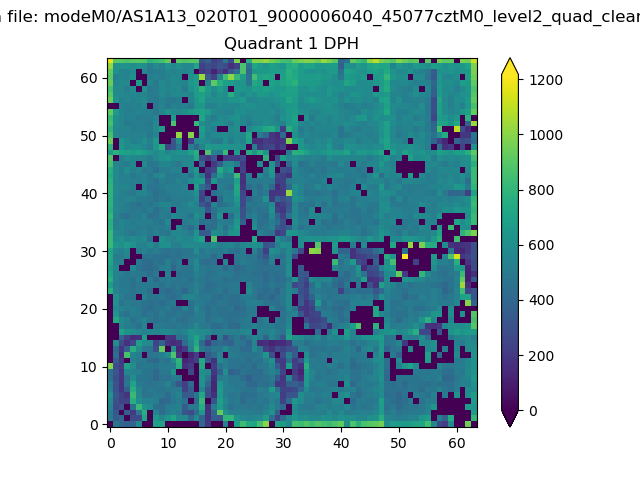 |
Quadrant B |
|---|---|---|---|
| Quadrant D | 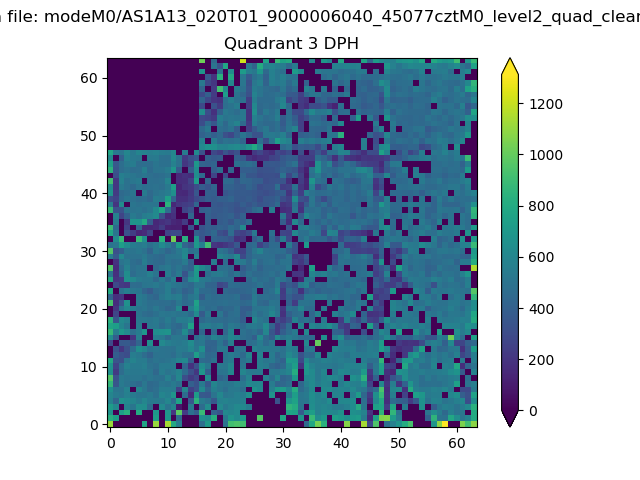 |
 |
Quadrant C |
| Plot type | Count rate plots | Images |
|---|---|---|
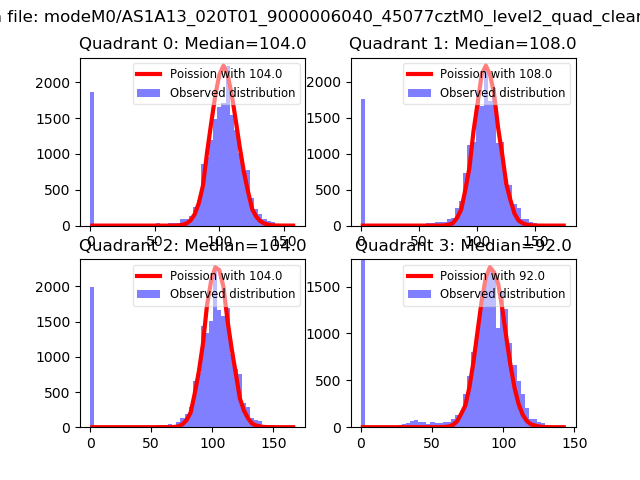
| Comparison with Poisson distribution Blue bars denote a histogram of data divided into 1 sec bins. Red curve is a Poisson curve with rate = median count rate of data. |
 |
 |
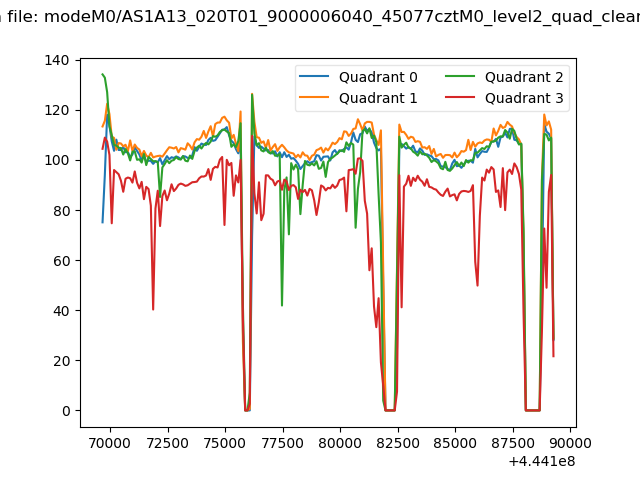
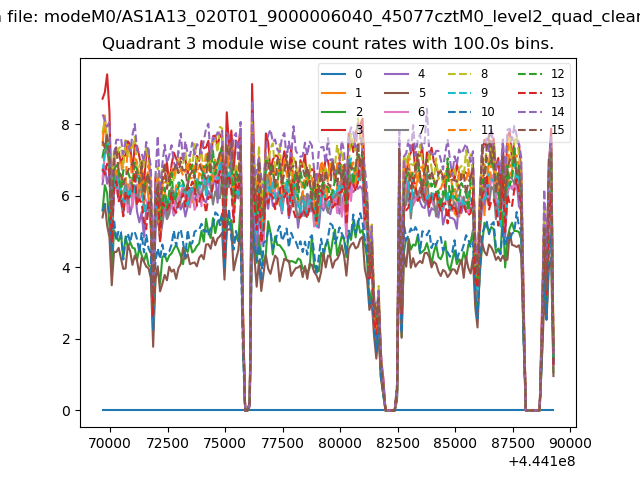
| Quadrant-wise count rates Data is divided into 100 sec bins |
 |
|
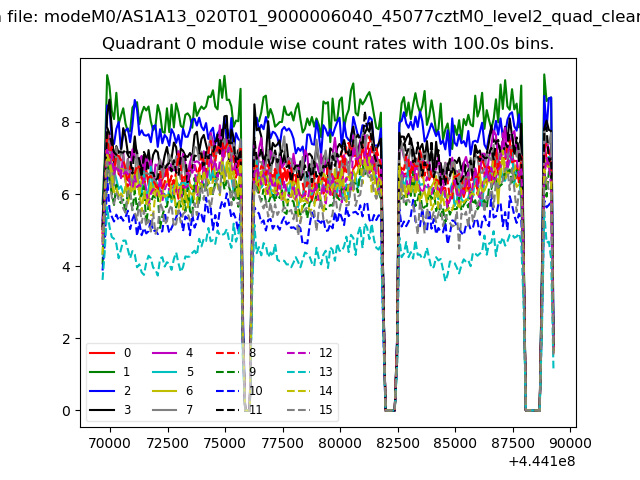
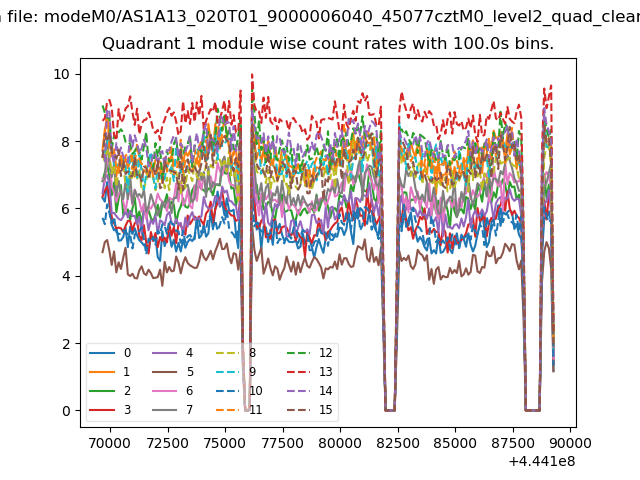
| Module-wise count rates for Quadrant A Data is divided into 100 sec bins |
 |
 |
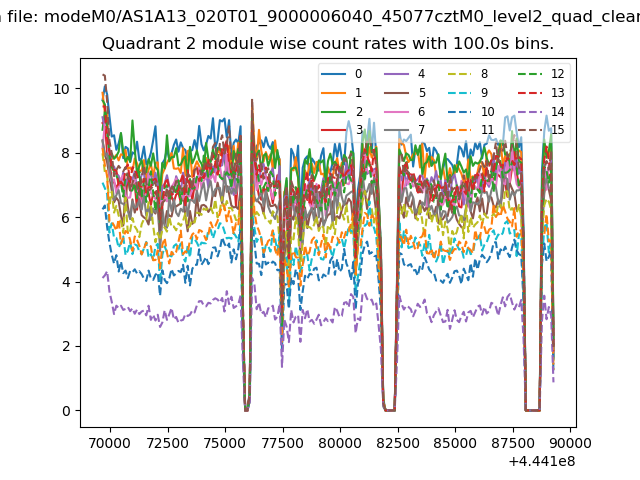
| Module-wise count rates for Quadrant B Data is divided into 100 sec bins |
 |
 |
| Module-wise count rates for Quadrant C Data is divided into 100 sec bins |
 |
 |
| Module-wise count rates for Quadrant D Data is divided into 100 sec bins |
 |
 |
| Parameter | Plot |
|---|---|
| CZT HV Monitor | 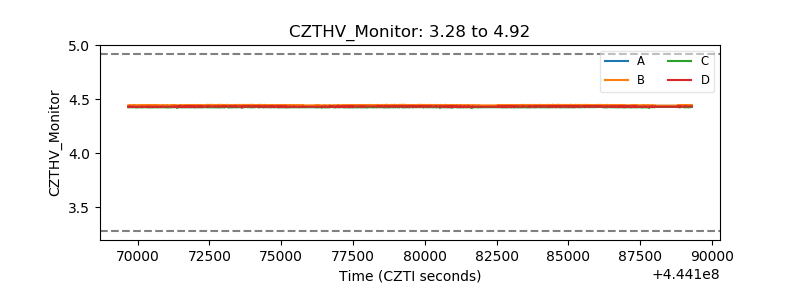 |
| D_VDD | 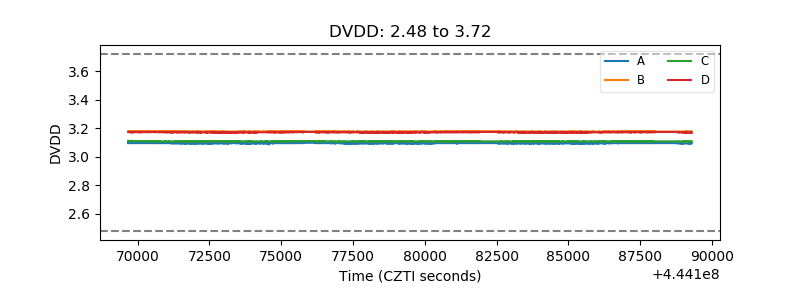 |
| Temperature 1 | 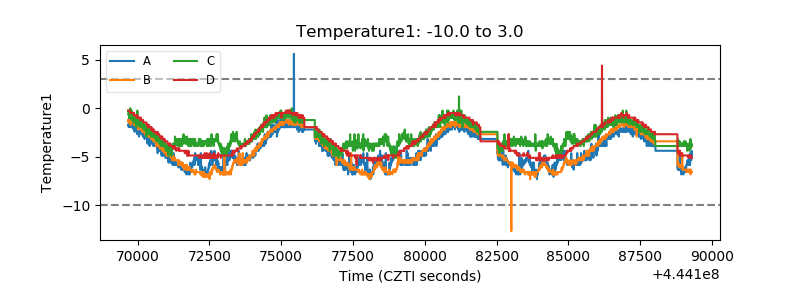 |
| Veto HV Monitor | 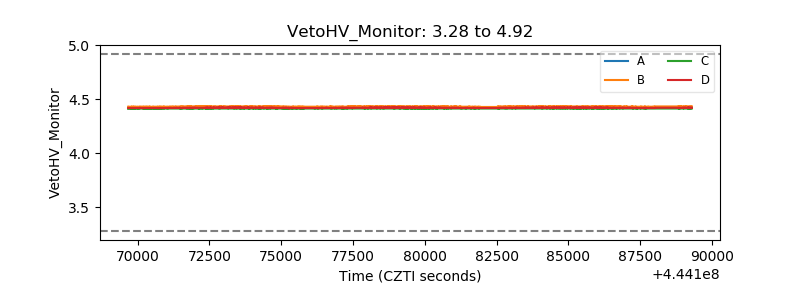 |
| Veto LLD | 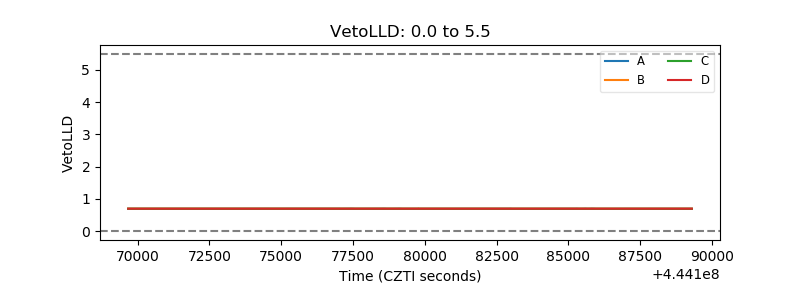 |
| Alpha Counter | 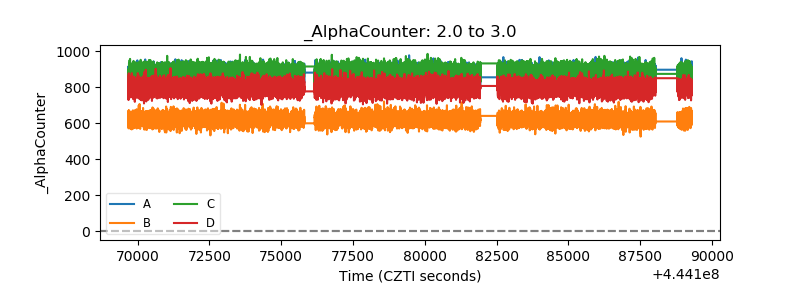 |
| _CPM_Rate | 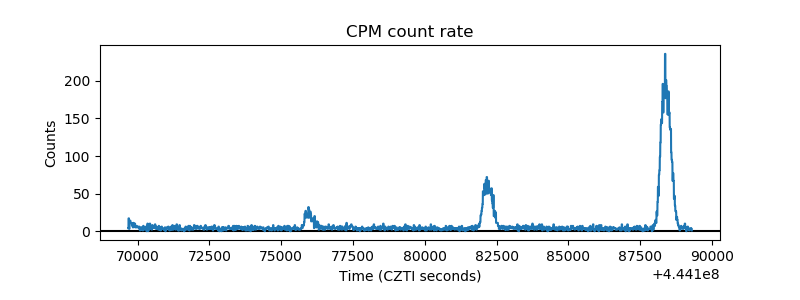 |
| CZT Counter | 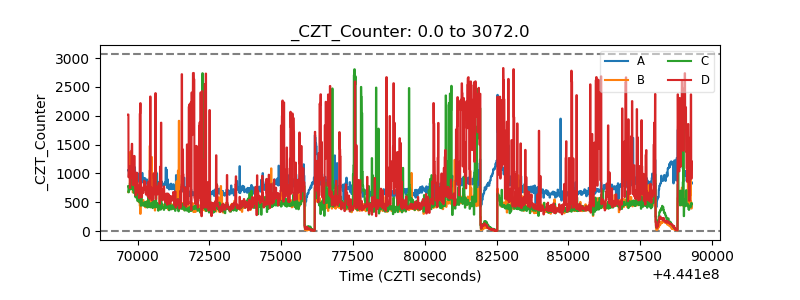 |
| +2.5 Volts monitor | 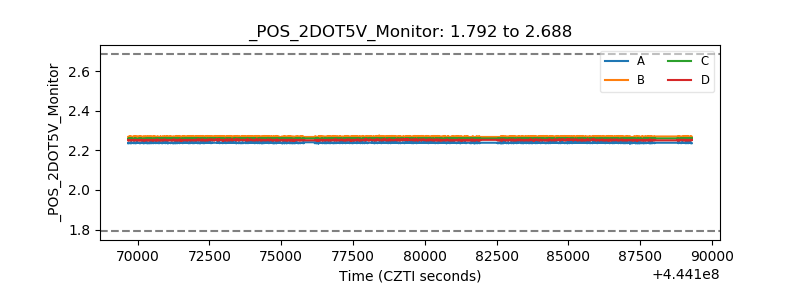 |
| +5 Volts monitor | 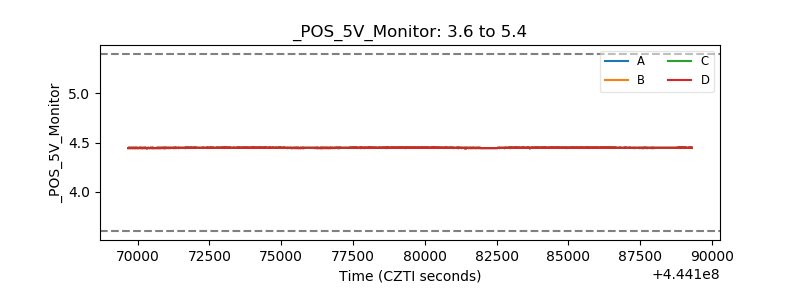 |
| _ROLL_ROT | 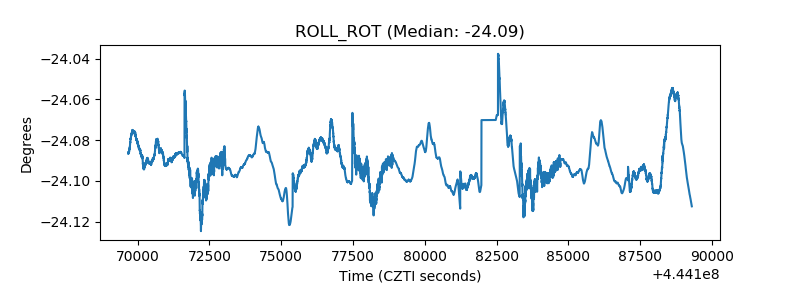 |
| _Roll_DEC | 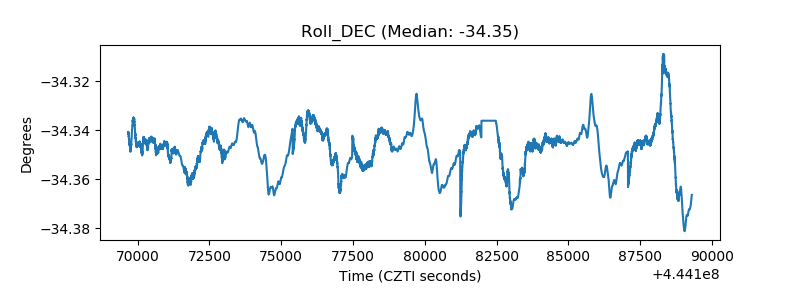 |
| _Roll_RA | 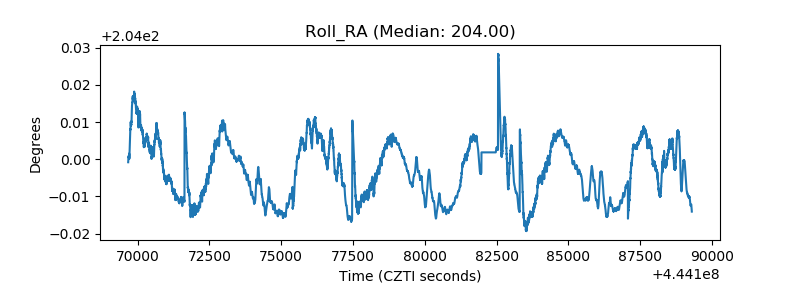 |
| Veto Counter | 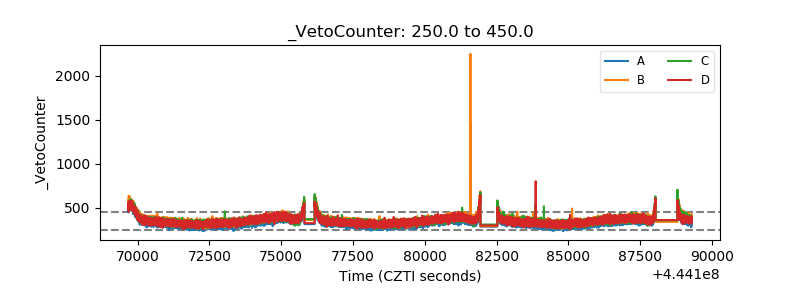 |