| Param | Original file | Final file |
|---|---|---|
| Filename | modeM0/AS1A13_020T01_9000006040_45078cztM0_level2.fits | modeM0/AS1A13_020T01_9000006040_45078cztM0_level2_quad_clean.evt |
| Size (bytes) | 21,516,480 | 3,674,880 |
| Size | 20.5 MB | 3.5 MB |
| Events in quadrant A | 208,236 | 22,687 |
| Events in quadrant B | 134,342 | 23,969 |
| Events in quadrant C | 109,502 | 22,454 |
| Events in quadrant D | 322,332 | 17,837 |
| Mode SS | |||
|---|---|---|---|
| Quadrant | BADHDUFLAG | Total packets | Discarded packets |
| A | 0 | 4 | 0 |
| B | 0 | 4 | 0 |
| C | 0 | 4 | 0 |
| D | 0 | 4 | 0 |
| Mode M0 | |||
|---|---|---|---|
| Quadrant | BADHDUFLAG | Total packets | Discarded packets |
| A | 0 | 766 | 0 |
| B | 0 | 543 | 0 |
| C | 0 | 482 | 0 |
| D | 0 | 1125 | 0 |
| Quadrant | Total seconds | Saturated seconds | Saturation percentage |
|---|---|---|---|
| A | 236 | 2 | 0.847458% |
| B | 236 | 1 | 0.423729% |
| C | 237 | 0 | 0.000000% |
| D | 237 | 29 | 12.236287% |
Noise dominated data is calculated using 1-second bins in cleaned event files. If a bin has >2000 counts, and if more than 50% of those come from <1% of pixels, then it is considered to be noise-dominated and hence unusable.
| Quadrant | # 1 sec bins | Bins with >0 counts | Bins with >2000 counts | High rate bins dominated by noise | Noise dominated (total time) | Noise dominated (detector-on time) | Marked lightcurve |
|---|---|---|---|---|---|---|---|
| A | 236 | 236 | 0 | 0 | 0.00% | 0.00% | 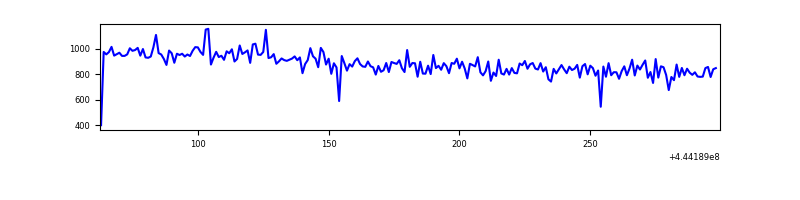 |
| B | 236 | 236 | 0 | 0 | 0.00% | 0.00% | 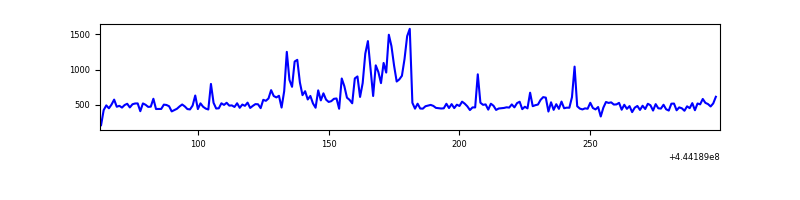 |
| C | 237 | 237 | 0 | 0 | 0.00% | 0.00% | 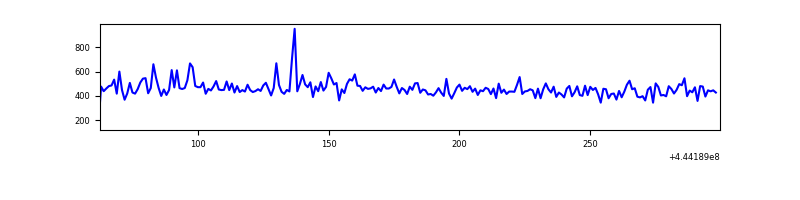 |
| D | 237 | 237 | 32 | 32 | 13.50% | 13.50% | 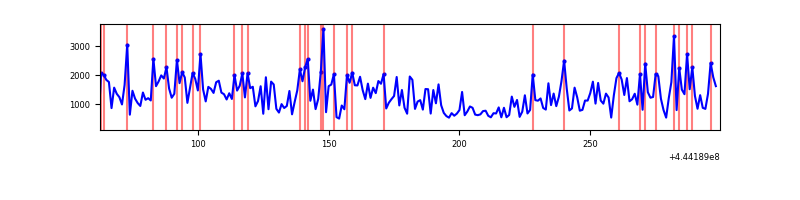 |
Top three noisy pixels from each quadrant. If the there are fewer than three noisy pixels in the level2.evt file, extra rows are filled as -1
| Pixel properties | Quadrant properties | ||||||
|---|---|---|---|---|---|---|---|
| Quadrant | DetID | PixID | Counts | Sigma | Mean | Median | Sigma |
| A | 10 | 83 | 100307 | 13181.52 | 27 | 26 | 7.6 |
| A | 12 | 227 | 1861 | 241.2 | 27 | 26 | 7.6 |
| A | 7 | 3 | 1607 | 207.82 | 27 | 26 | 7.6 |
| B | 0 | 183 | 22595 | 2935.28 | 27 | 26 | 7.7 |
| B | 10 | 3 | 2991 | 385.62 | 27 | 26 | 7.7 |
| B | 12 | 111 | 695 | 87.01 | 27 | 26 | 7.7 |
| C | 14 | 254 | 3778 | 454.25 | 27 | 27 | 8.3 |
| C | 13 | 61 | 175 | 17.92 | 27 | 27 | 8.3 |
| C | 14 | 67 | 74 | 5.69 | 27 | 27 | 8.3 |
| D | 9 | 49 | 182304 | 22809.48 | 25 | 24 | 8.0 |
| D | 1 | 52 | 17668 | 2207.87 | 25 | 24 | 8.0 |
| D | 11 | 241 | 6464 | 805.87 | 25 | 24 | 8.0 |
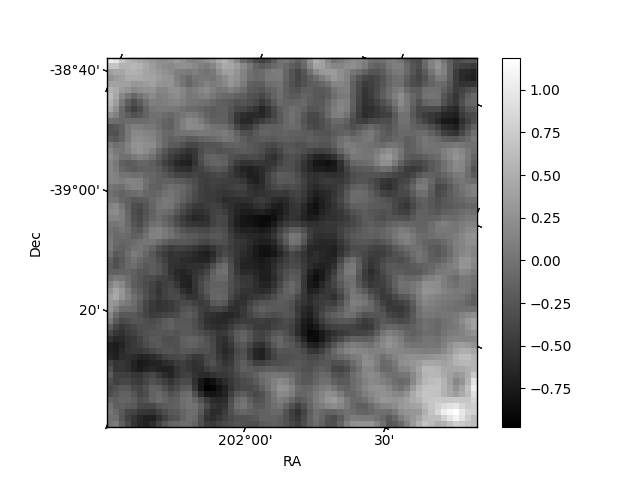
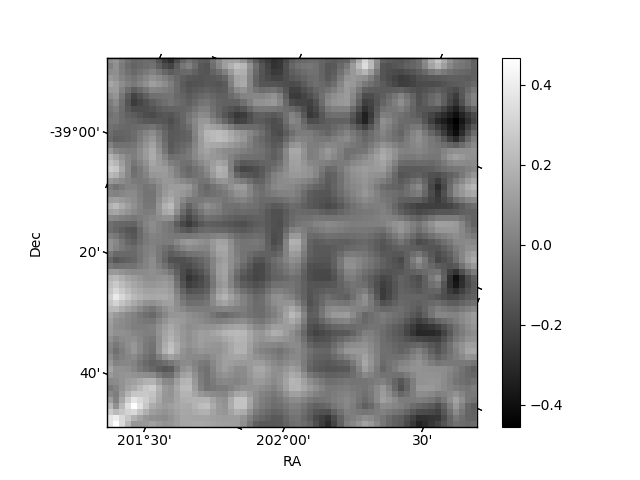
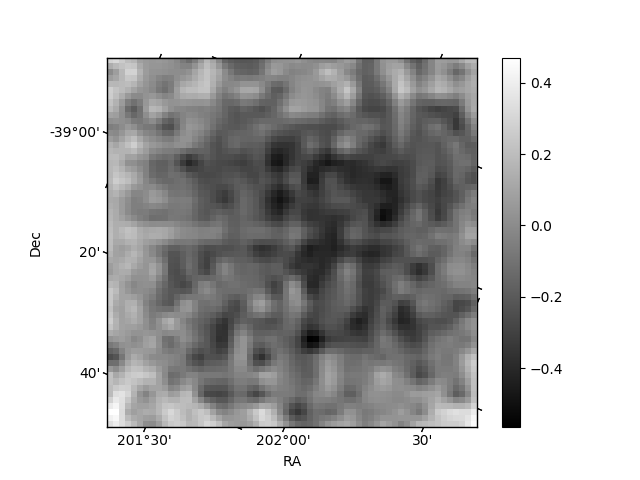
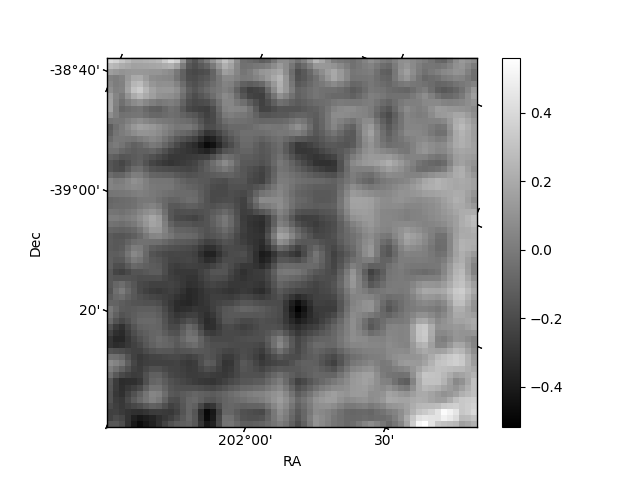
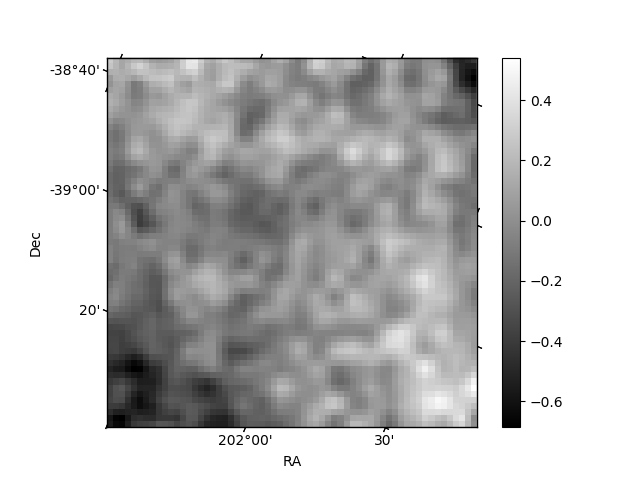
Histogram calculated using DETX and DETY for each event in the final _common_clean file
| Quadrant A | 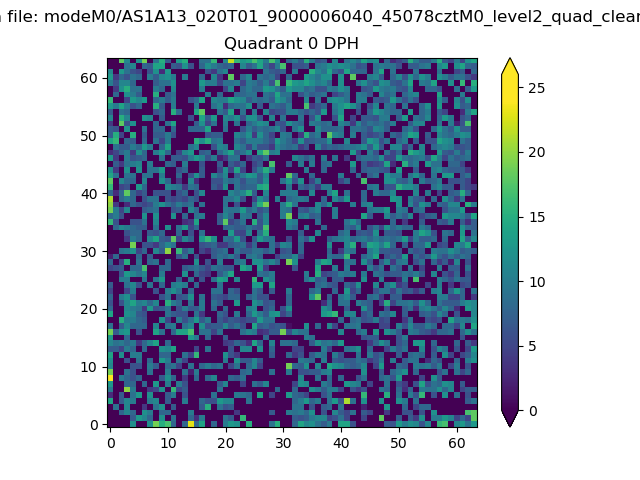 |
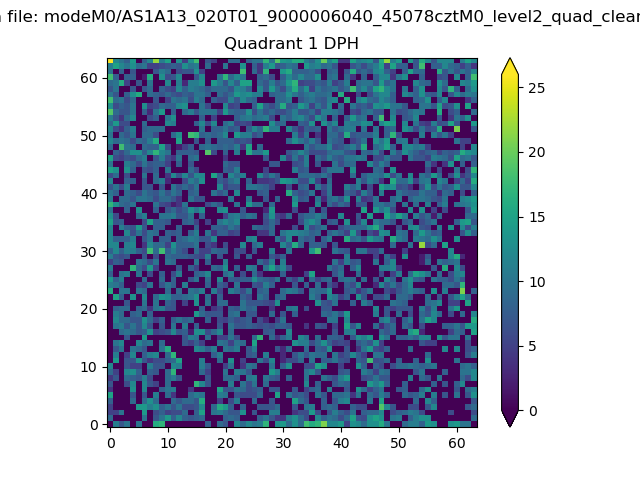 |
Quadrant B |
|---|---|---|---|
| Quadrant D | 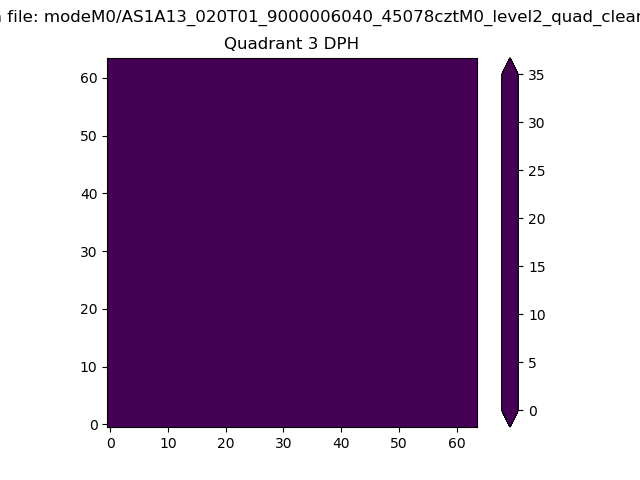 |
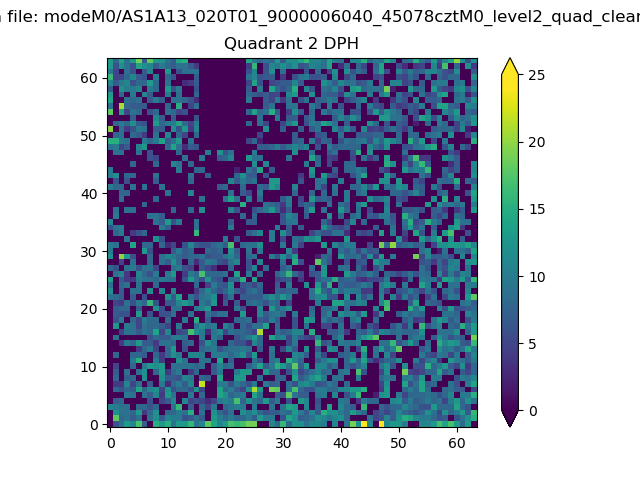 |
Quadrant C |
| Plot type | Count rate plots | Images |
|---|---|---|
| Comparison with Poisson distribution Blue bars denote a histogram of data divided into 1 sec bins. Red curve is a Poisson curve with rate = median count rate of data. |
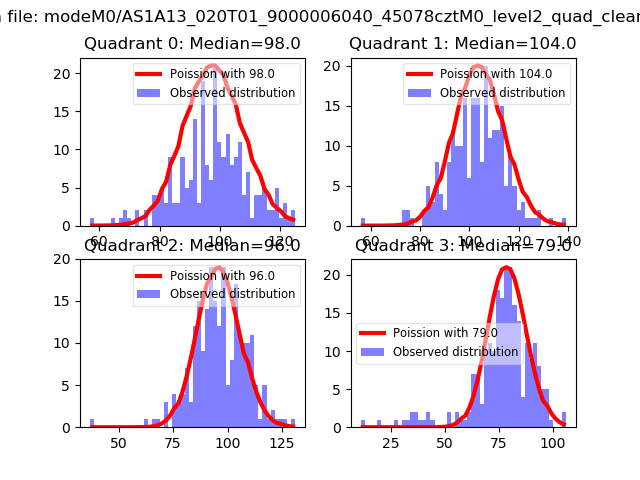 |
 |
| Quadrant-wise count rates Data is divided into 100 sec bins |
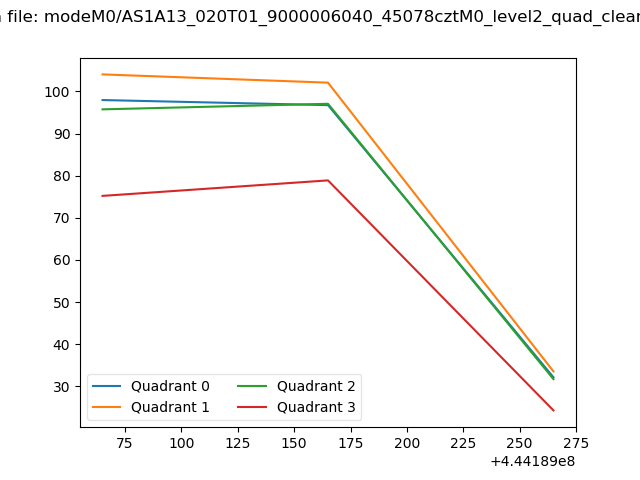 |
|
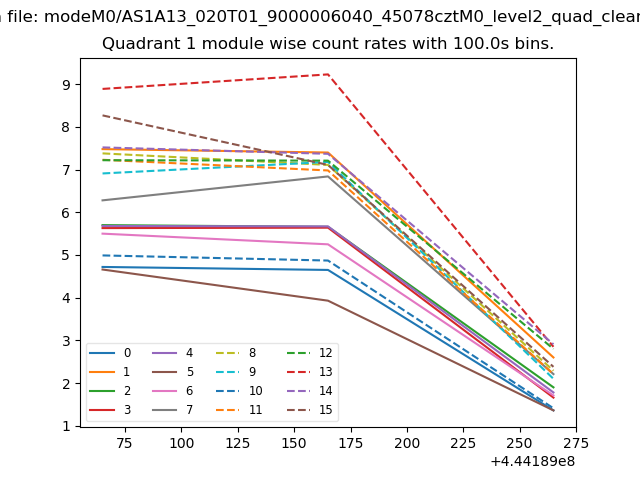
| Module-wise count rates for Quadrant A Data is divided into 100 sec bins |
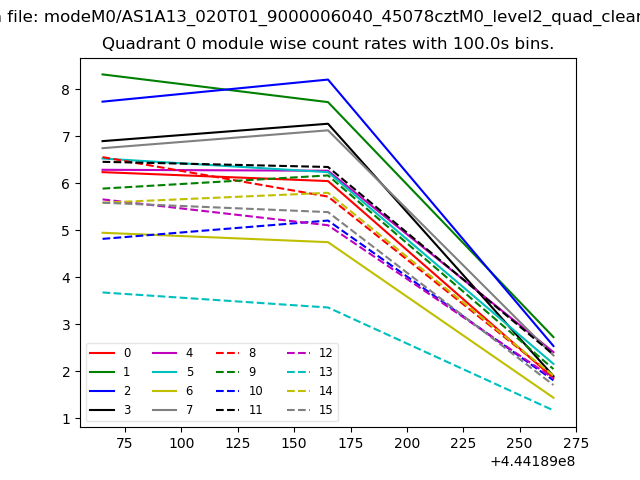 |
 |
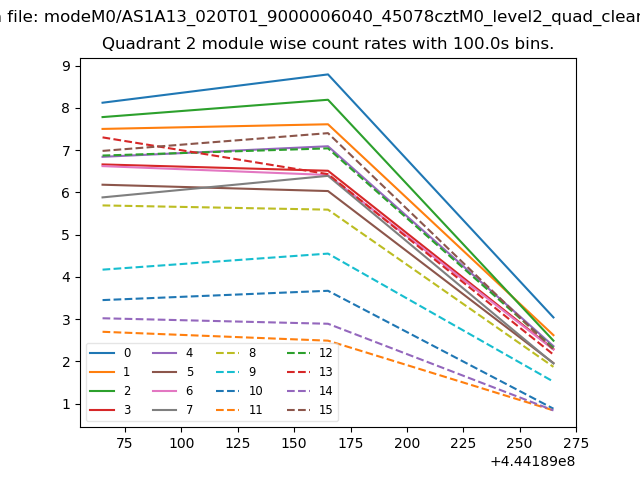
| Module-wise count rates for Quadrant B Data is divided into 100 sec bins |
 |
 |
| Module-wise count rates for Quadrant C Data is divided into 100 sec bins |
 |
 |
| Module-wise count rates for Quadrant D Data is divided into 100 sec bins |
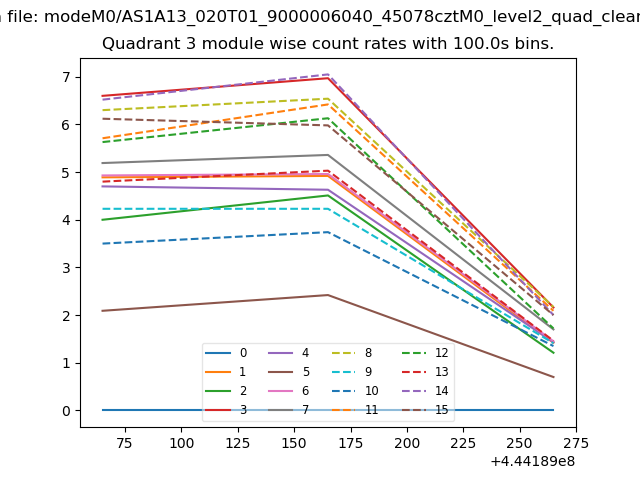 |
 |
| Parameter | Plot |
|---|---|
| CZT HV Monitor | 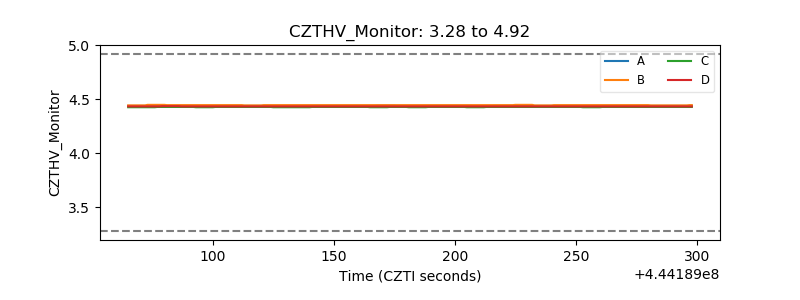 |
| D_VDD | 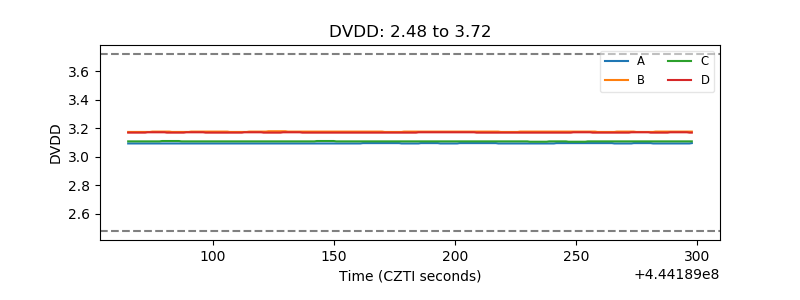 |
| Temperature 1 | 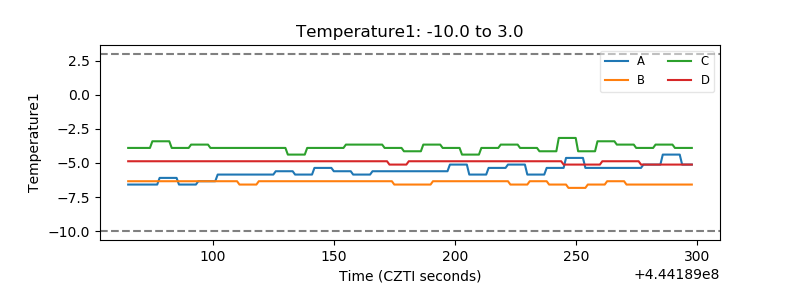 |
| Veto HV Monitor |  |
| Veto LLD | 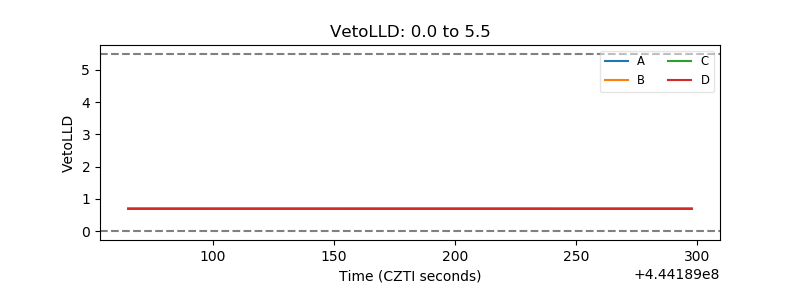 |
| Alpha Counter | 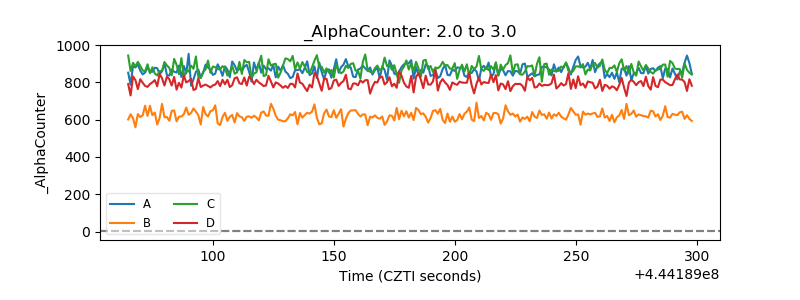 |
| _CPM_Rate | 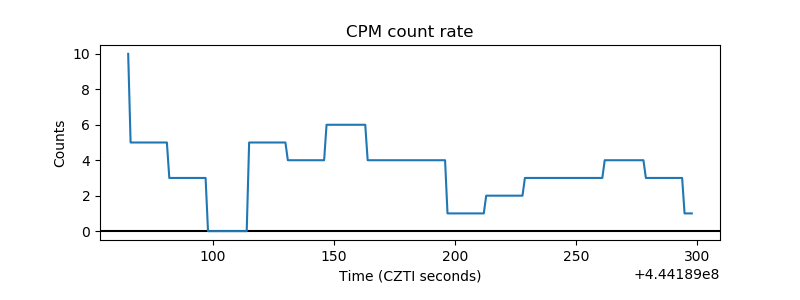 |
| CZT Counter | 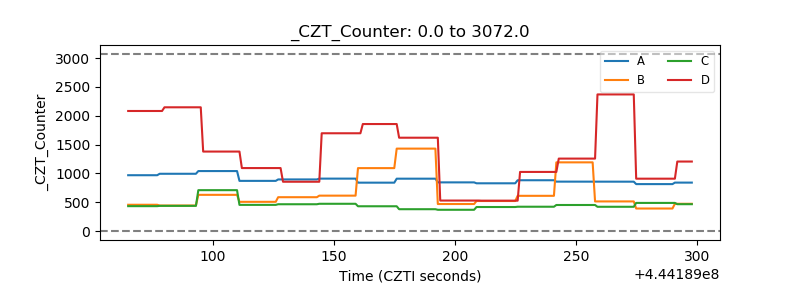 |
| +2.5 Volts monitor | 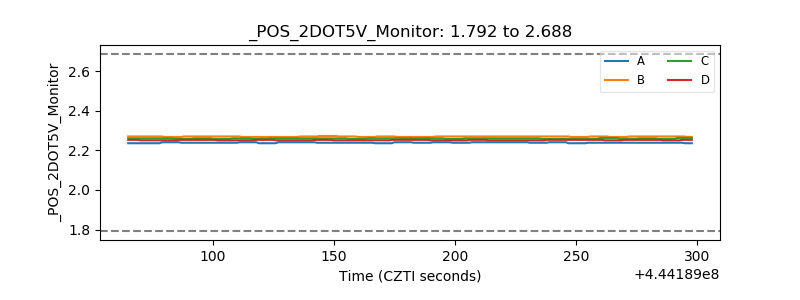 |
| +5 Volts monitor | 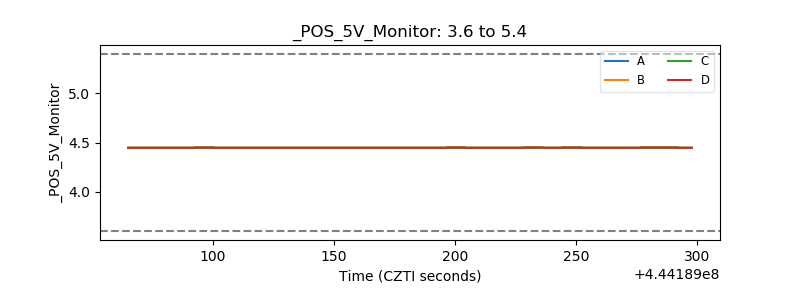 |
| _ROLL_ROT | 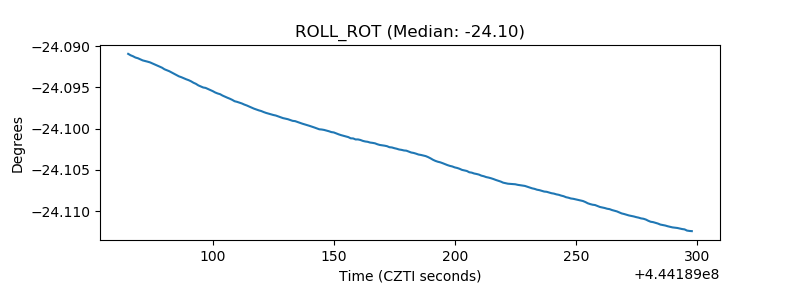 |
| _Roll_DEC | 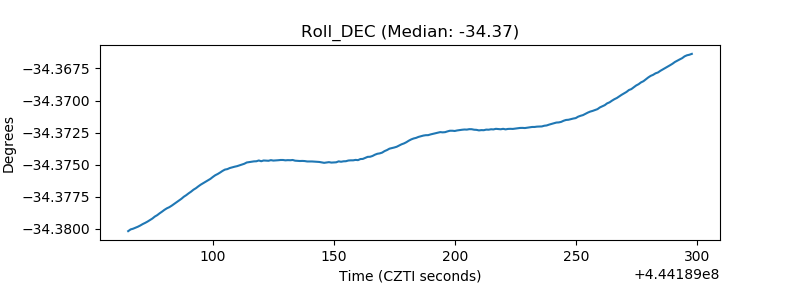 |
| _Roll_RA | 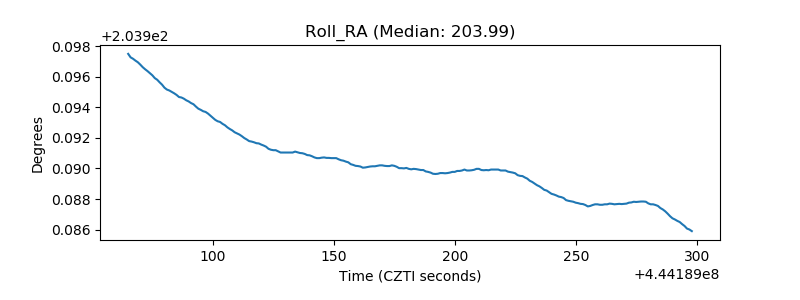 |
| Veto Counter | 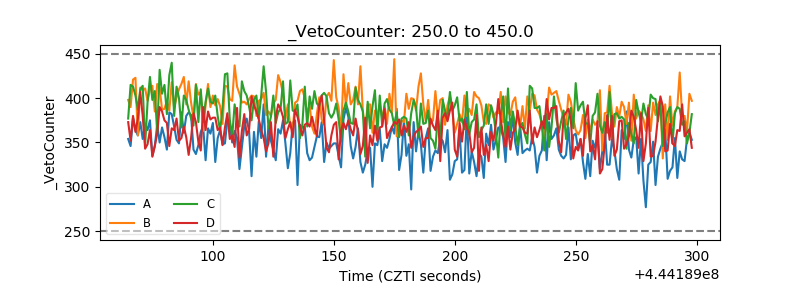 |