| Param | Original file | Final file |
|---|---|---|
| Filename | modeM0/AS1A13_017T02_9000006046_45124cztM0_level2.fits | modeM0/AS1A13_017T02_9000006046_45124cztM0_level2_quad_clean.evt |
| Size (bytes) | 451,307,520 | 107,259,840 |
| Size | 430.4 MB | 102.3 MB |
| Events in quadrant A | 5,117,005 | 715,213 |
| Events in quadrant B | 3,030,698 | 749,924 |
| Events in quadrant C | 2,840,568 | 717,330 |
| Events in quadrant D | 5,219,978 | 617,985 |
| Mode M0 | |||
|---|---|---|---|
| Quadrant | BADHDUFLAG | Total packets | Discarded packets |
| A | 0 | 20116 | 3 |
| B | 0 | 13441 | 1 |
| C | 0 | 13114 | 1 |
| D | 0 | 20005 | 1 |
| Mode M9 | |||
|---|---|---|---|
| Quadrant | BADHDUFLAG | Total packets | Discarded packets |
| A | 0 | 11 | 0 |
| B | 0 | 11 | 0 |
| C | 0 | 11 | 0 |
| D | 0 | 11 | 0 |
| Mode SS | |||
|---|---|---|---|
| Quadrant | BADHDUFLAG | Total packets | Discarded packets |
| A | 0 | 130 | 0 |
| B | 0 | 130 | 0 |
| C | 0 | 130 | 0 |
| D | 0 | 130 | 0 |
| Quadrant | Total seconds | Saturated seconds | Saturation percentage |
|---|---|---|---|
| A | 6410 | 98 | 1.528861% |
| B | 6410 | 36 | 0.561622% |
| C | 6410 | 13 | 0.202808% |
| D | 6411 | 420 | 6.551240% |
Noise dominated data is calculated using 1-second bins in cleaned event files. If a bin has >2000 counts, and if more than 50% of those come from <1% of pixels, then it is considered to be noise-dominated and hence unusable.
| Quadrant | # 1 sec bins | Bins with >0 counts | Bins with >2000 counts | High rate bins dominated by noise | Noise dominated (total time) | Noise dominated (detector-on time) | Marked lightcurve |
|---|---|---|---|---|---|---|---|
| A | 7505 | 6411 | 15 | 15 | 0.20% | 0.23% | 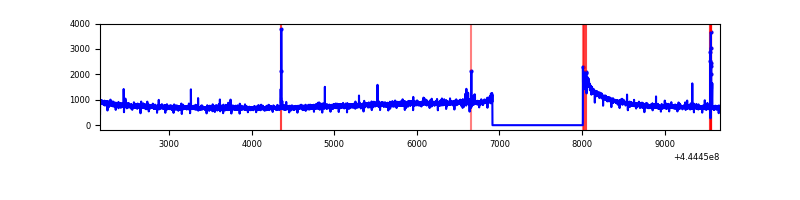 |
| B | 7505 | 6411 | 2 | 2 | 0.03% | 0.03% | 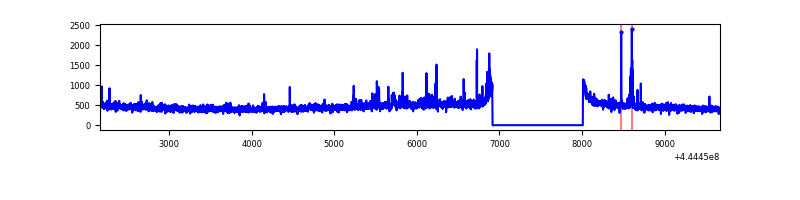 |
| C | 7505 | 6411 | 1 | 1 | 0.01% | 0.02% | 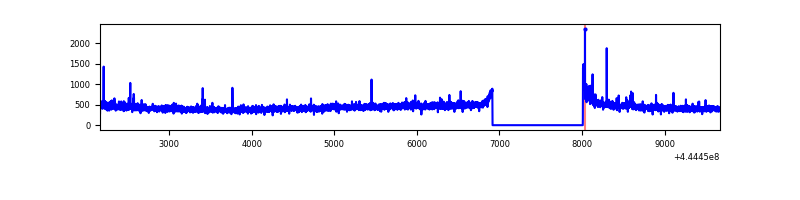 |
| D | 7506 | 6412 | 360 | 360 | 4.80% | 5.61% | 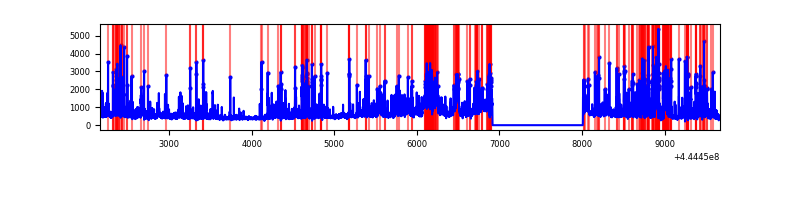 |
Top three noisy pixels from each quadrant. If the there are fewer than three noisy pixels in the level2.evt file, extra rows are filled as -1
| Pixel properties | Quadrant properties | ||||||
|---|---|---|---|---|---|---|---|
| Quadrant | DetID | PixID | Counts | Sigma | Mean | Median | Sigma |
| A | 10 | 83 | 2244472 | 14866.97 | 724 | 710 | 150.9 |
| A | 15 | 223 | 60030 | 393.05 | 724 | 710 | 150.9 |
| A | 3 | 137 | 8062 | 48.71 | 724 | 710 | 150.9 |
| B | 0 | 183 | 34441 | 233.77 | 731 | 708 | 144.3 |
| B | 0 | 155 | 34291 | 232.73 | 731 | 708 | 144.3 |
| B | 5 | 255 | 29353 | 198.51 | 731 | 708 | 144.3 |
| C | 15 | 208 | 23810 | 137.01 | 715 | 719 | 168.5 |
| C | 12 | 250 | 22139 | 127.1 | 715 | 719 | 168.5 |
| C | 13 | 61 | 4737 | 23.84 | 715 | 719 | 168.5 |
| D | 13 | 249 | 971685 | 5544.0 | 694 | 672 | 175.1 |
| D | 13 | 29 | 449518 | 2562.69 | 694 | 672 | 175.1 |
| D | 4 | 223 | 296521 | 1689.15 | 694 | 672 | 175.1 |
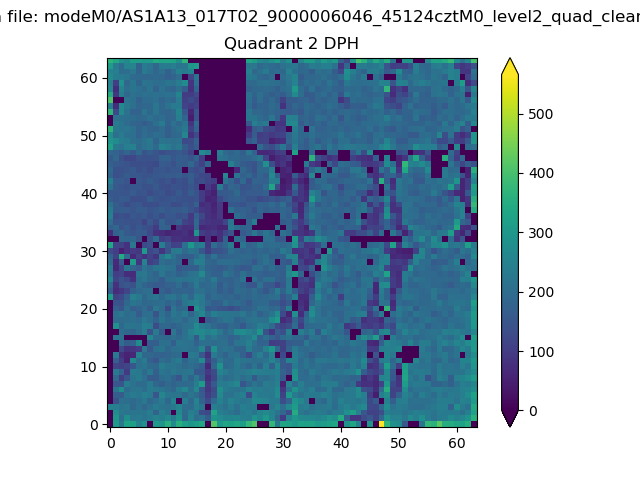
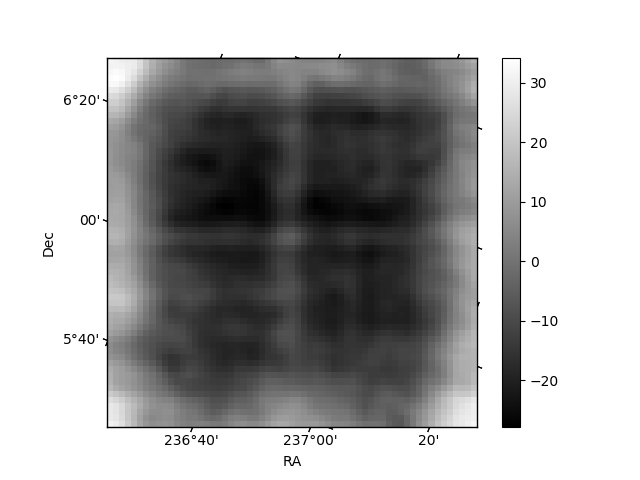
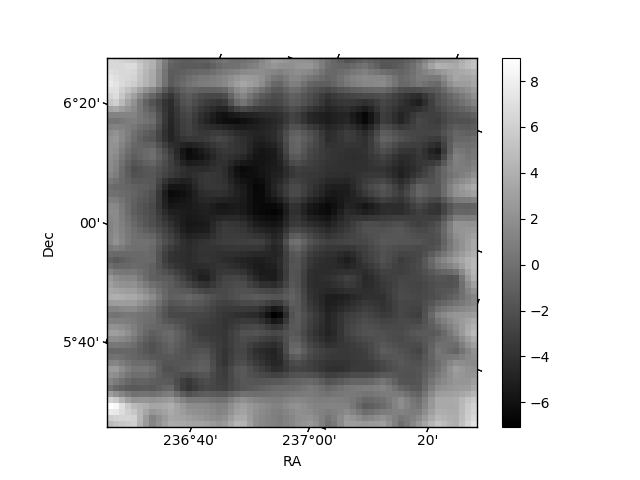
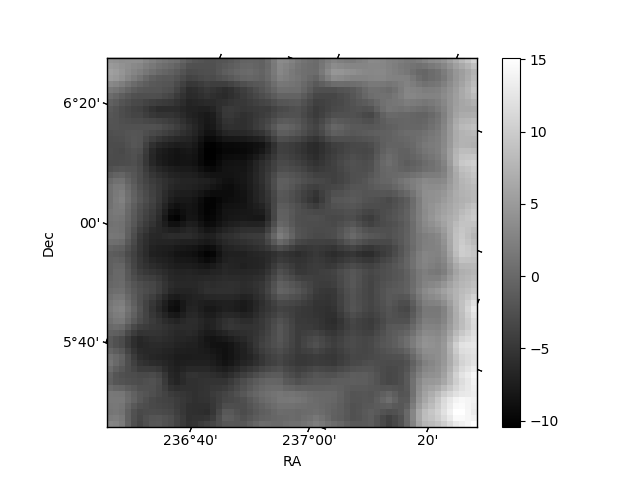
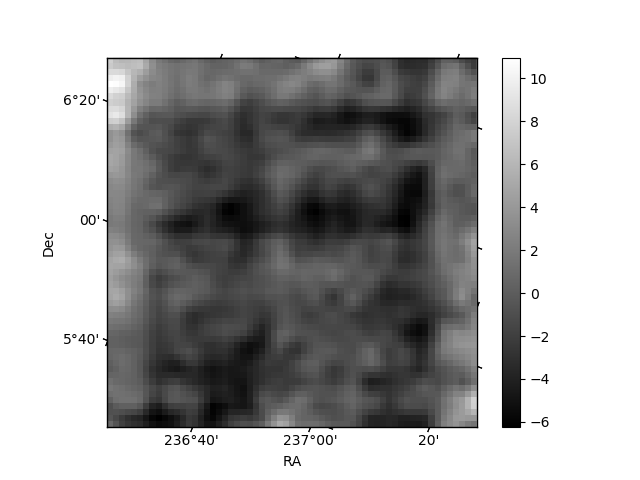
Histogram calculated using DETX and DETY for each event in the final _common_clean file
| Quadrant A | 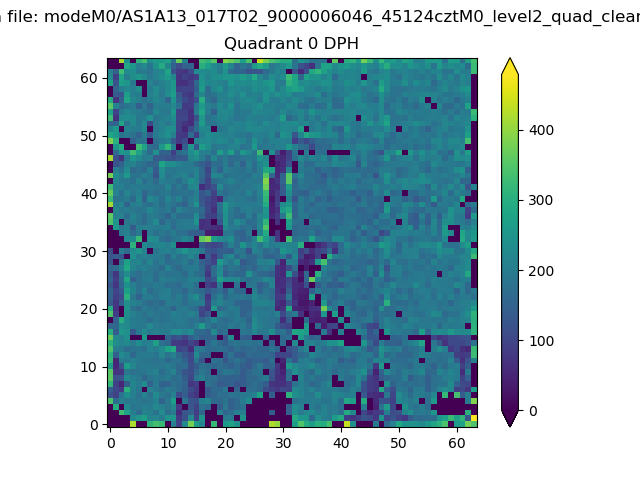 |
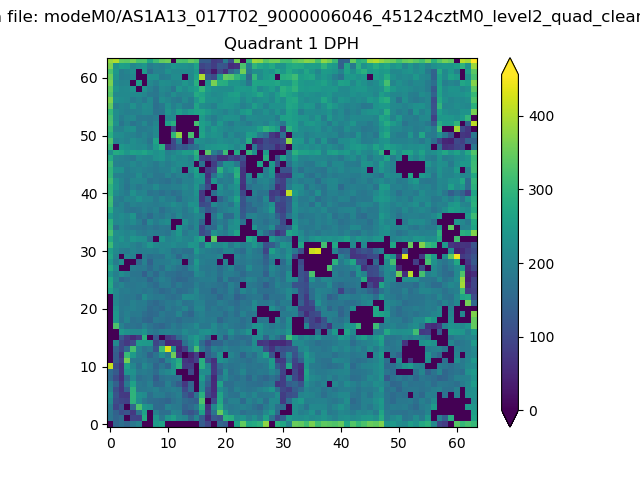 |
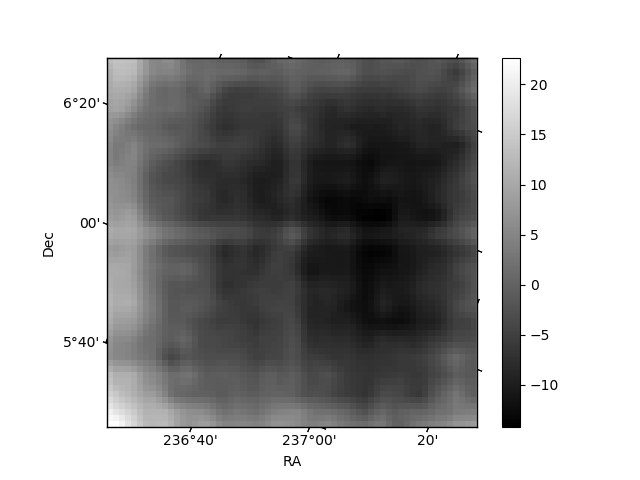
Quadrant B |
|---|---|---|---|
| Quadrant D | 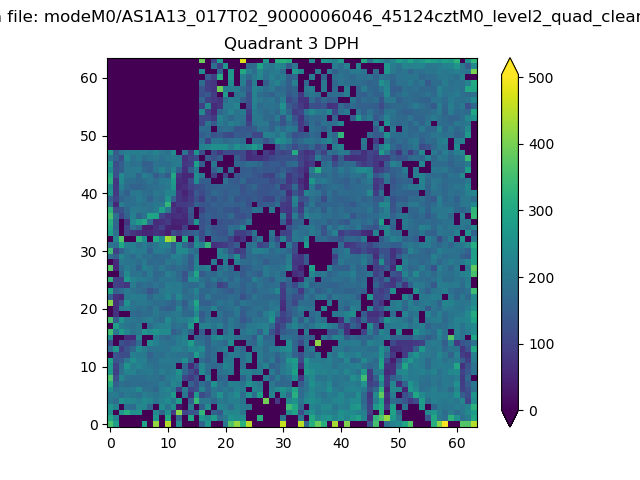 |
 |
Quadrant C |
| Plot type | Count rate plots | Images |
|---|---|---|
| Comparison with Poisson distribution Blue bars denote a histogram of data divided into 1 sec bins. Red curve is a Poisson curve with rate = median count rate of data. |
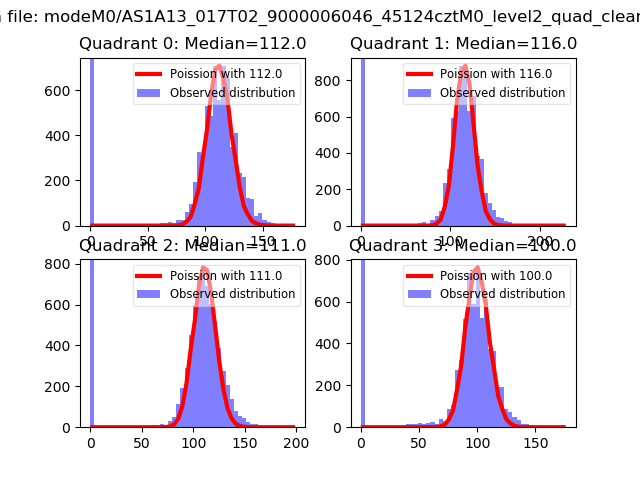 |
 |
| Quadrant-wise count rates Data is divided into 100 sec bins |
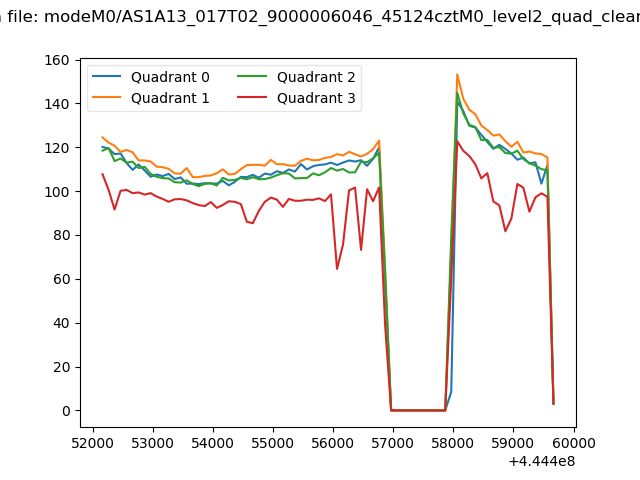 |
|
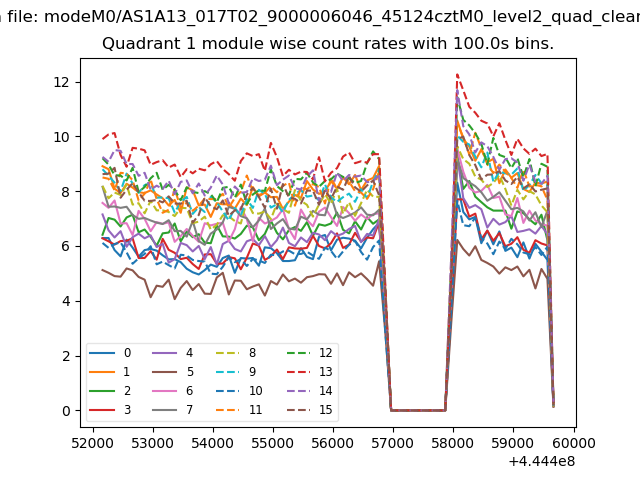
| Module-wise count rates for Quadrant A Data is divided into 100 sec bins |
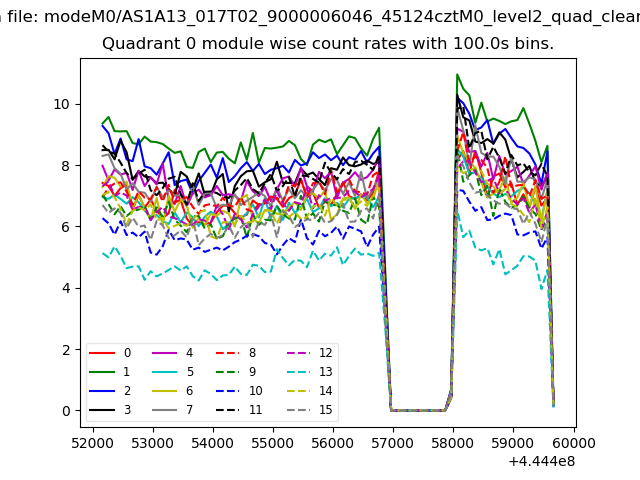 |
 |
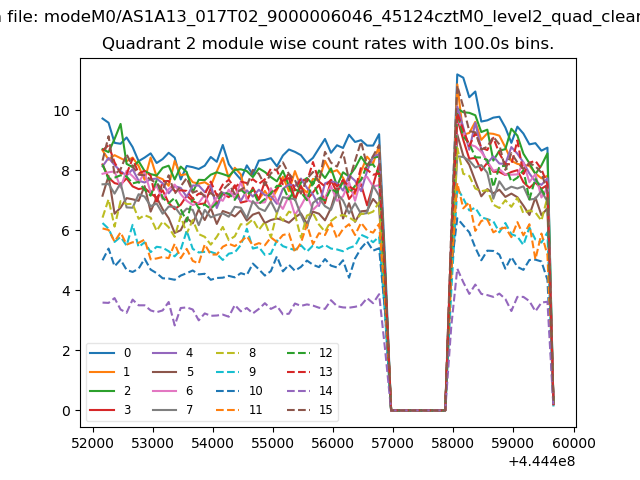
| Module-wise count rates for Quadrant B Data is divided into 100 sec bins |
 |
 |
| Module-wise count rates for Quadrant C Data is divided into 100 sec bins |
 |
 |
| Module-wise count rates for Quadrant D Data is divided into 100 sec bins |
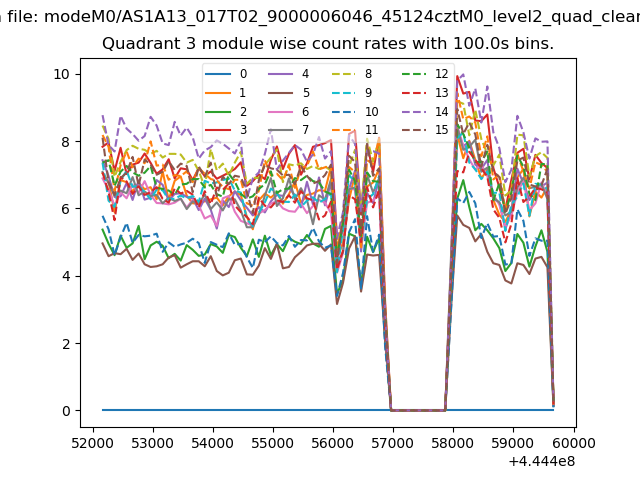 |
 |
| Parameter | Plot |
|---|---|
| CZT HV Monitor | 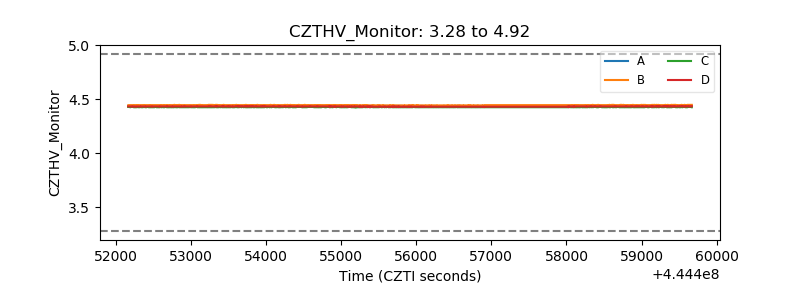 |
| D_VDD | 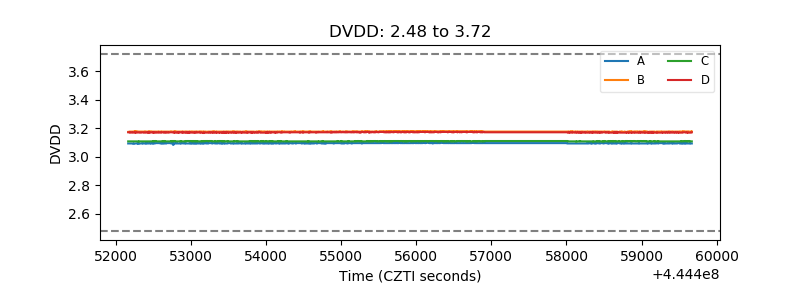 |
| Temperature 1 | 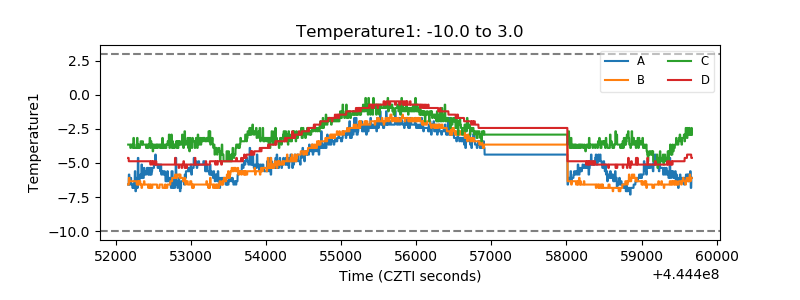 |
| Veto HV Monitor | 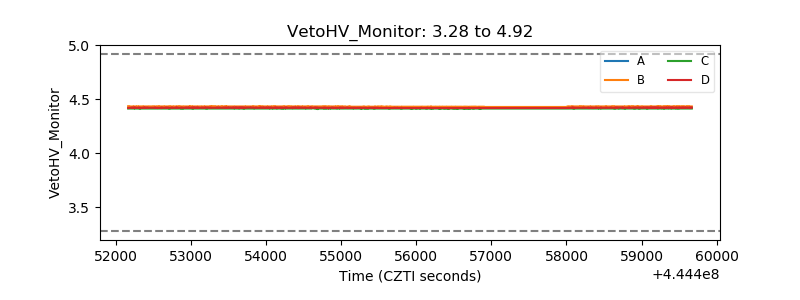 |
| Veto LLD | 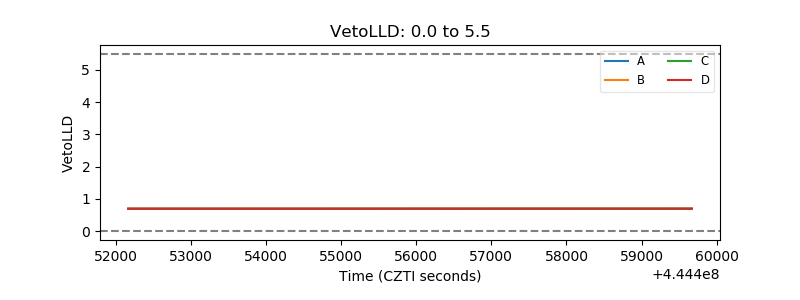 |
| Alpha Counter | 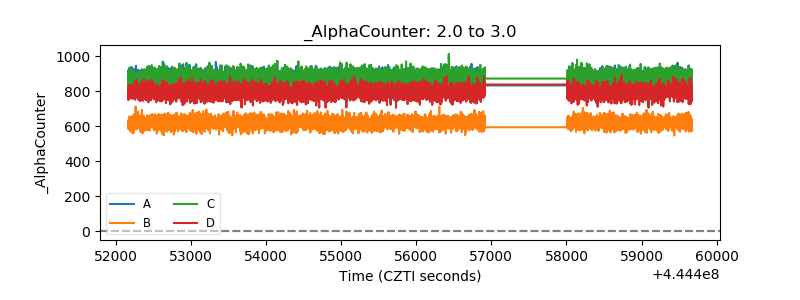 |
| _CPM_Rate | 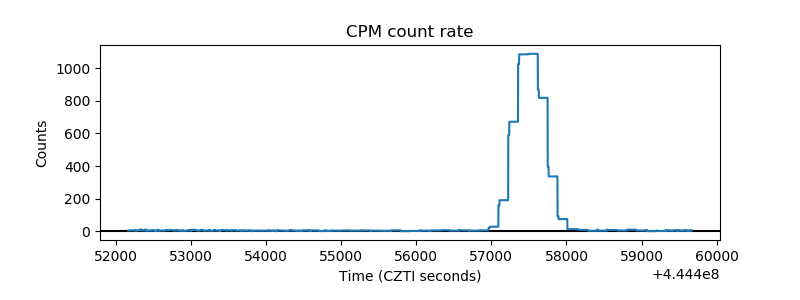 |
| CZT Counter | 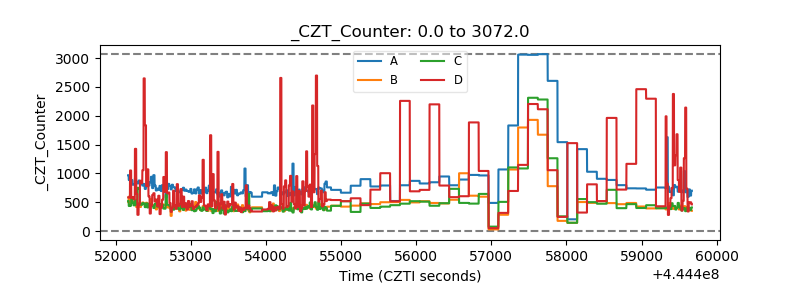 |
| +2.5 Volts monitor | 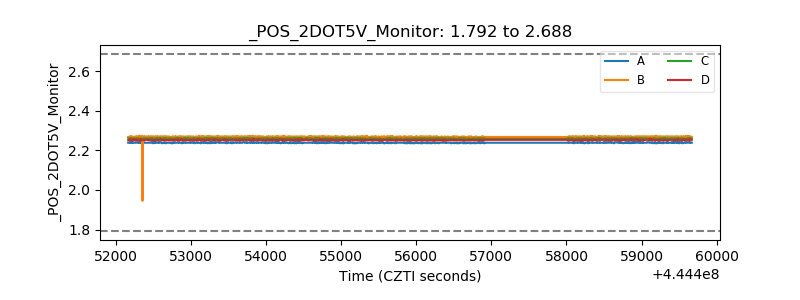 |
| +5 Volts monitor | 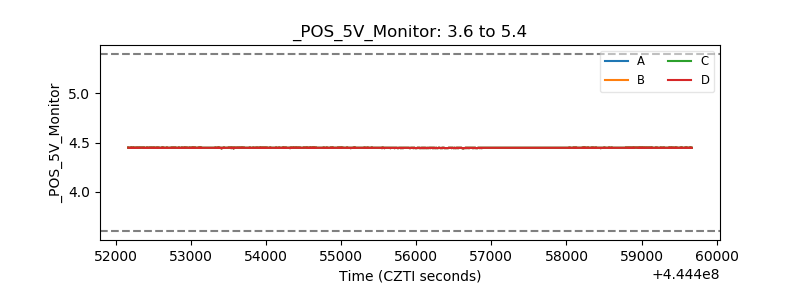 |
| _ROLL_ROT | 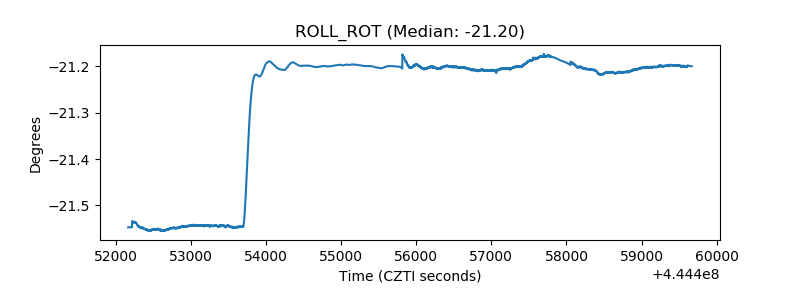 |
| _Roll_DEC | 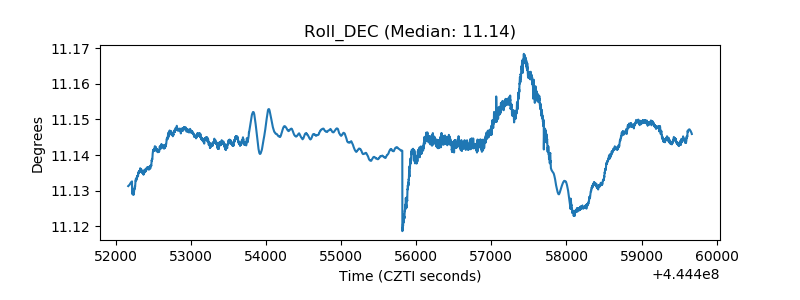 |
| _Roll_RA | 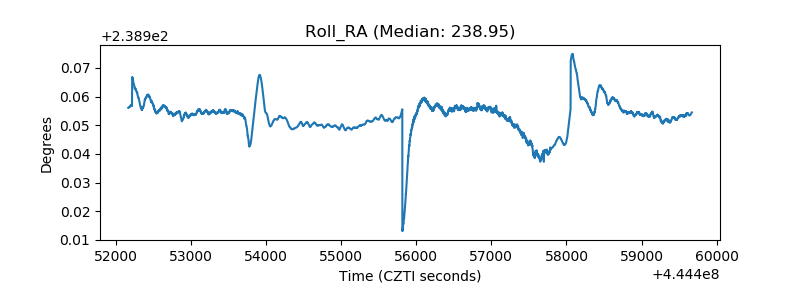 |
| Veto Counter | 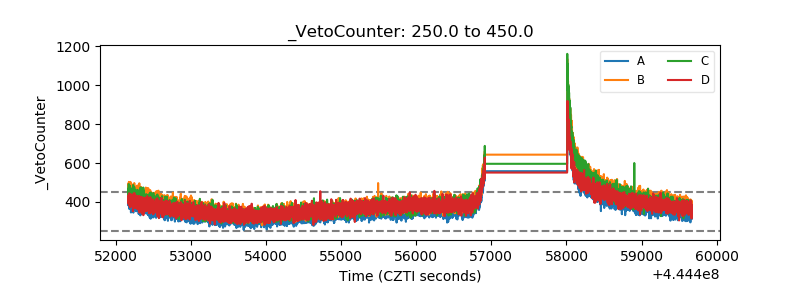 |