| Param | Original file | Final file |
|---|---|---|
| Filename | modeM0/AS1A13_017T02_9000006046_45125cztM0_level2.fits | modeM0/AS1A13_017T02_9000006046_45125cztM0_level2_quad_clean.evt |
| Size (bytes) | 542,543,040 | 112,878,720 |
| Size | 517.4 MB | 107.6 MB |
| Events in quadrant A | 7,398,051 | 674,172 |
| Events in quadrant B | 3,321,560 | 819,793 |
| Events in quadrant C | 3,108,085 | 783,963 |
| Events in quadrant D | 5,735,967 | 673,741 |
| Mode M0 | |||
|---|---|---|---|
| Quadrant | BADHDUFLAG | Total packets | Discarded packets |
| A | 0 | 26952 | 4 |
| B | 0 | 14339 | 2 |
| C | 0 | 13904 | 2 |
| D | 0 | 21644 | 2 |
| Mode M9 | |||
|---|---|---|---|
| Quadrant | BADHDUFLAG | Total packets | Discarded packets |
| A | 0 | 16 | 0 |
| B | 0 | 16 | 0 |
| C | 0 | 17 | 0 |
| D | 0 | 17 | 0 |
| Mode SS | |||
|---|---|---|---|
| Quadrant | BADHDUFLAG | Total packets | Discarded packets |
| A | 0 | 134 | 0 |
| B | 0 | 134 | 0 |
| C | 0 | 134 | 0 |
| D | 0 | 134 | 0 |
| Quadrant | Total seconds | Saturated seconds | Saturation percentage |
|---|---|---|---|
| A | 6696 | 1097 | 16.382915% |
| B | 6696 | 84 | 1.254480% |
| C | 6696 | 42 | 0.627240% |
| D | 6696 | 495 | 7.392473% |
Noise dominated data is calculated using 1-second bins in cleaned event files. If a bin has >2000 counts, and if more than 50% of those come from <1% of pixels, then it is considered to be noise-dominated and hence unusable.
| Quadrant | # 1 sec bins | Bins with >0 counts | Bins with >2000 counts | High rate bins dominated by noise | Noise dominated (total time) | Noise dominated (detector-on time) | Marked lightcurve |
|---|---|---|---|---|---|---|---|
| A | 7841 | 6697 | 682 | 682 | 8.70% | 10.18% | 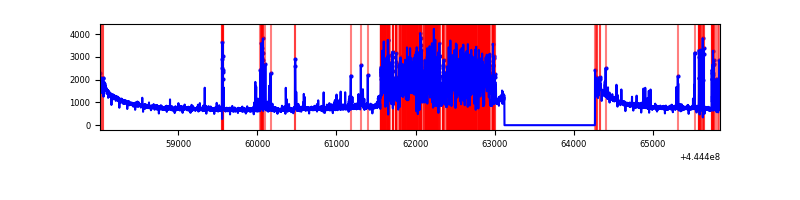 |
| B | 7841 | 6697 | 6 | 6 | 0.08% | 0.09% | 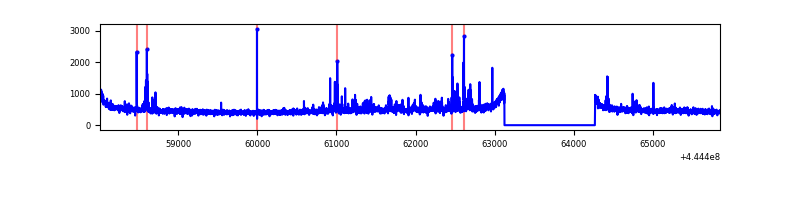 |
| C | 7841 | 6697 | 2 | 2 | 0.03% | 0.03% | 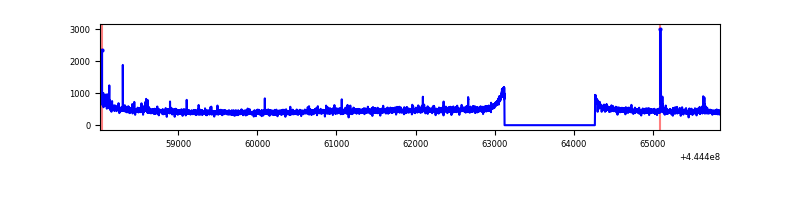 |
| D | 7841 | 6697 | 401 | 401 | 5.11% | 5.99% | 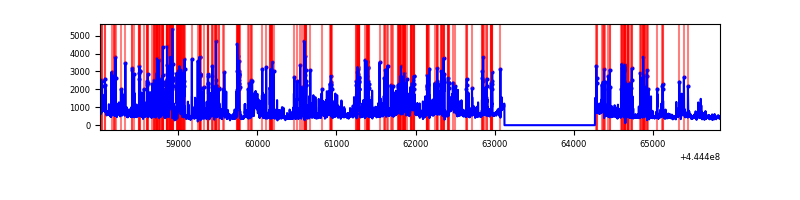 |
Top three noisy pixels from each quadrant. If the there are fewer than three noisy pixels in the level2.evt file, extra rows are filled as -1
| Pixel properties | Quadrant properties | ||||||
|---|---|---|---|---|---|---|---|
| Quadrant | DetID | PixID | Counts | Sigma | Mean | Median | Sigma |
| A | 10 | 83 | 2400774 | 15584.25 | 749 | 736 | 154.0 |
| A | 15 | 223 | 2091791 | 13577.92 | 749 | 736 | 154.0 |
| A | 3 | 137 | 8261 | 48.86 | 749 | 736 | 154.0 |
| B | 4 | 170 | 53703 | 340.91 | 797 | 774 | 155.3 |
| B | 0 | 183 | 33737 | 212.31 | 797 | 774 | 155.3 |
| B | 0 | 155 | 28599 | 179.22 | 797 | 774 | 155.3 |
| C | 15 | 208 | 23320 | 121.97 | 782 | 787 | 184.7 |
| C | 2 | 14 | 15256 | 78.32 | 782 | 787 | 184.7 |
| C | 12 | 250 | 9149 | 45.26 | 782 | 787 | 184.7 |
| D | 13 | 249 | 1262142 | 6605.28 | 760 | 738 | 191.0 |
| D | 13 | 29 | 418612 | 2188.18 | 760 | 738 | 191.0 |
| D | 13 | 171 | 257843 | 1346.32 | 760 | 738 | 191.0 |
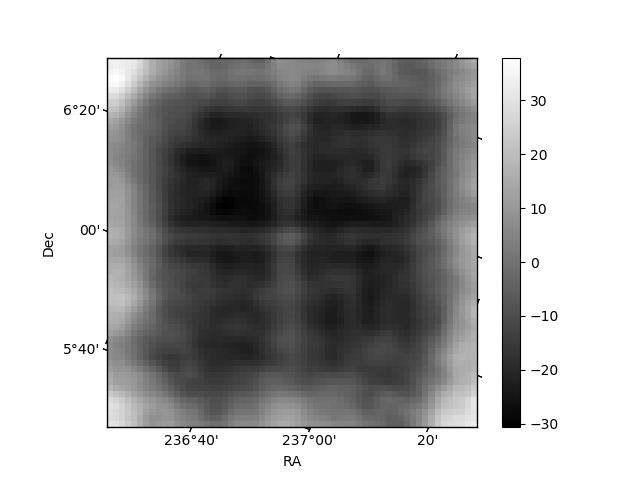
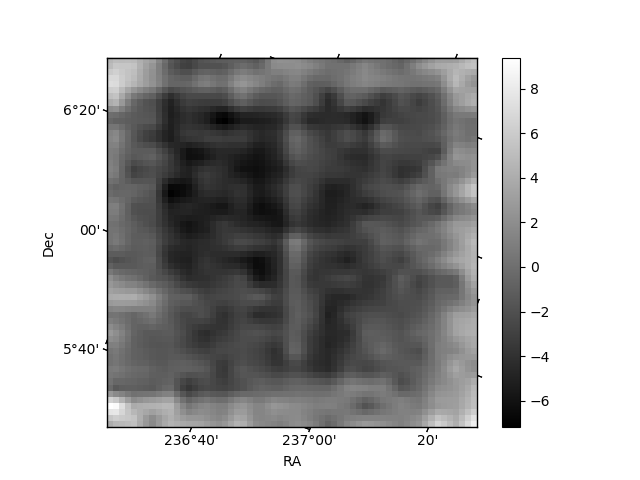
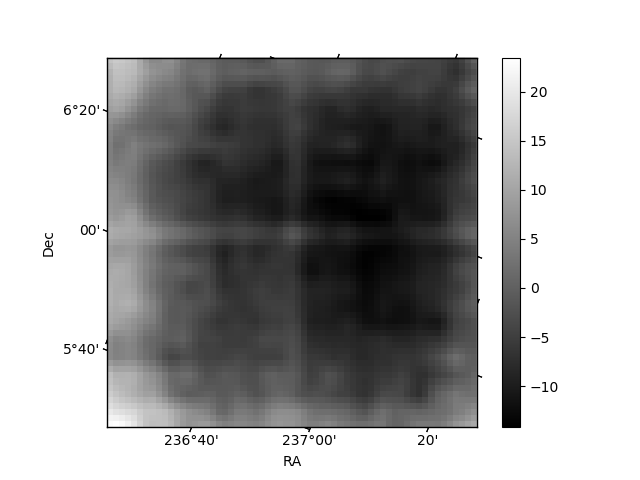
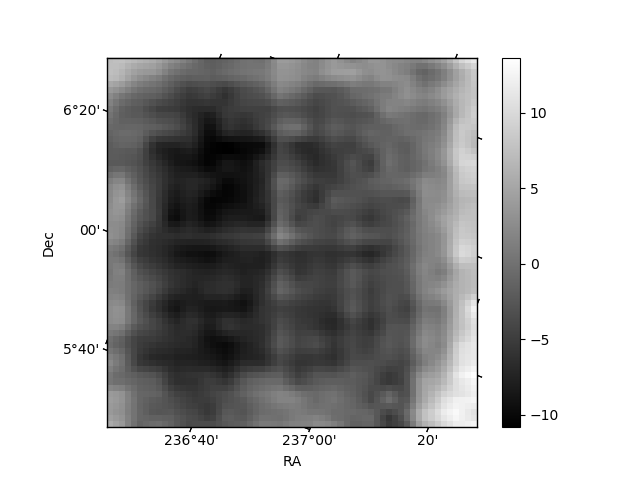
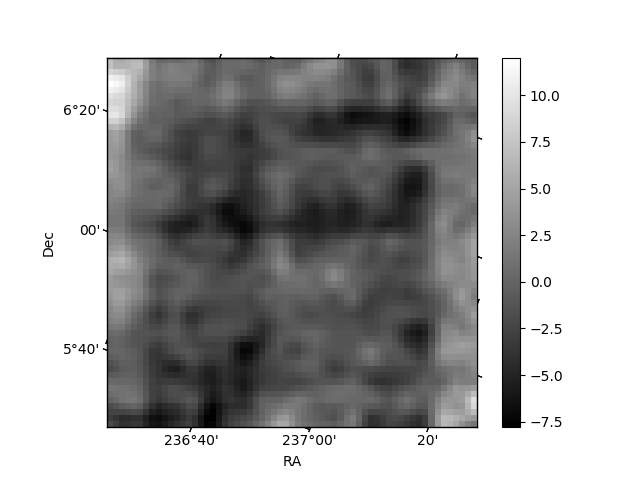
Histogram calculated using DETX and DETY for each event in the final _common_clean file
| Quadrant A | 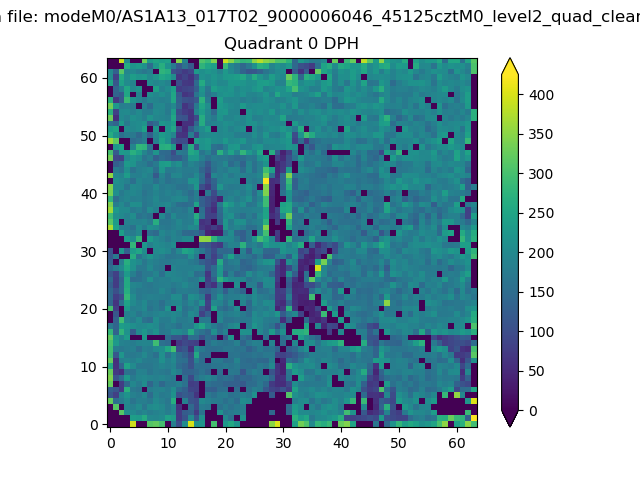 |
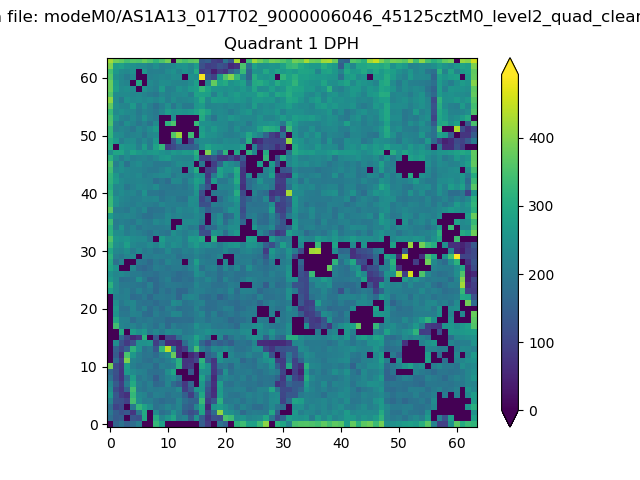 |
Quadrant B |
|---|---|---|---|
| Quadrant D | 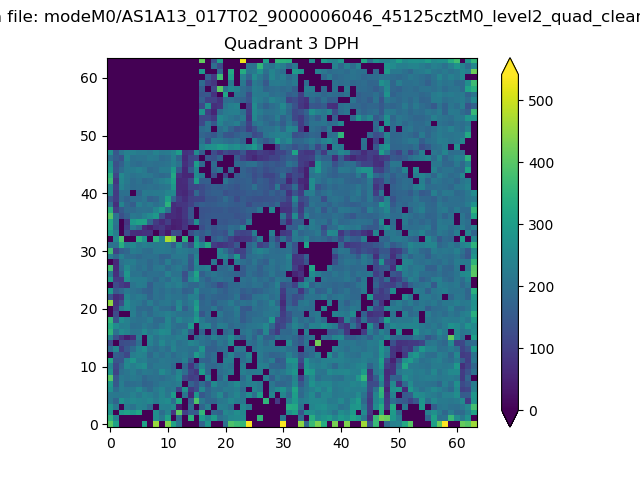 |
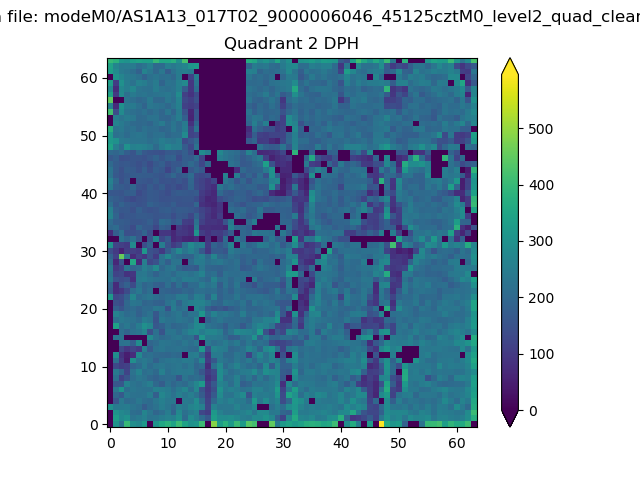 |
Quadrant C |
| Plot type | Count rate plots | Images |
|---|---|---|
| Comparison with Poisson distribution Blue bars denote a histogram of data divided into 1 sec bins. Red curve is a Poisson curve with rate = median count rate of data. |
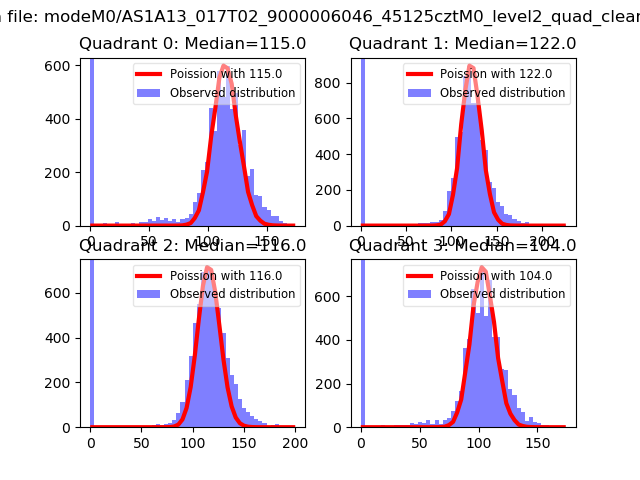 |
 |
| Quadrant-wise count rates Data is divided into 100 sec bins |
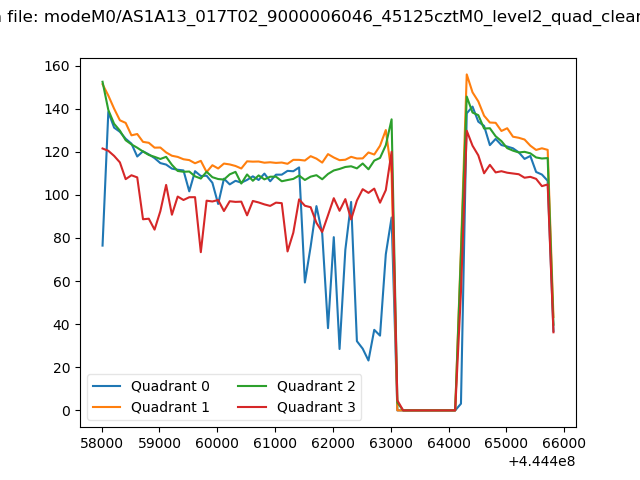 |
|
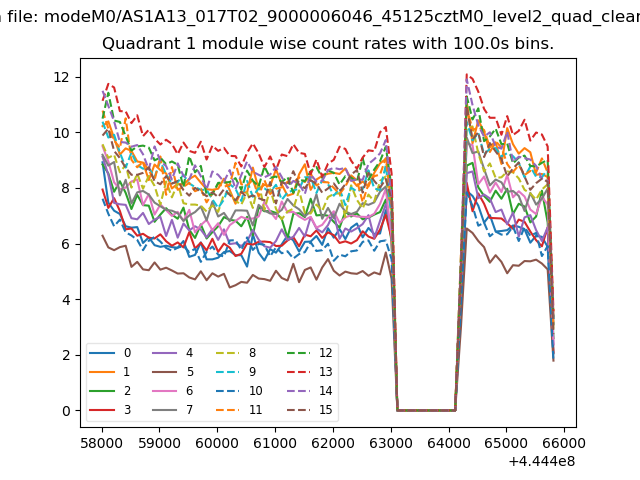
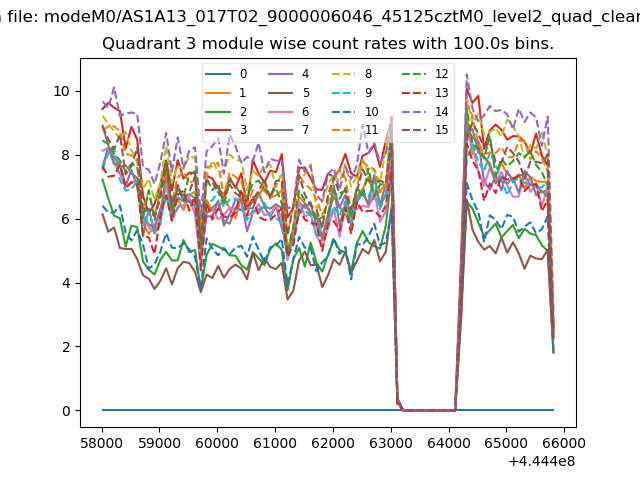
| Module-wise count rates for Quadrant A Data is divided into 100 sec bins |
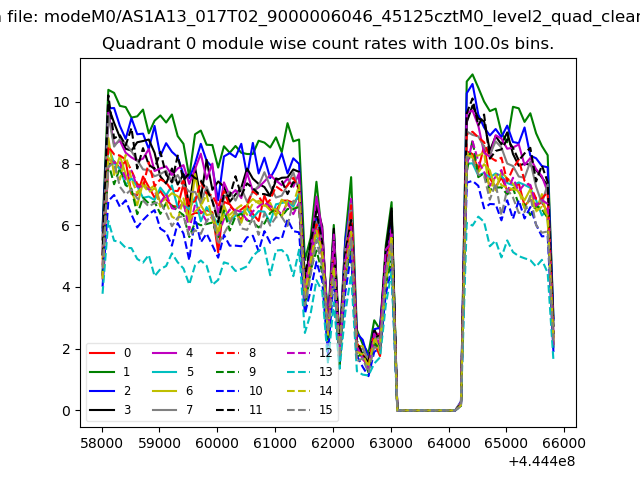 |
 |
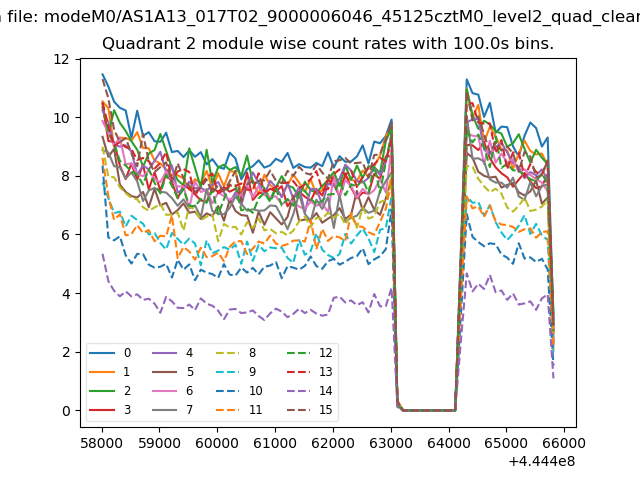
| Module-wise count rates for Quadrant B Data is divided into 100 sec bins |
 |
 |
| Module-wise count rates for Quadrant C Data is divided into 100 sec bins |
 |
 |
| Module-wise count rates for Quadrant D Data is divided into 100 sec bins |
 |
 |
| Parameter | Plot |
|---|---|
| CZT HV Monitor | 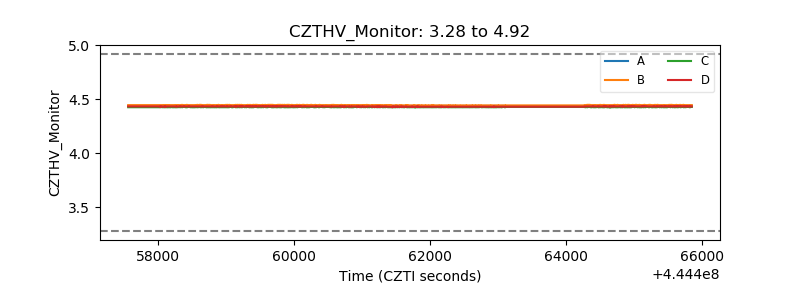 |
| D_VDD | 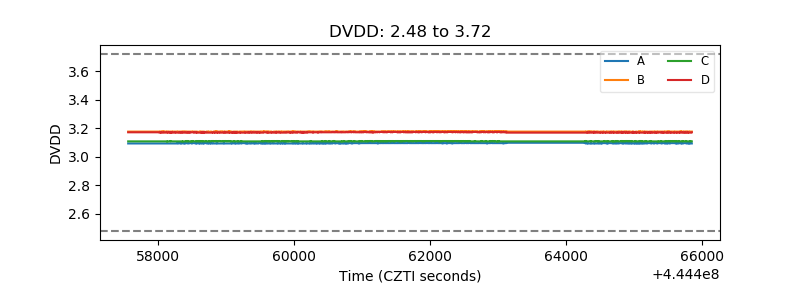 |
| Temperature 1 | 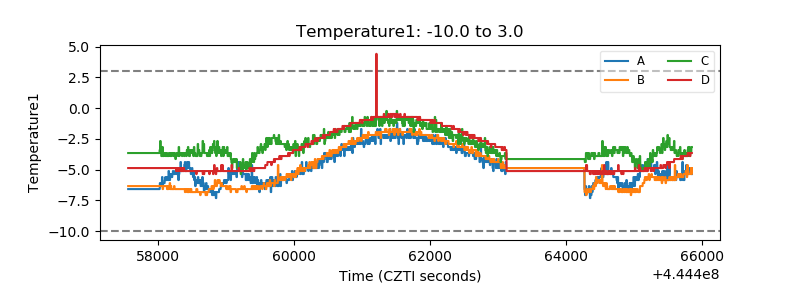 |
| Veto HV Monitor | 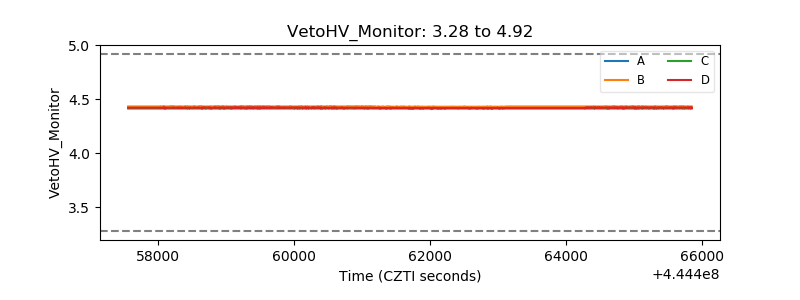 |
| Veto LLD | 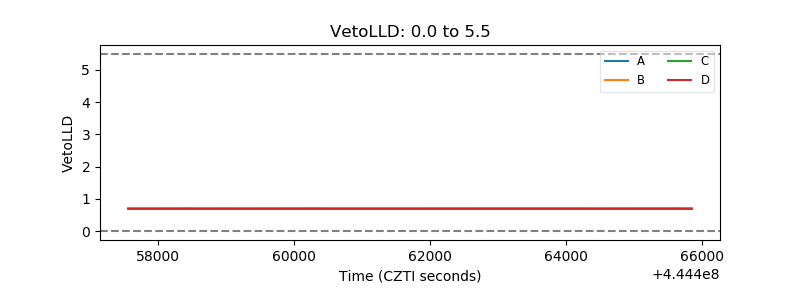 |
| Alpha Counter | 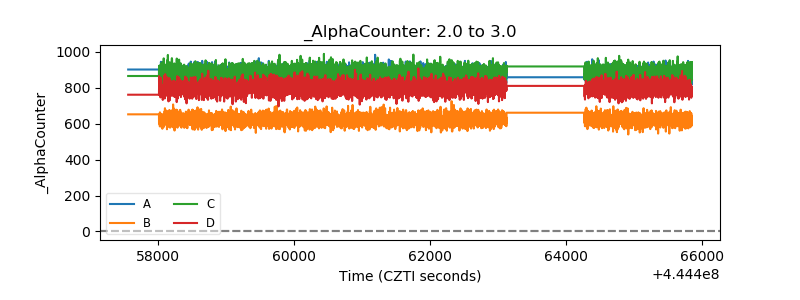 |
| _CPM_Rate | 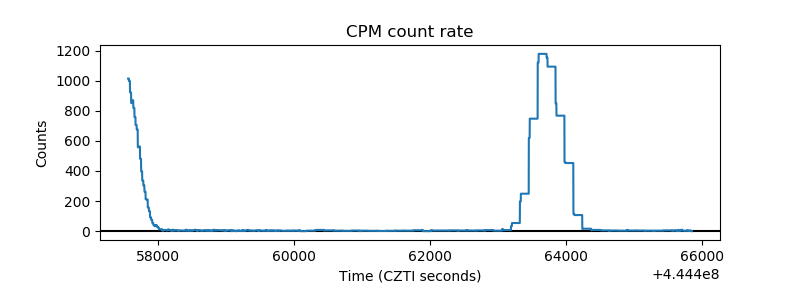 |
| CZT Counter | 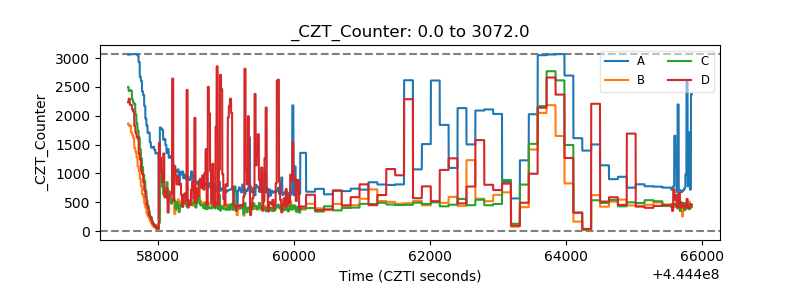 |
| +2.5 Volts monitor | 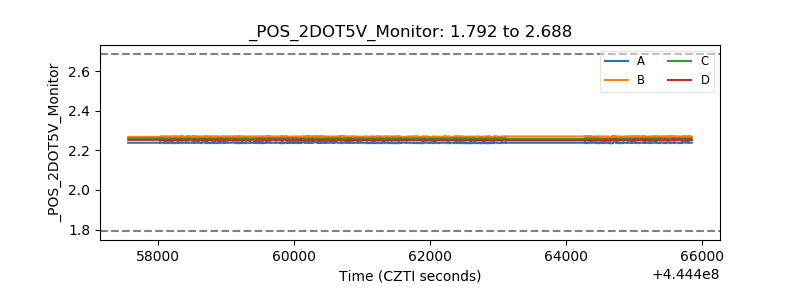 |
| +5 Volts monitor | 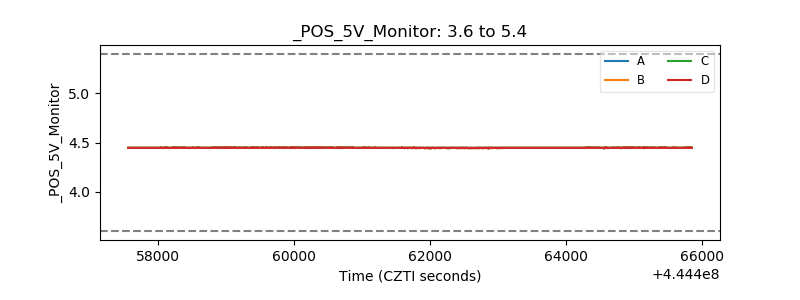 |
| _ROLL_ROT | 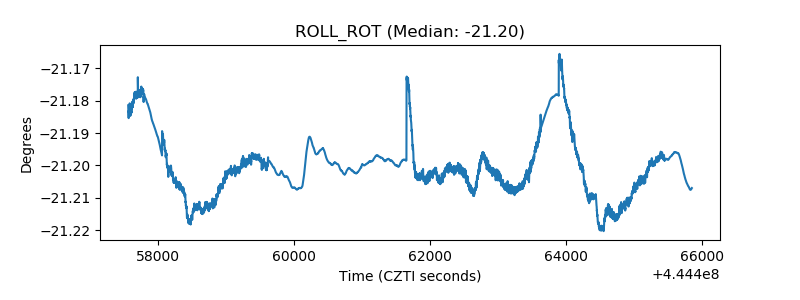 |
| _Roll_DEC | 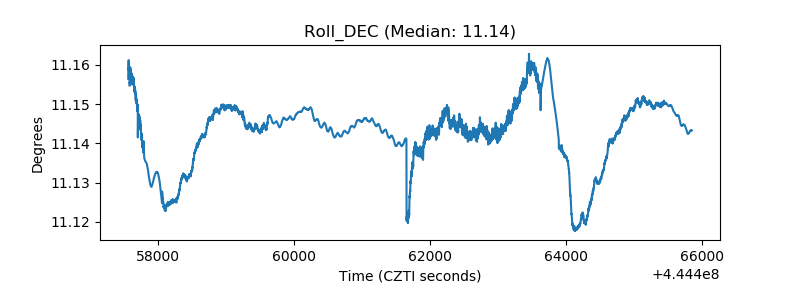 |
| _Roll_RA | 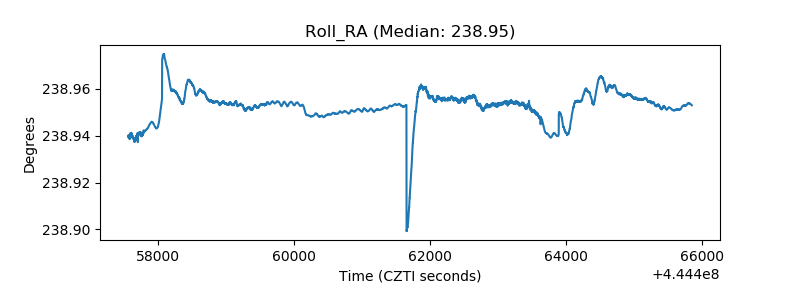 |
| Veto Counter | 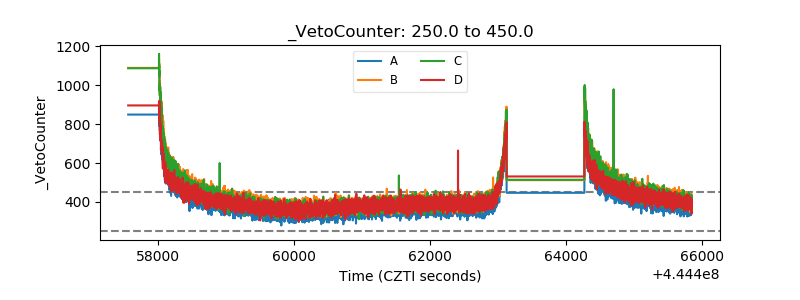 |