| Param | Original file | Final file |
|---|---|---|
| Filename | modeM0/AS1A13_017T02_9000006046_45126cztM0_level2.fits | modeM0/AS1A13_017T02_9000006046_45126cztM0_level2_quad_clean.evt |
| Size (bytes) | 542,623,680 | 111,617,280 |
| Size | 517.5 MB | 106.4 MB |
| Events in quadrant A | 7,033,943 | 681,773 |
| Events in quadrant B | 3,388,438 | 810,459 |
| Events in quadrant C | 3,111,072 | 778,957 |
| Events in quadrant D | 6,044,963 | 652,449 |
| Mode M0 | |||
|---|---|---|---|
| Quadrant | BADHDUFLAG | Total packets | Discarded packets |
| A | 0 | 25466 | 2 |
| B | 0 | 14333 | 2 |
| C | 0 | 13659 | 2 |
| D | 0 | 22412 | 2 |
| Mode M9 | |||
|---|---|---|---|
| Quadrant | BADHDUFLAG | Total packets | Discarded packets |
| A | 0 | 15 | 0 |
| B | 0 | 16 | 0 |
| C | 0 | 16 | 0 |
| D | 0 | 16 | 0 |
| Mode SS | |||
|---|---|---|---|
| Quadrant | BADHDUFLAG | Total packets | Discarded packets |
| A | 0 | 132 | 0 |
| B | 0 | 132 | 0 |
| C | 0 | 132 | 0 |
| D | 0 | 132 | 0 |
| Quadrant | Total seconds | Saturated seconds | Saturation percentage |
|---|---|---|---|
| A | 6545 | 998 | 15.248281% |
| B | 6545 | 85 | 1.298701% |
| C | 6545 | 38 | 0.580596% |
| D | 6545 | 677 | 10.343774% |
Noise dominated data is calculated using 1-second bins in cleaned event files. If a bin has >2000 counts, and if more than 50% of those come from <1% of pixels, then it is considered to be noise-dominated and hence unusable.
| Quadrant | # 1 sec bins | Bins with >0 counts | Bins with >2000 counts | High rate bins dominated by noise | Noise dominated (total time) | Noise dominated (detector-on time) | Marked lightcurve |
|---|---|---|---|---|---|---|---|
| A | 7725 | 6545 | 509 | 509 | 6.59% | 7.78% | 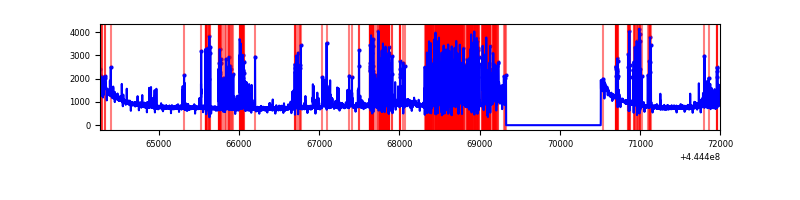 |
| B | 7725 | 6546 | 5 | 5 | 0.06% | 0.08% | 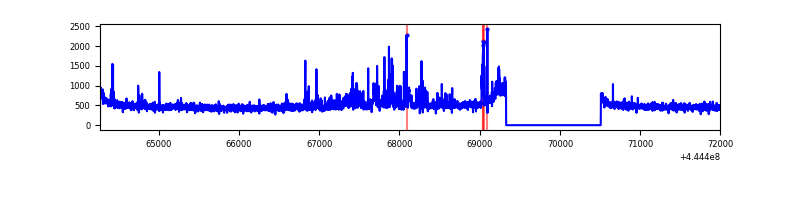 |
| C | 7725 | 6546 | 6 | 6 | 0.08% | 0.09% | 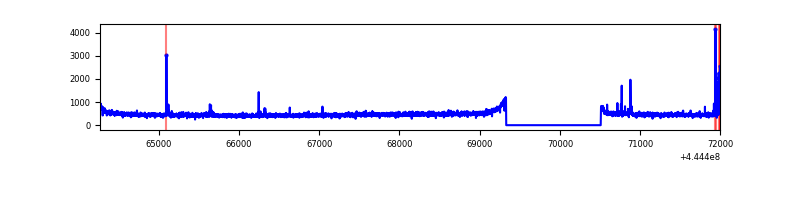 |
| D | 7725 | 6546 | 555 | 555 | 7.18% | 8.48% | 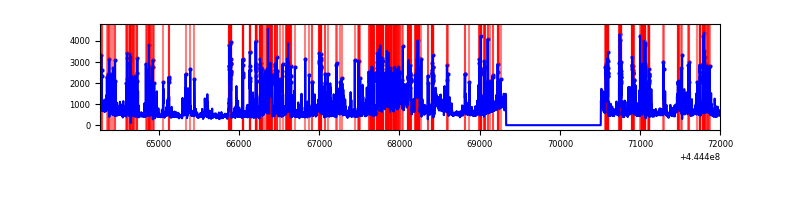 |
Top three noisy pixels from each quadrant. If the there are fewer than three noisy pixels in the level2.evt file, extra rows are filled as -1
| Pixel properties | Quadrant properties | ||||||
|---|---|---|---|---|---|---|---|
| Quadrant | DetID | PixID | Counts | Sigma | Mean | Median | Sigma |
| A | 10 | 83 | 2373189 | 15922.32 | 727 | 713 | 149.0 |
| A | 15 | 223 | 1807952 | 12128.86 | 727 | 713 | 149.0 |
| A | 13 | 248 | 35550 | 233.8 | 727 | 713 | 149.0 |
| B | 0 | 183 | 83238 | 535.0 | 786 | 762 | 154.2 |
| B | 0 | 155 | 67107 | 430.36 | 786 | 762 | 154.2 |
| B | 3 | 112 | 61380 | 393.21 | 786 | 762 | 154.2 |
| C | 14 | 254 | 59378 | 323.39 | 774 | 781 | 181.2 |
| C | 2 | 14 | 14447 | 75.42 | 774 | 781 | 181.2 |
| C | 5 | 4 | 12331 | 63.74 | 774 | 781 | 181.2 |
| D | 13 | 249 | 1064485 | 5749.5 | 744 | 724 | 185.0 |
| D | 13 | 29 | 690943 | 3730.55 | 744 | 724 | 185.0 |
| D | 9 | 49 | 375945 | 2028.02 | 744 | 724 | 185.0 |
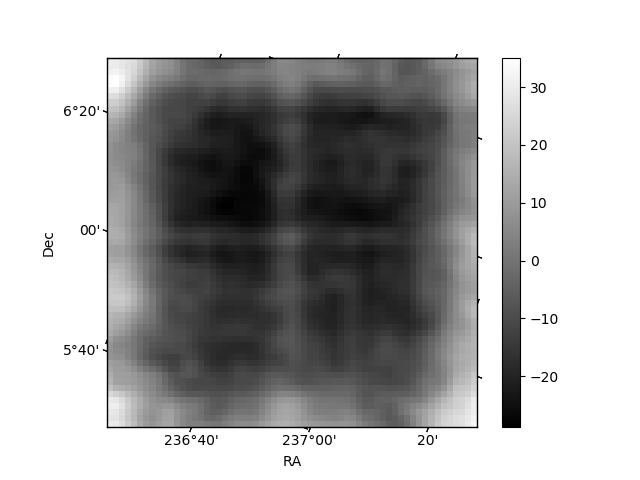
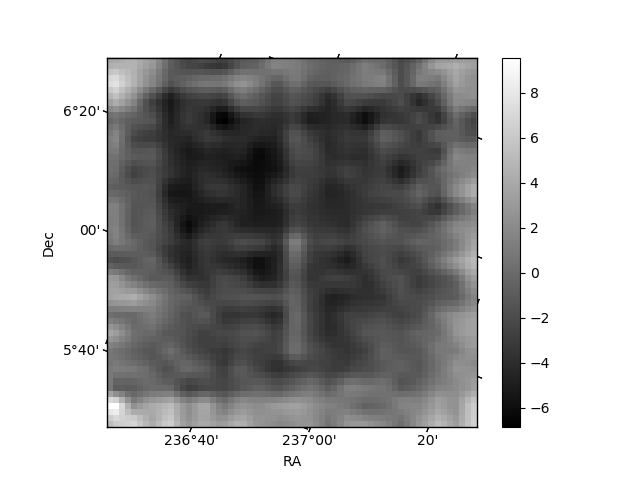
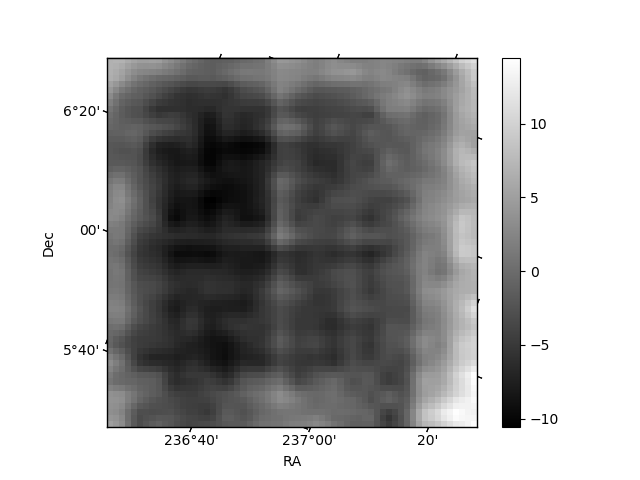
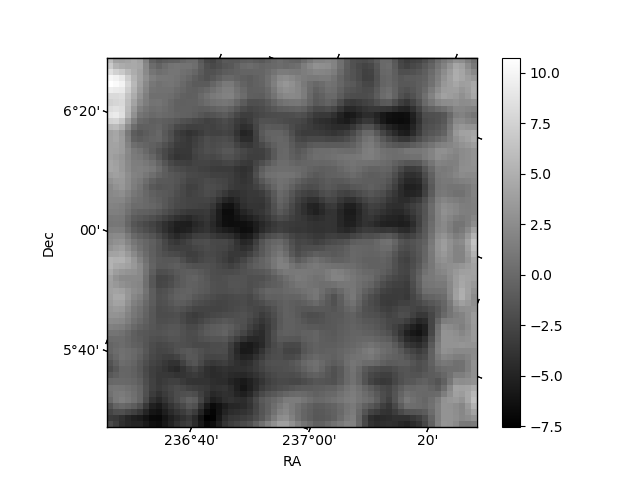
Histogram calculated using DETX and DETY for each event in the final _common_clean file
| Quadrant A | 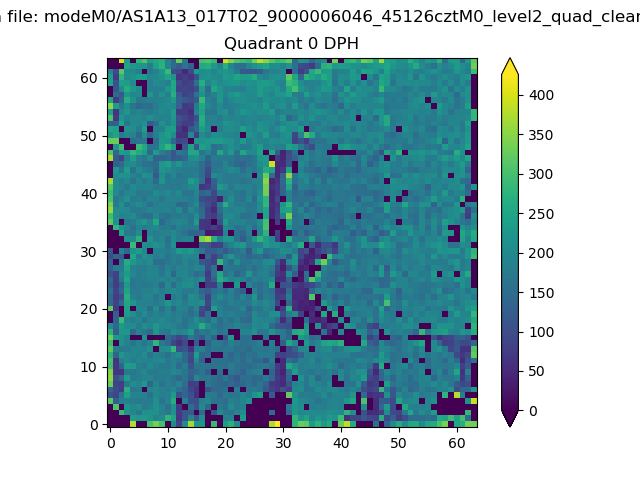 |
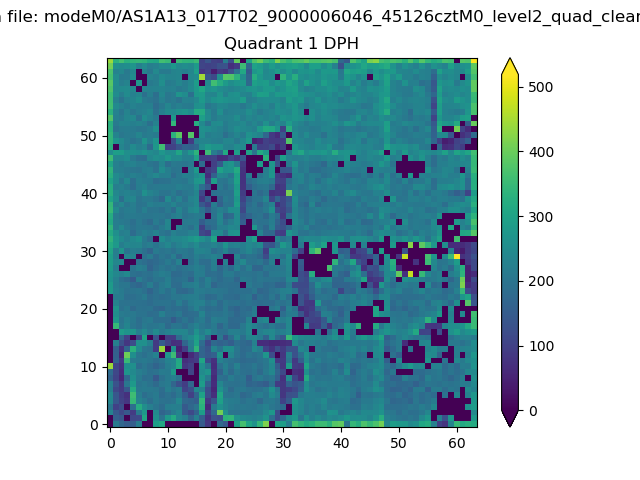 |
Quadrant B |
|---|---|---|---|
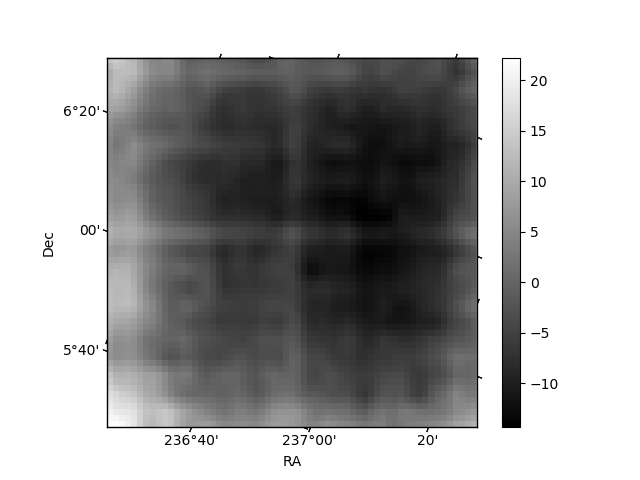
| Quadrant D | 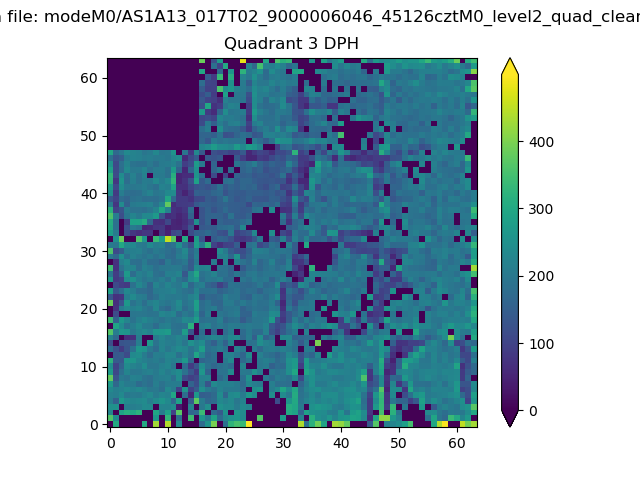 |
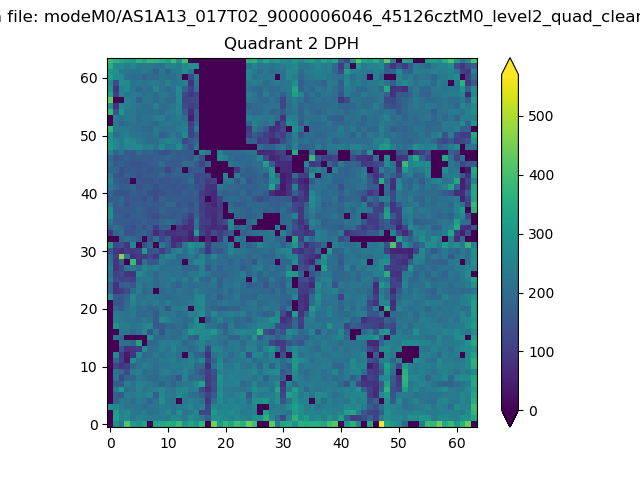 |
Quadrant C |
| Plot type | Count rate plots | Images |
|---|---|---|
| Comparison with Poisson distribution Blue bars denote a histogram of data divided into 1 sec bins. Red curve is a Poisson curve with rate = median count rate of data. |
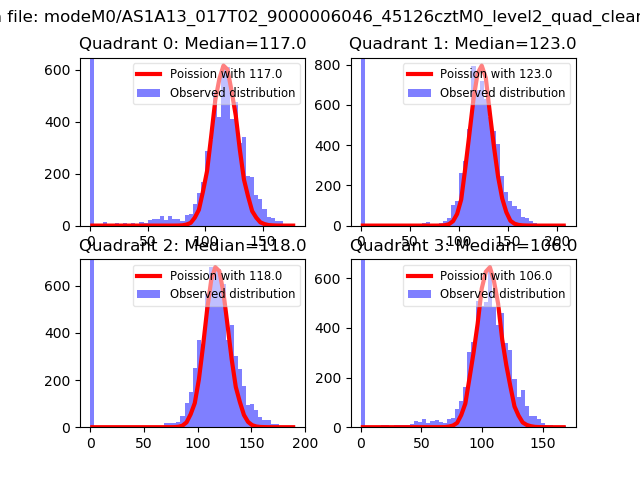 |
 |
| Quadrant-wise count rates Data is divided into 100 sec bins |
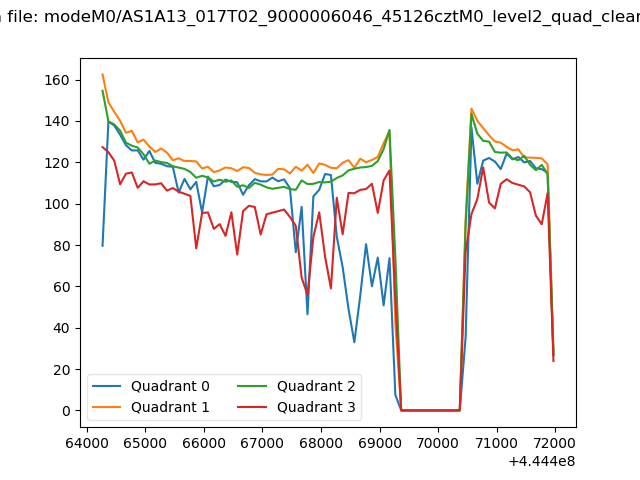 |
|
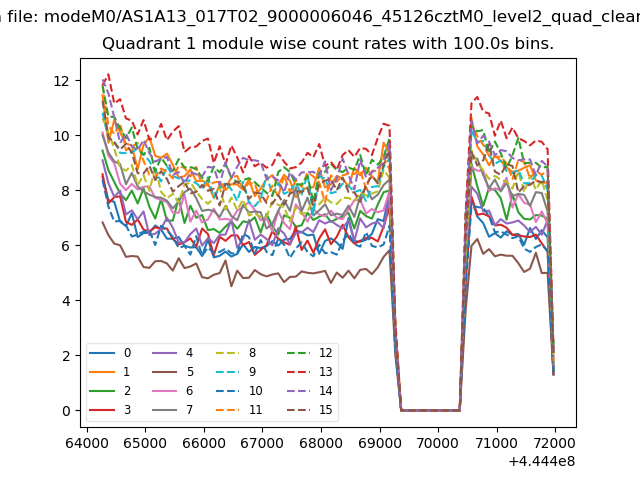
| Module-wise count rates for Quadrant A Data is divided into 100 sec bins |
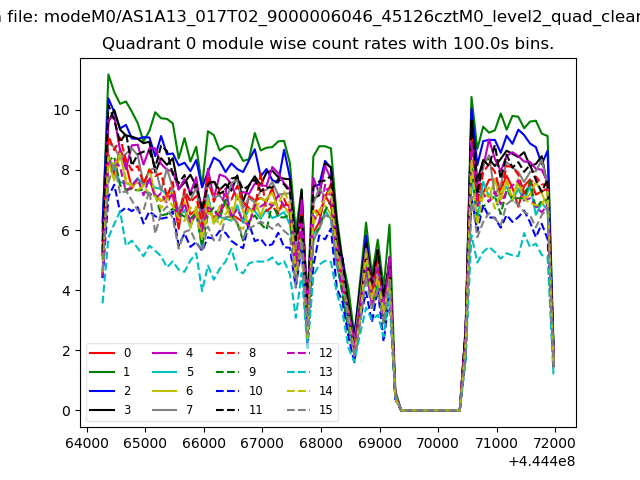 |
 |
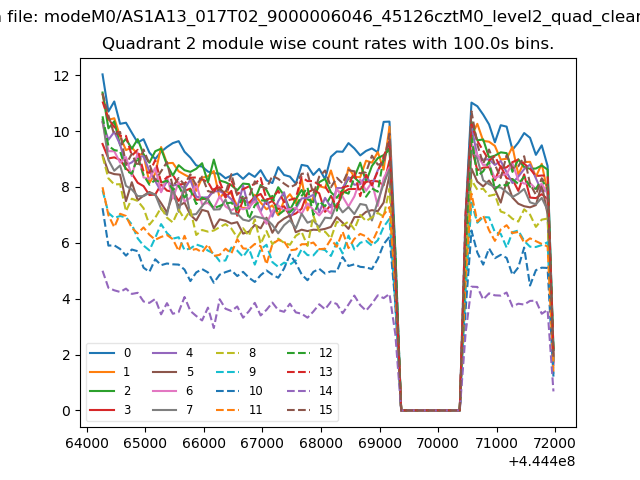
| Module-wise count rates for Quadrant B Data is divided into 100 sec bins |
 |
 |
| Module-wise count rates for Quadrant C Data is divided into 100 sec bins |
 |
 |
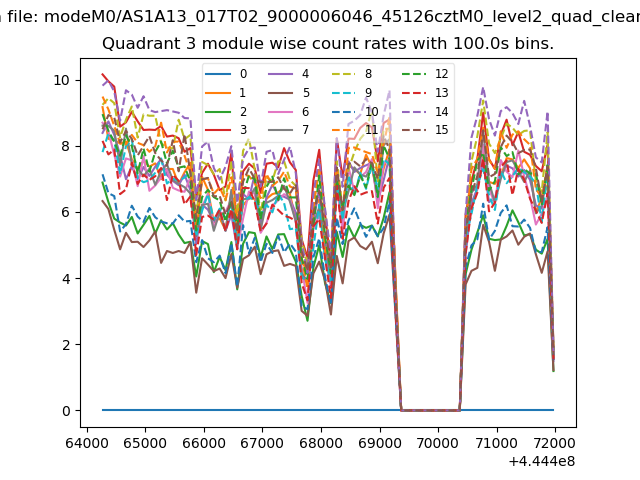
| Module-wise count rates for Quadrant D Data is divided into 100 sec bins |
 |
 |
| Parameter | Plot |
|---|---|
| CZT HV Monitor | 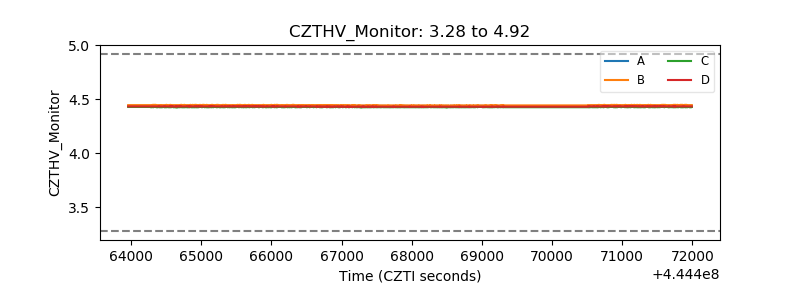 |
| D_VDD | 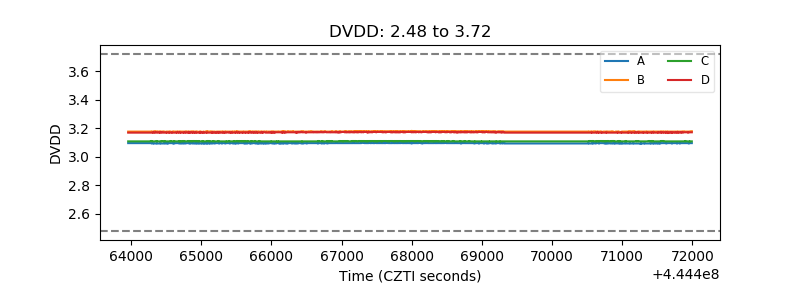 |
| Temperature 1 | 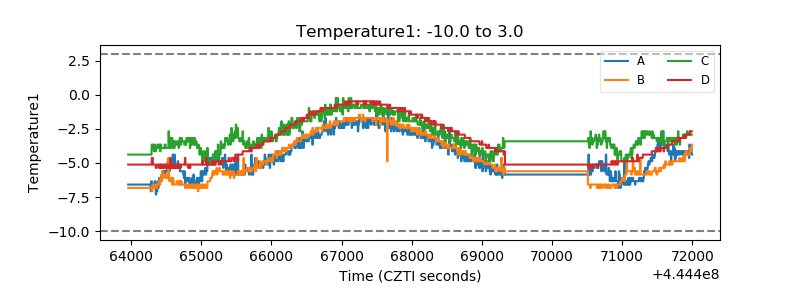 |
| Veto HV Monitor | 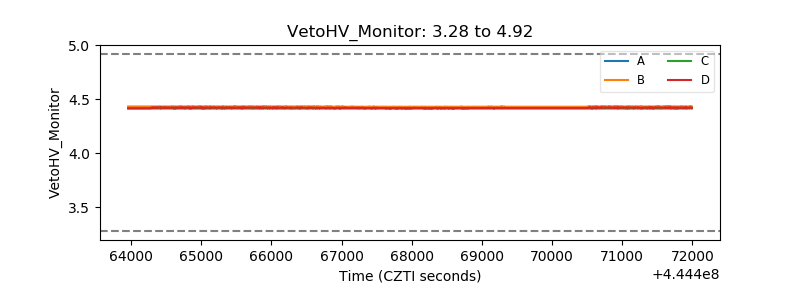 |
| Veto LLD | 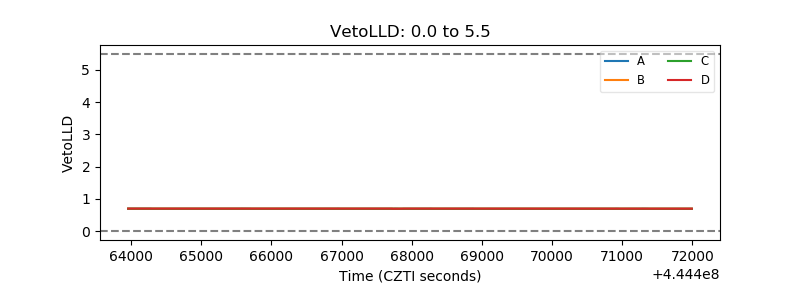 |
| Alpha Counter | 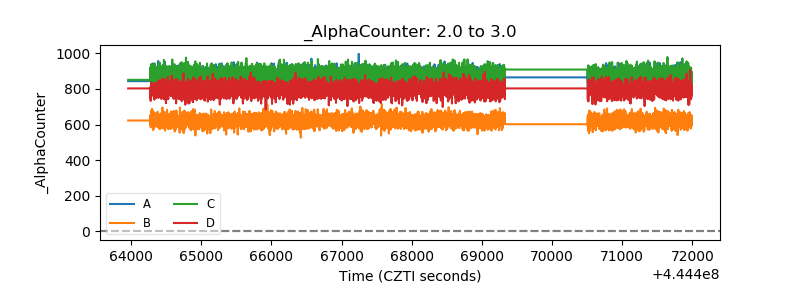 |
| _CPM_Rate | 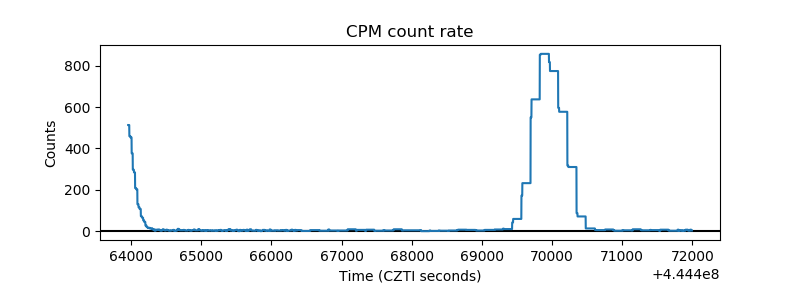 |
| CZT Counter | 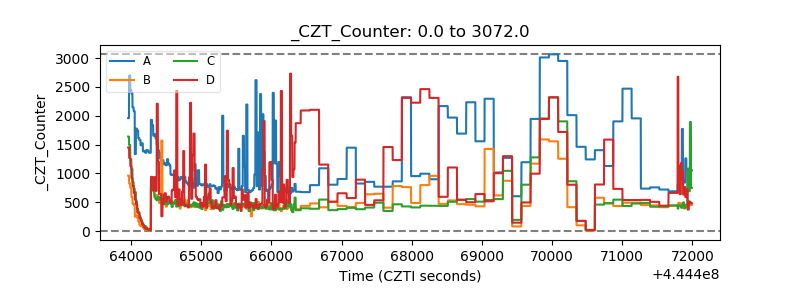 |
| +2.5 Volts monitor | 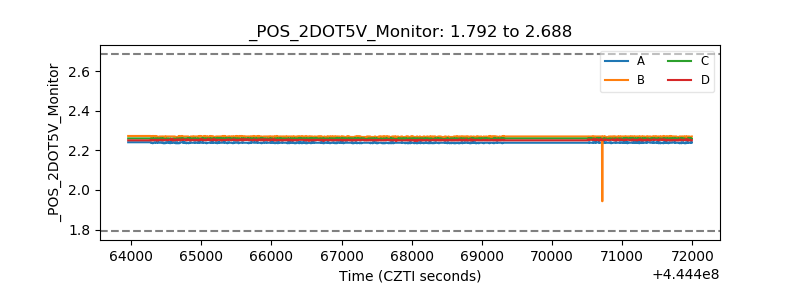 |
| +5 Volts monitor | 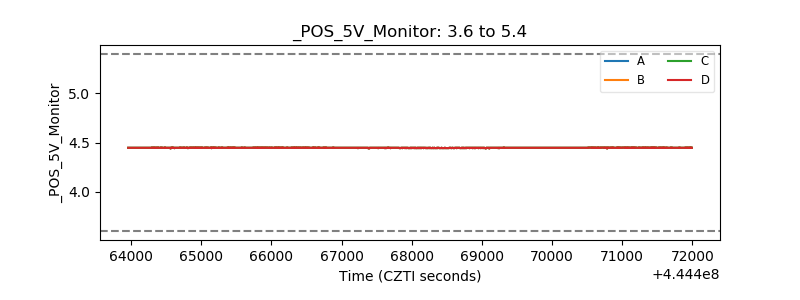 |
| _ROLL_ROT | 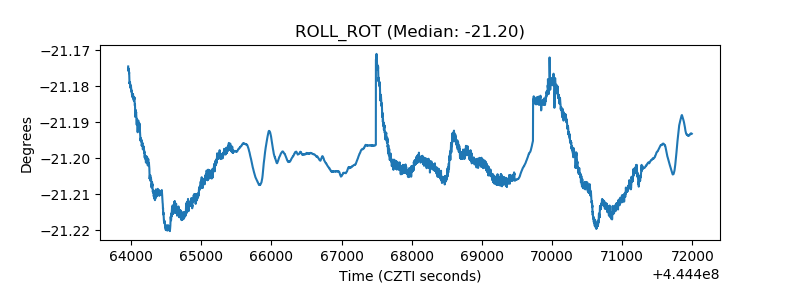 |
| _Roll_DEC | 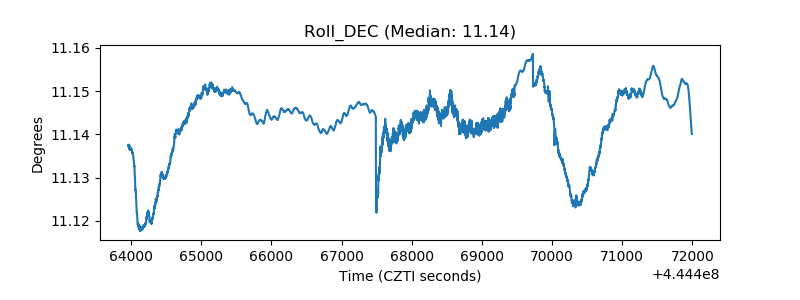 |
| _Roll_RA | 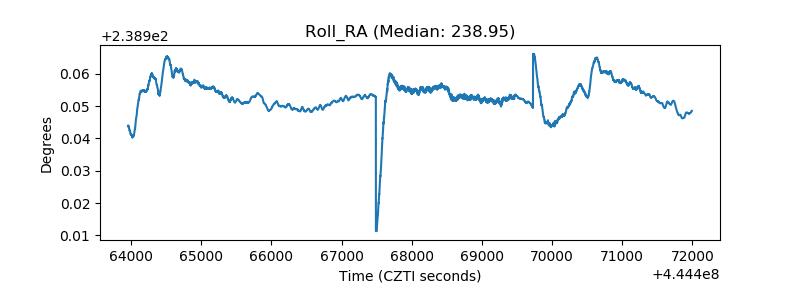 |
| Veto Counter | 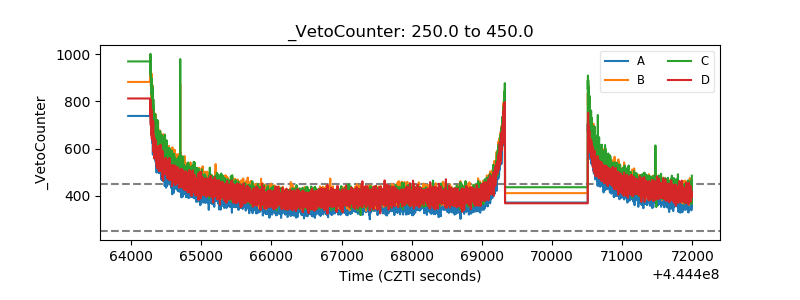 |