| Param | Original file | Final file |
|---|---|---|
| Filename | modeM0/AS1A13_017T02_9000006046_45128cztM0_level2.fits | modeM0/AS1A13_017T02_9000006046_45128cztM0_level2_quad_clean.evt |
| Size (bytes) | 557,124,480 | 101,992,320 |
| Size | 531.3 MB | 97.3 MB |
| Events in quadrant A | 7,520,905 | 598,303 |
| Events in quadrant B | 3,455,164 | 735,038 |
| Events in quadrant C | 3,068,699 | 715,969 |
| Events in quadrant D | 6,079,888 | 591,136 |
| Mode M0 | |||
|---|---|---|---|
| Quadrant | BADHDUFLAG | Total packets | Discarded packets |
| A | 0 | 26718 | 4 |
| B | 0 | 14399 | 1 |
| C | 0 | 13443 | 1 |
| D | 0 | 22444 | 1 |
| Mode M9 | |||
|---|---|---|---|
| Quadrant | BADHDUFLAG | Total packets | Discarded packets |
| A | 0 | 9 | 0 |
| B | 0 | 9 | 0 |
| C | 0 | 9 | 0 |
| D | 0 | 9 | 0 |
| Mode SS | |||
|---|---|---|---|
| Quadrant | BADHDUFLAG | Total packets | Discarded packets |
| A | 0 | 130 | 0 |
| B | 0 | 130 | 0 |
| C | 0 | 130 | 0 |
| D | 0 | 130 | 0 |
| Quadrant | Total seconds | Saturated seconds | Saturation percentage |
|---|---|---|---|
| A | 6421 | 1213 | 18.891138% |
| B | 6421 | 215 | 3.348388% |
| C | 6421 | 104 | 1.619685% |
| D | 6421 | 817 | 12.723875% |
Noise dominated data is calculated using 1-second bins in cleaned event files. If a bin has >2000 counts, and if more than 50% of those come from <1% of pixels, then it is considered to be noise-dominated and hence unusable.
| Quadrant | # 1 sec bins | Bins with >0 counts | Bins with >2000 counts | High rate bins dominated by noise | Noise dominated (total time) | Noise dominated (detector-on time) | Marked lightcurve |
|---|---|---|---|---|---|---|---|
| A | 7341 | 6422 | 822 | 822 | 11.20% | 12.80% | 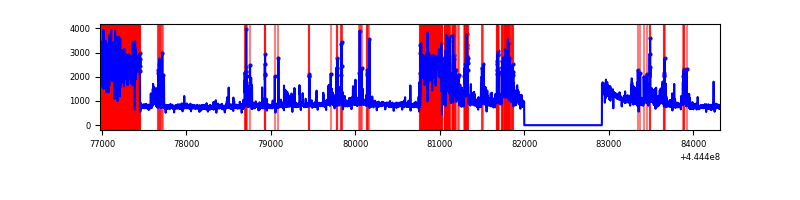 |
| B | 7341 | 6421 | 53 | 53 | 0.72% | 0.83% | 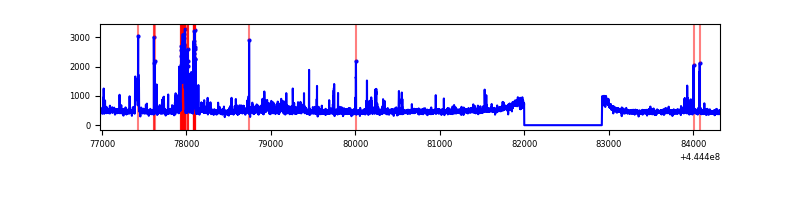 |
| C | 7341 | 6422 | 3 | 3 | 0.04% | 0.05% | 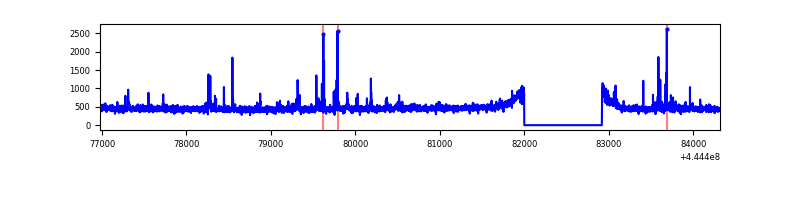 |
| D | 7341 | 6422 | 595 | 595 | 8.11% | 9.27% | 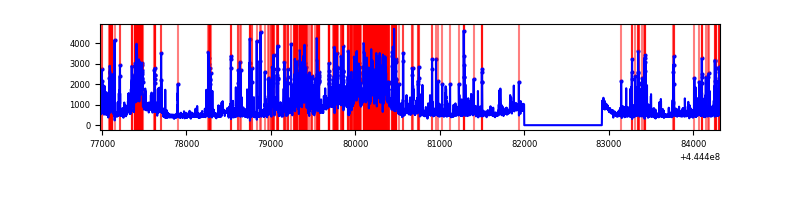 |
Top three noisy pixels from each quadrant. If the there are fewer than three noisy pixels in the level2.evt file, extra rows are filled as -1
| Pixel properties | Quadrant properties | ||||||
|---|---|---|---|---|---|---|---|
| Quadrant | DetID | PixID | Counts | Sigma | Mean | Median | Sigma |
| A | 15 | 223 | 2699870 | 18758.26 | 691 | 674 | 143.9 |
| A | 10 | 83 | 2134926 | 14832.14 | 691 | 674 | 143.9 |
| A | 0 | 243 | 13420 | 88.58 | 691 | 674 | 143.9 |
| B | 12 | 16 | 191007 | 1273.07 | 752 | 731 | 149.5 |
| B | 0 | 155 | 68131 | 450.95 | 752 | 731 | 149.5 |
| B | 3 | 112 | 52288 | 344.95 | 752 | 731 | 149.5 |
| C | 14 | 254 | 91941 | 514.64 | 752 | 755 | 177.2 |
| C | 2 | 14 | 16620 | 89.54 | 752 | 755 | 177.2 |
| C | 3 | 233 | 12270 | 64.99 | 752 | 755 | 177.2 |
| D | 13 | 29 | 966404 | 5325.12 | 724 | 703 | 181.3 |
| D | 13 | 249 | 628520 | 3461.94 | 724 | 703 | 181.3 |
| D | 2 | 253 | 380814 | 2096.03 | 724 | 703 | 181.3 |
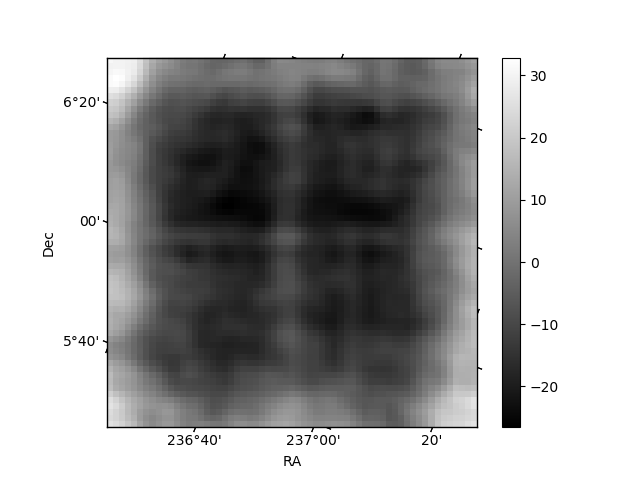
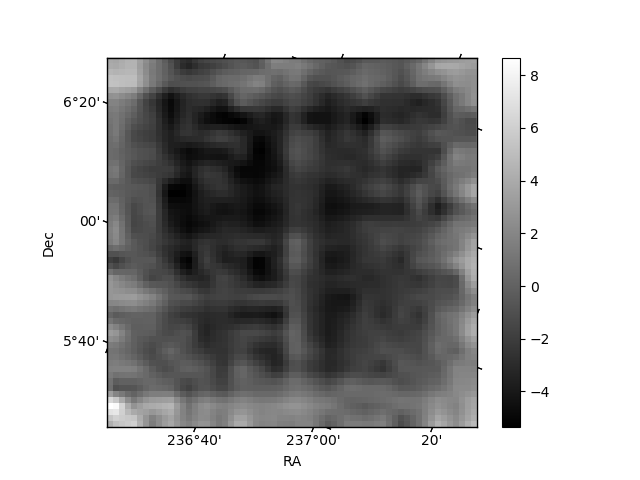
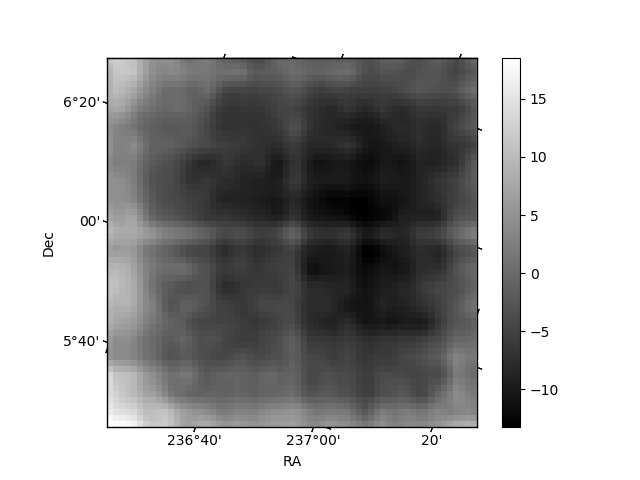
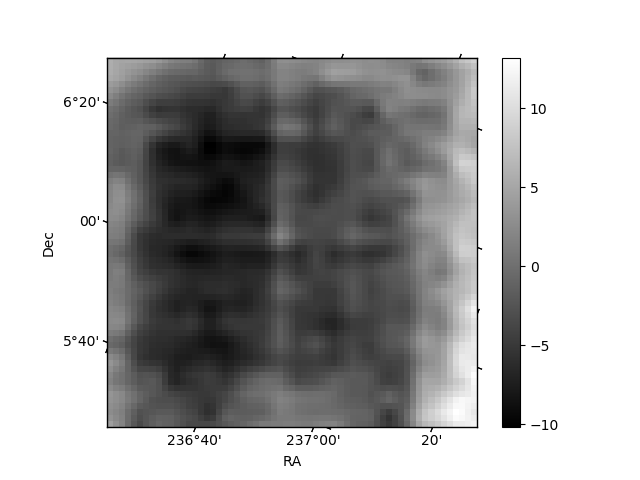
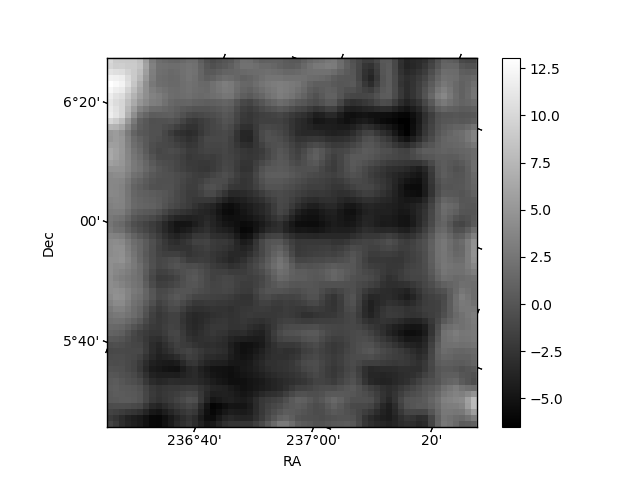
Histogram calculated using DETX and DETY for each event in the final _common_clean file
| Quadrant A | 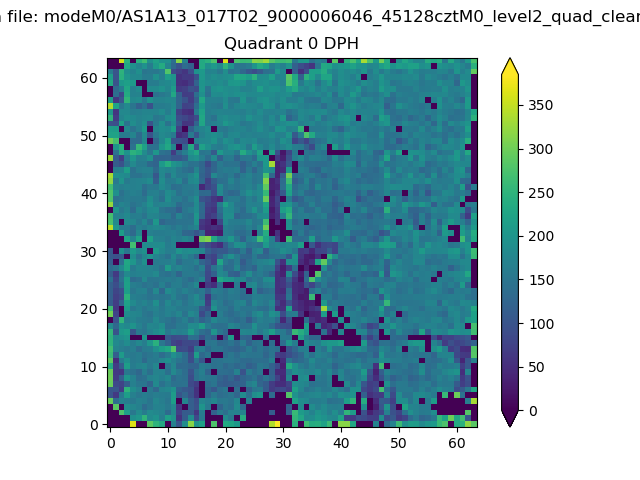 |
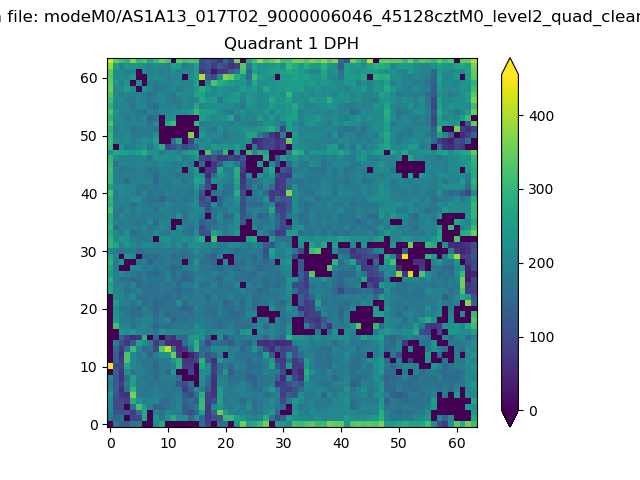 |
Quadrant B |
|---|---|---|---|
| Quadrant D | 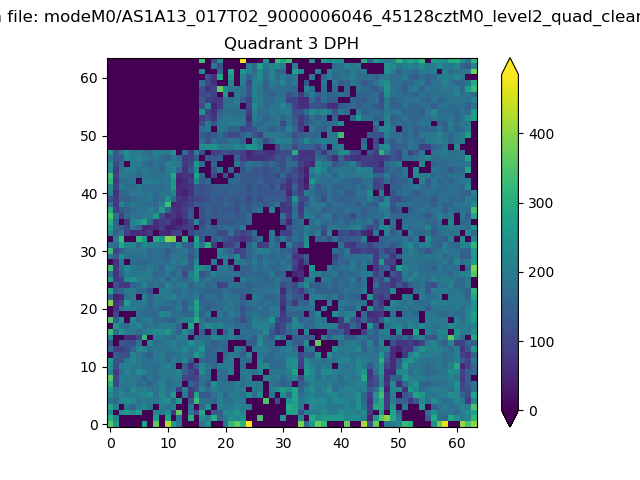 |
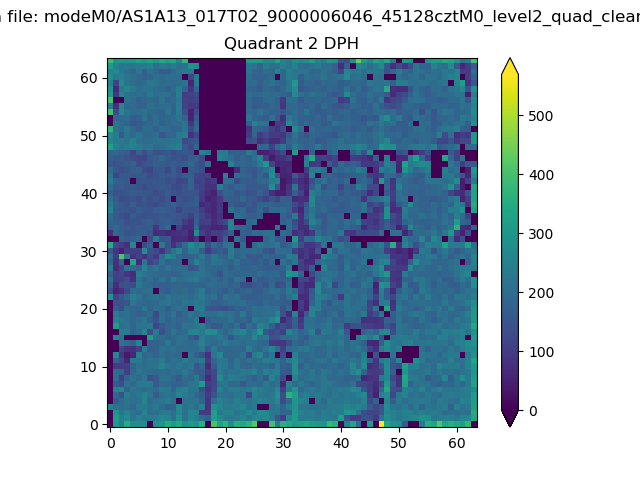 |
Quadrant C |
| Plot type | Count rate plots | Images |
|---|---|---|
| Comparison with Poisson distribution Blue bars denote a histogram of data divided into 1 sec bins. Red curve is a Poisson curve with rate = median count rate of data. |
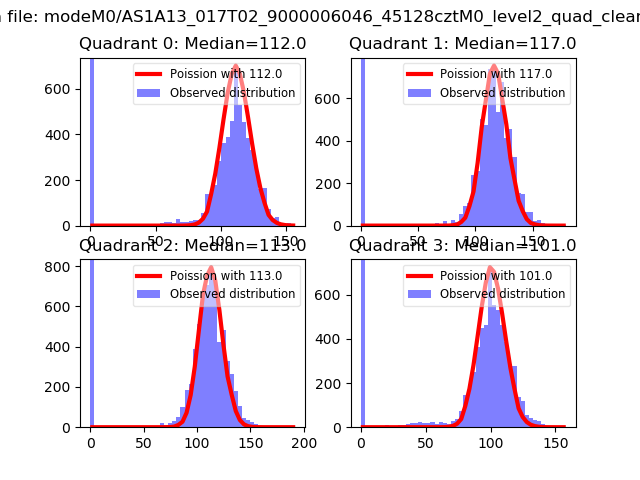 |
 |
| Quadrant-wise count rates Data is divided into 100 sec bins |
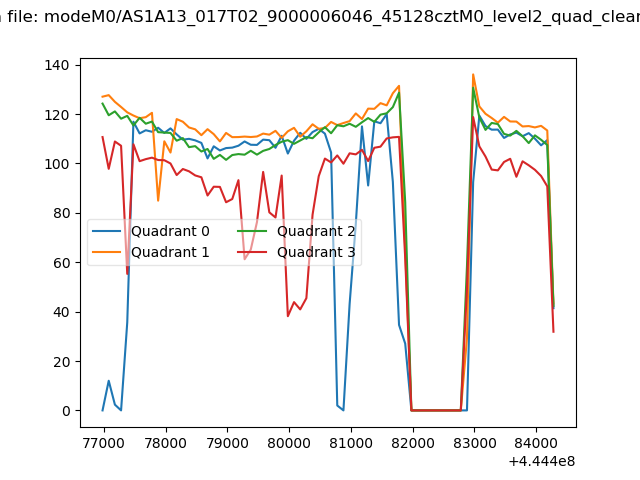 |
|
| Module-wise count rates for Quadrant A Data is divided into 100 sec bins |
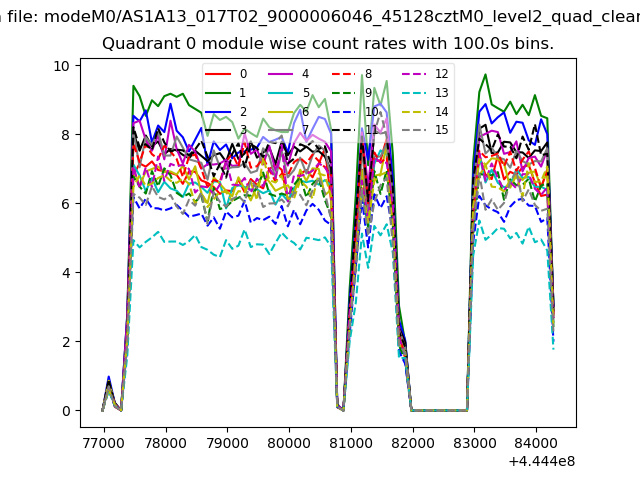 |
 |
| Module-wise count rates for Quadrant B Data is divided into 100 sec bins |
 |
 |
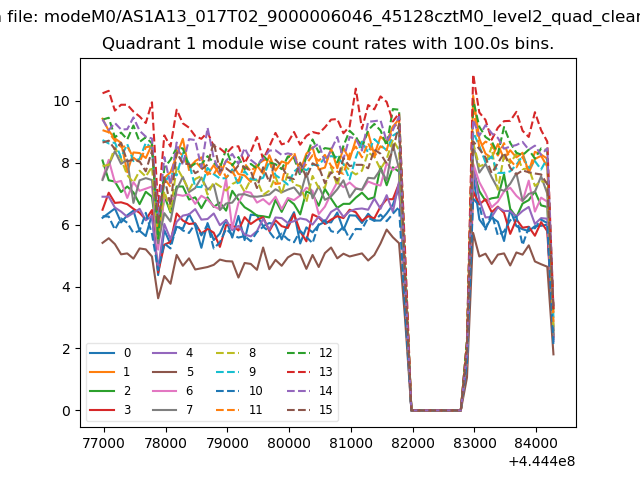
| Module-wise count rates for Quadrant C Data is divided into 100 sec bins |
 |
 |
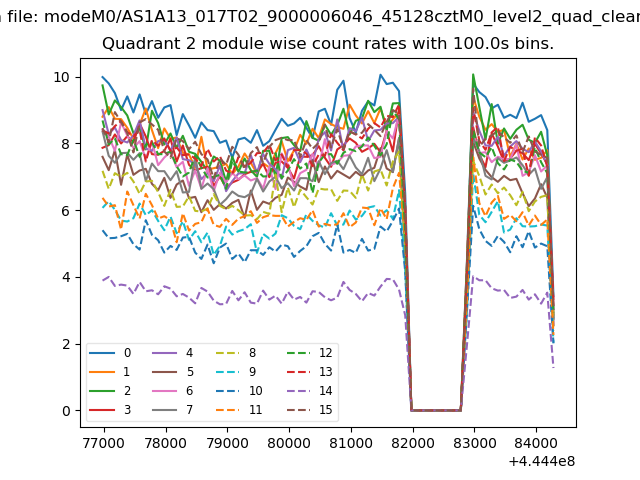
| Module-wise count rates for Quadrant D Data is divided into 100 sec bins |
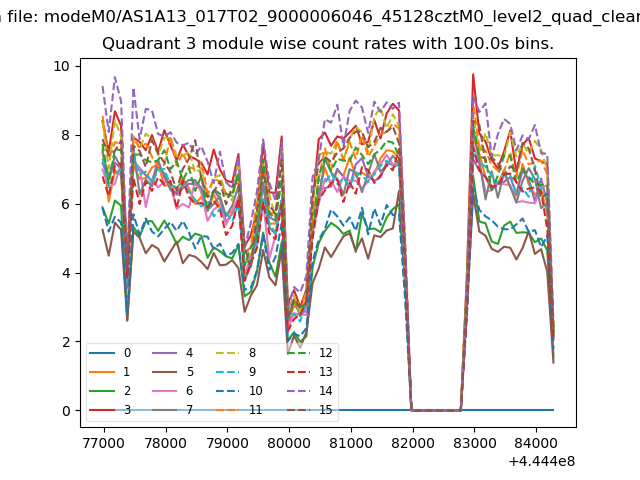 |
 |
| Parameter | Plot |
|---|---|
| CZT HV Monitor | 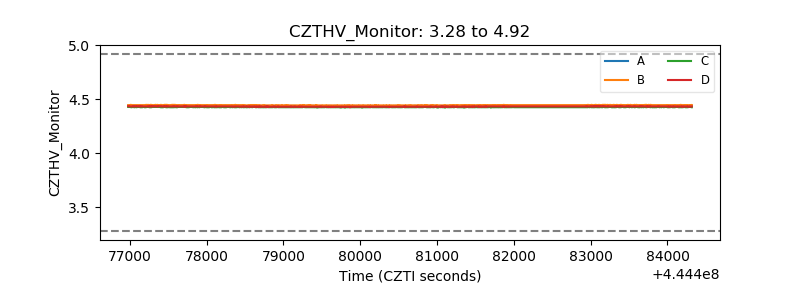 |
| D_VDD | 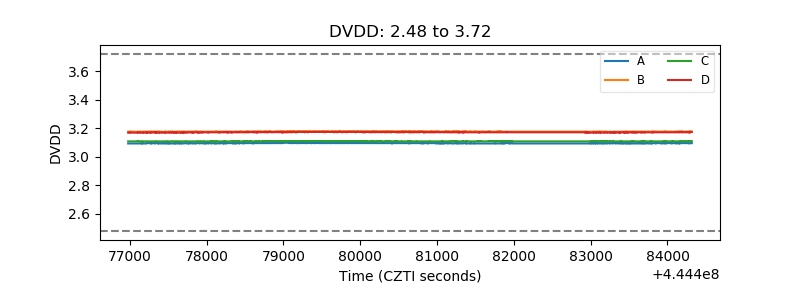 |
| Temperature 1 | 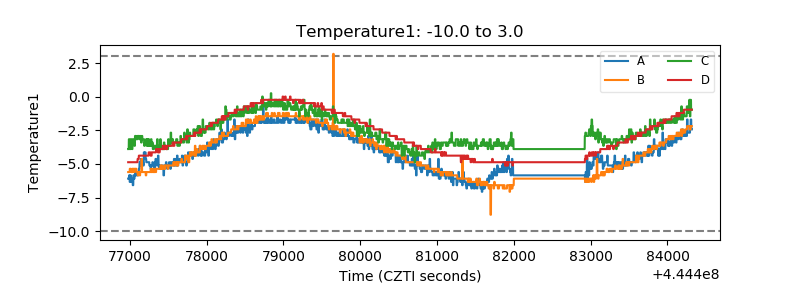 |
| Veto HV Monitor | 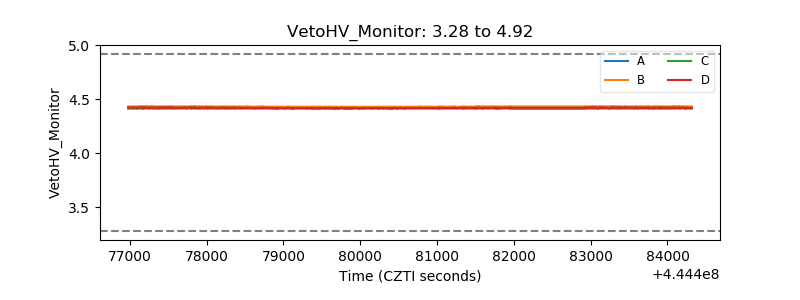 |
| Veto LLD | 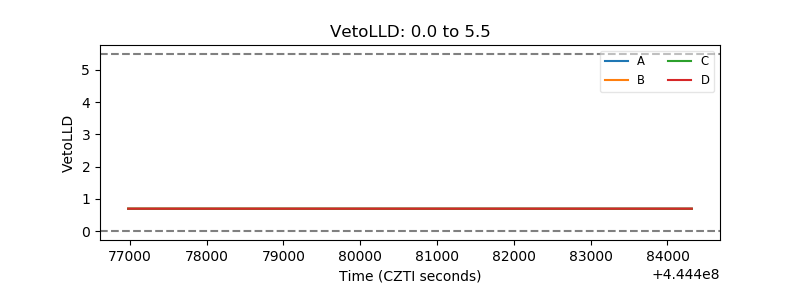 |
| Alpha Counter | 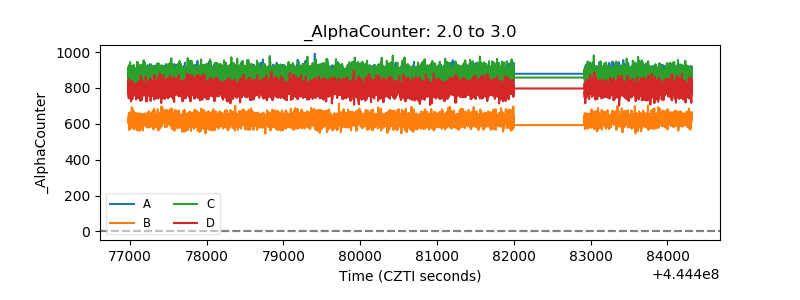 |
| _CPM_Rate | 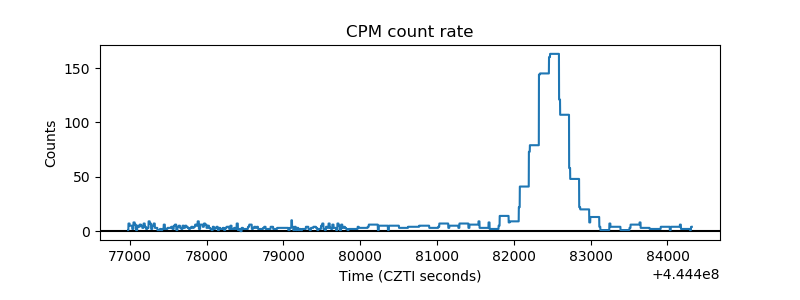 |
| CZT Counter | 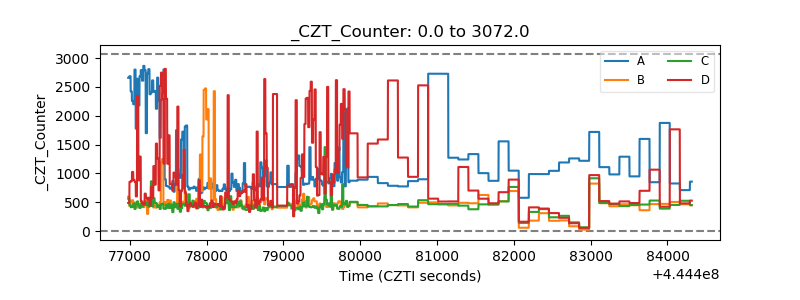 |
| +2.5 Volts monitor | 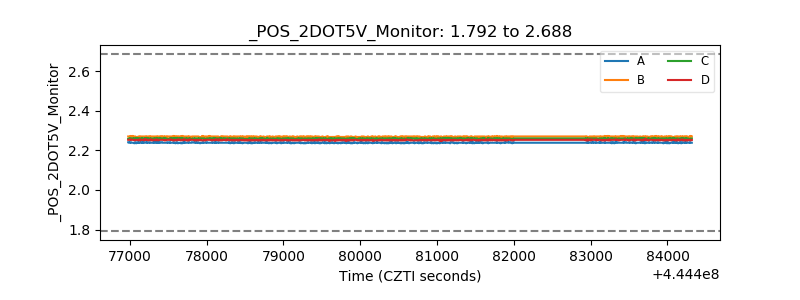 |
| +5 Volts monitor | 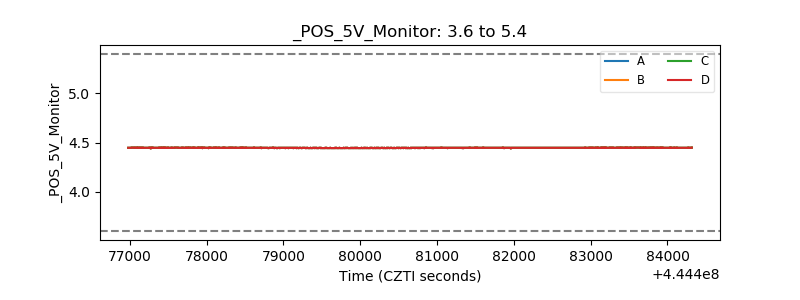 |
| _ROLL_ROT | 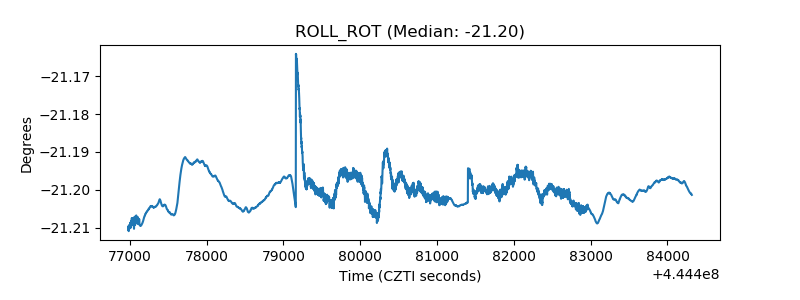 |
| _Roll_DEC | 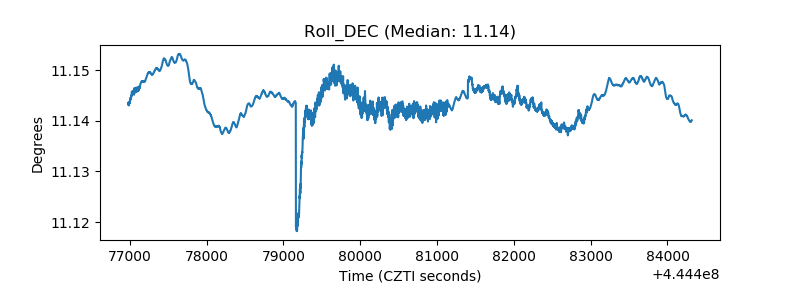 |
| _Roll_RA | 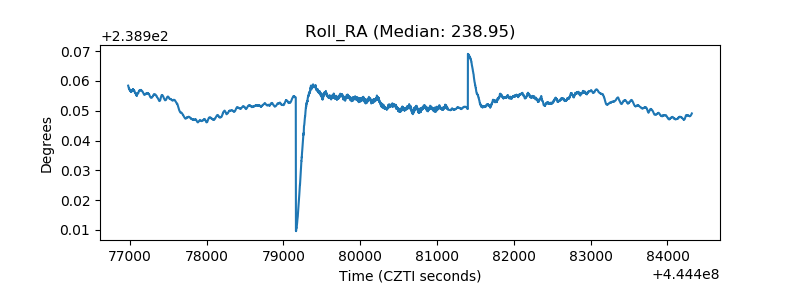 |
| Veto Counter | 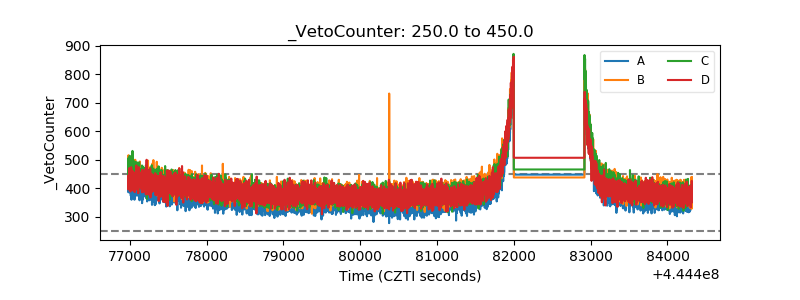 |