| Param | Original file | Final file |
|---|---|---|
| Filename | modeM0/AS1A13_017T02_9000006046_45129cztM0_level2.fits | modeM0/AS1A13_017T02_9000006046_45129cztM0_level2_quad_clean.evt |
| Size (bytes) | 631,523,520 | 98,418,240 |
| Size | 602.3 MB | 93.9 MB |
| Events in quadrant A | 10,268,260 | 388,683 |
| Events in quadrant B | 3,612,446 | 750,790 |
| Events in quadrant C | 3,338,972 | 726,670 |
| Events in quadrant D | 5,626,402 | 638,181 |
| Mode M0 | |||
|---|---|---|---|
| Quadrant | BADHDUFLAG | Total packets | Discarded packets |
| A | 0 | 35260 | 1 |
| B | 0 | 15172 | 1 |
| C | 0 | 14655 | 2 |
| D | 0 | 21311 | 1 |
| Mode M9 | |||
|---|---|---|---|
| Quadrant | BADHDUFLAG | Total packets | Discarded packets |
| A | 0 | 6 | 0 |
| B | 0 | 6 | 0 |
| C | 0 | 6 | 0 |
| D | 0 | 6 | 0 |
| Mode SS | |||
|---|---|---|---|
| Quadrant | BADHDUFLAG | Total packets | Discarded packets |
| A | 0 | 138 | 0 |
| B | 0 | 138 | 0 |
| C | 0 | 138 | 0 |
| D | 0 | 138 | 0 |
| Quadrant | Total seconds | Saturated seconds | Saturation percentage |
|---|---|---|---|
| A | 6826 | 3523 | 51.611485% |
| B | 6826 | 231 | 3.384120% |
| C | 6826 | 189 | 2.768825% |
| D | 6826 | 499 | 7.310284% |
Noise dominated data is calculated using 1-second bins in cleaned event files. If a bin has >2000 counts, and if more than 50% of those come from <1% of pixels, then it is considered to be noise-dominated and hence unusable.
| Quadrant | # 1 sec bins | Bins with >0 counts | Bins with >2000 counts | High rate bins dominated by noise | Noise dominated (total time) | Noise dominated (detector-on time) | Marked lightcurve |
|---|---|---|---|---|---|---|---|
| A | 7426 | 6826 | 1766 | 1766 | 23.78% | 25.87% | 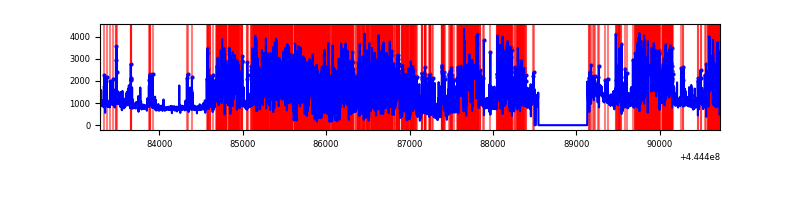 |
| B | 7426 | 6827 | 45 | 45 | 0.61% | 0.66% | 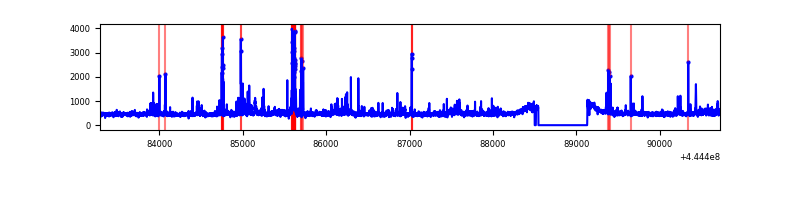 |
| C | 7426 | 6827 | 42 | 42 | 0.57% | 0.62% | 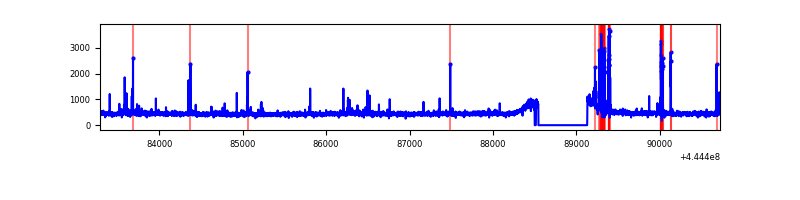 |
| D | 7426 | 6827 | 297 | 297 | 4.00% | 4.35% | 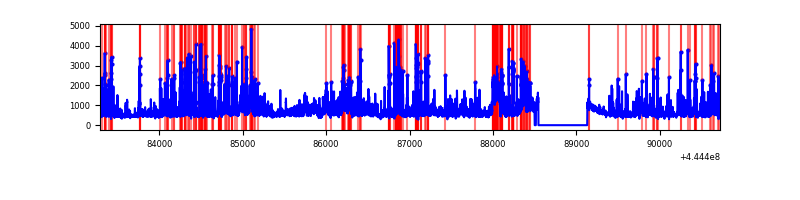 |
Top three noisy pixels from each quadrant. If the there are fewer than three noisy pixels in the level2.evt file, extra rows are filled as -1
| Pixel properties | Quadrant properties | ||||||
|---|---|---|---|---|---|---|---|
| Quadrant | DetID | PixID | Counts | Sigma | Mean | Median | Sigma |
| A | 15 | 223 | 6527213 | 57771.96 | 541 | 528 | 113.0 |
| A | 10 | 83 | 1625433 | 14383.1 | 541 | 528 | 113.0 |
| A | 0 | 243 | 10636 | 89.47 | 541 | 528 | 113.0 |
| B | 4 | 170 | 189211 | 1191.71 | 791 | 767 | 158.1 |
| B | 5 | 255 | 107241 | 673.34 | 791 | 767 | 158.1 |
| B | 0 | 155 | 67195 | 420.09 | 791 | 767 | 158.1 |
| C | 14 | 254 | 190541 | 1020.38 | 787 | 791 | 186.0 |
| C | 12 | 250 | 22363 | 116.0 | 787 | 791 | 186.0 |
| C | 1 | 3 | 20755 | 107.36 | 787 | 791 | 186.0 |
| D | 13 | 249 | 846204 | 4340.01 | 771 | 746 | 194.8 |
| D | 9 | 49 | 389994 | 1998.14 | 771 | 746 | 194.8 |
| D | 1 | 47 | 207145 | 1059.51 | 771 | 746 | 194.8 |
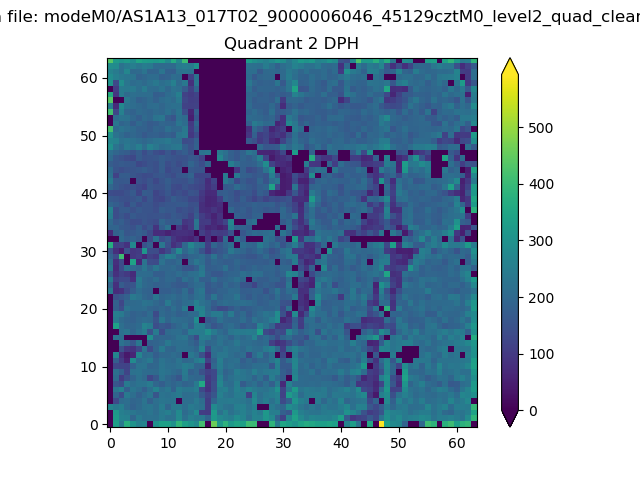
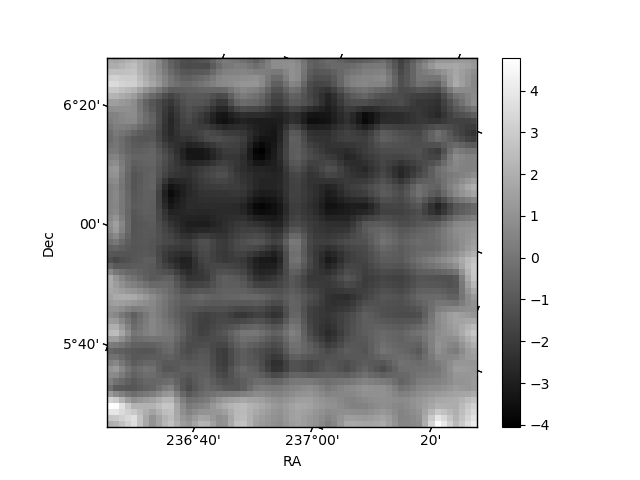
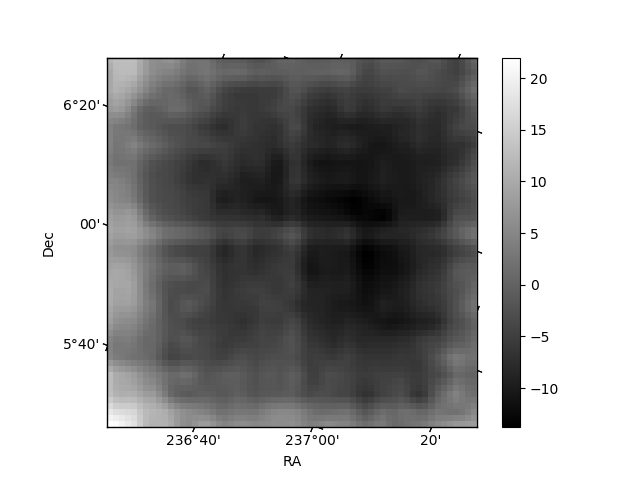
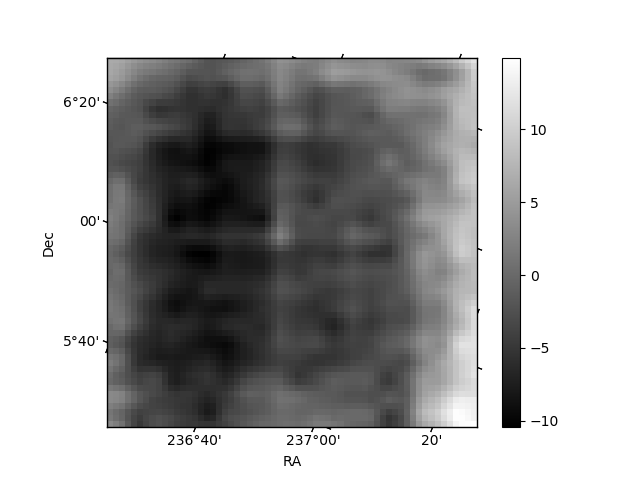
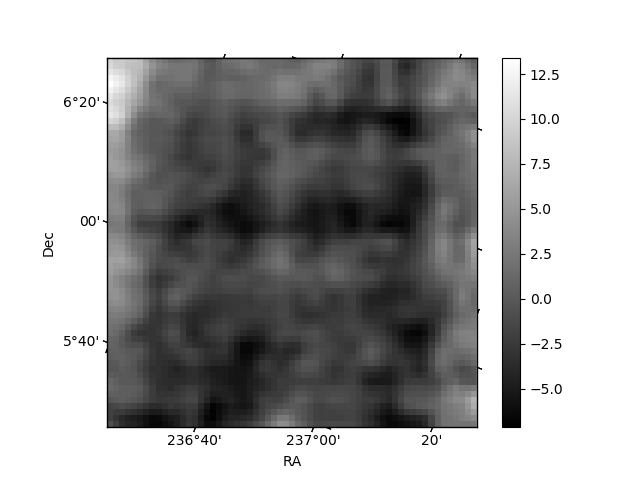
Histogram calculated using DETX and DETY for each event in the final _common_clean file
| Quadrant A | 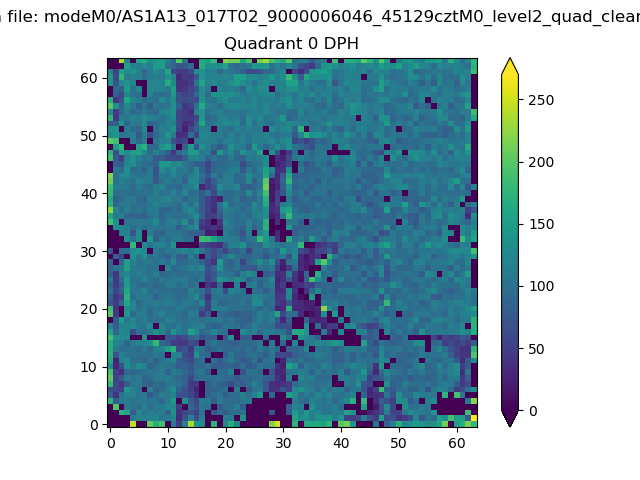 |
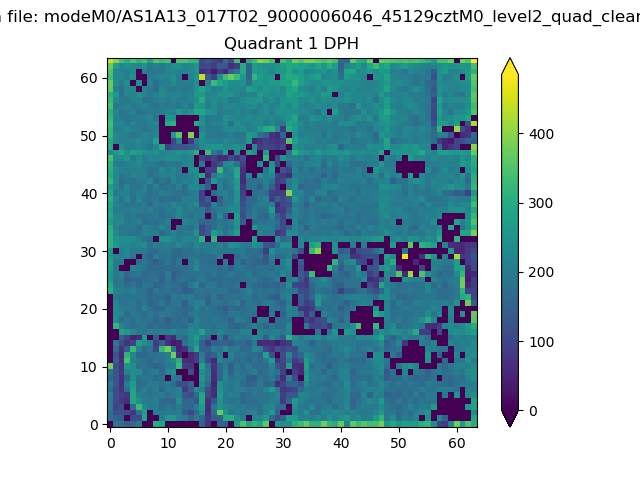 |
Quadrant B |
|---|---|---|---|
| Quadrant D | 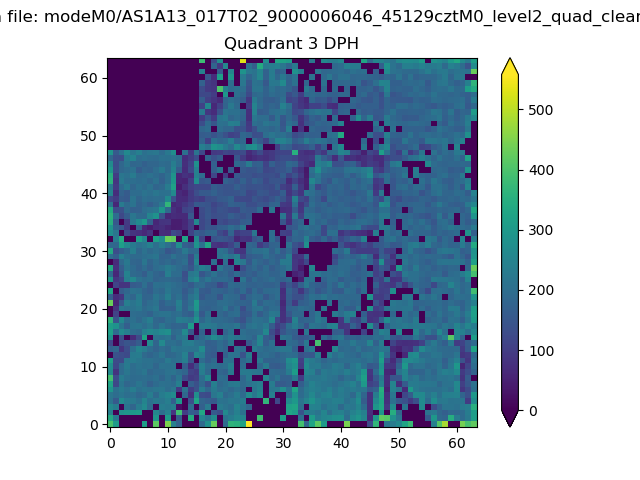 |
 |
Quadrant C |
| Plot type | Count rate plots | Images |
|---|---|---|
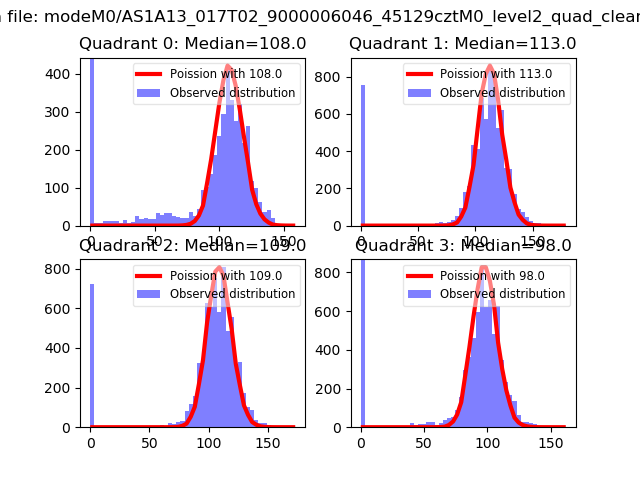
| Comparison with Poisson distribution Blue bars denote a histogram of data divided into 1 sec bins. Red curve is a Poisson curve with rate = median count rate of data. |
 |
 |
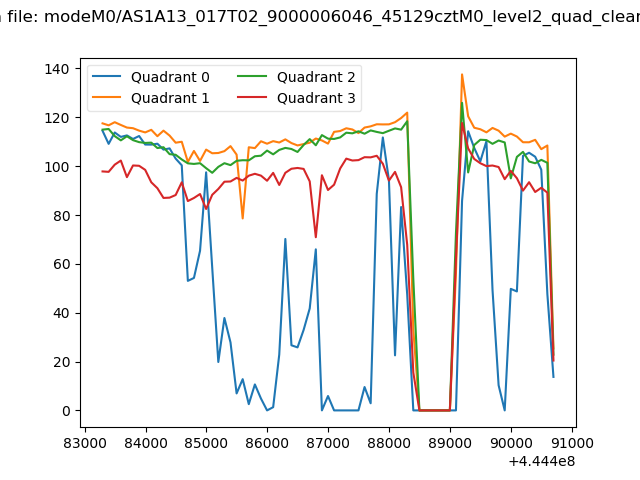
| Quadrant-wise count rates Data is divided into 100 sec bins |
 |
|
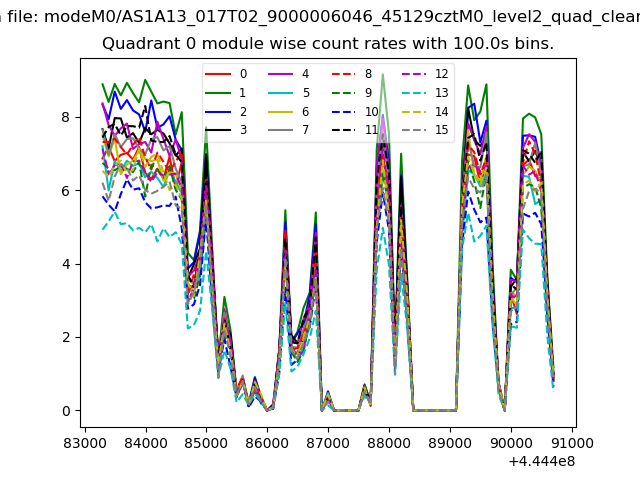
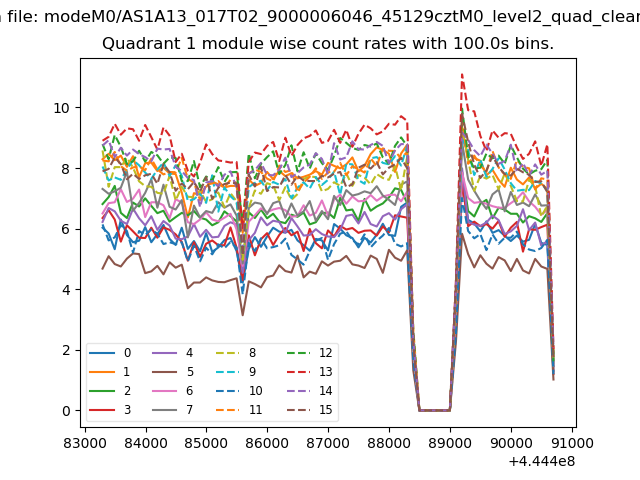
| Module-wise count rates for Quadrant A Data is divided into 100 sec bins |
 |
 |
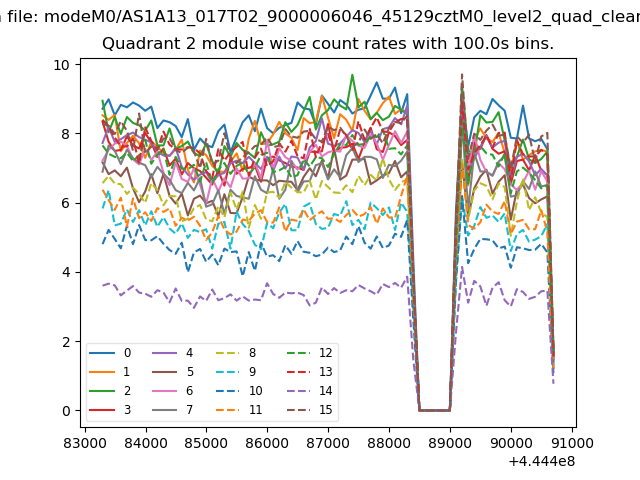
| Module-wise count rates for Quadrant B Data is divided into 100 sec bins |
 |
 |
| Module-wise count rates for Quadrant C Data is divided into 100 sec bins |
 |
 |
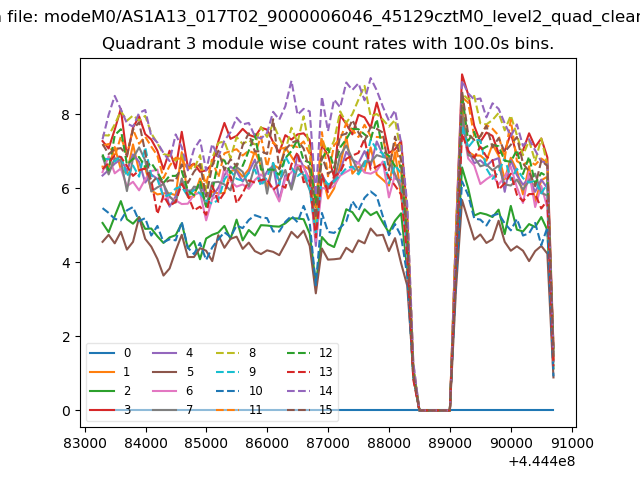
| Module-wise count rates for Quadrant D Data is divided into 100 sec bins |
 |
 |
| Parameter | Plot |
|---|---|
| CZT HV Monitor | 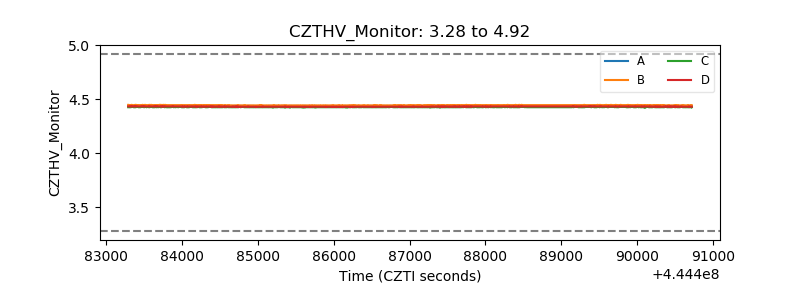 |
| D_VDD | 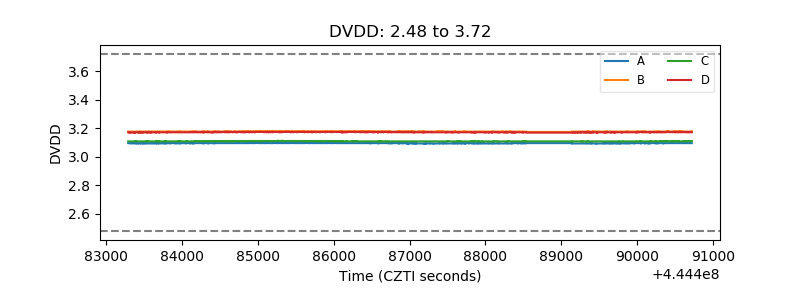 |
| Temperature 1 | 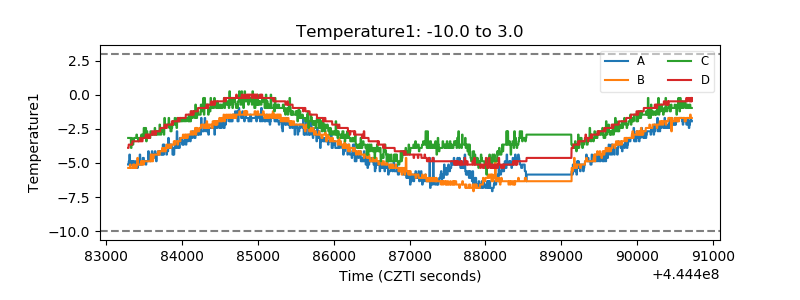 |
| Veto HV Monitor | 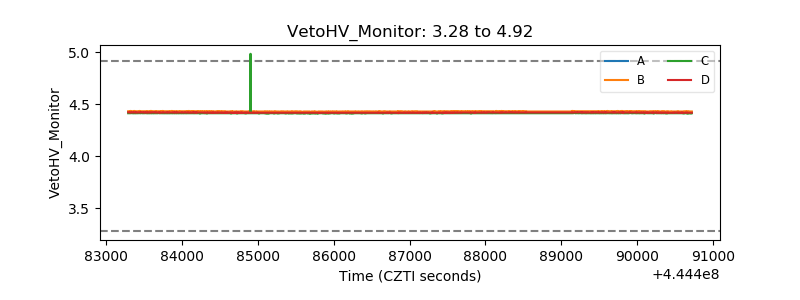 |
| Veto LLD |  |
| Alpha Counter | 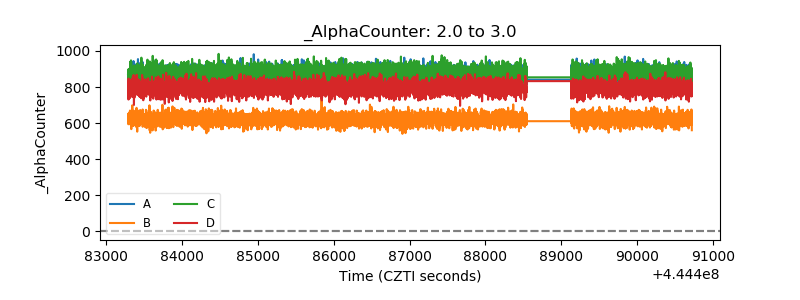 |
| _CPM_Rate | 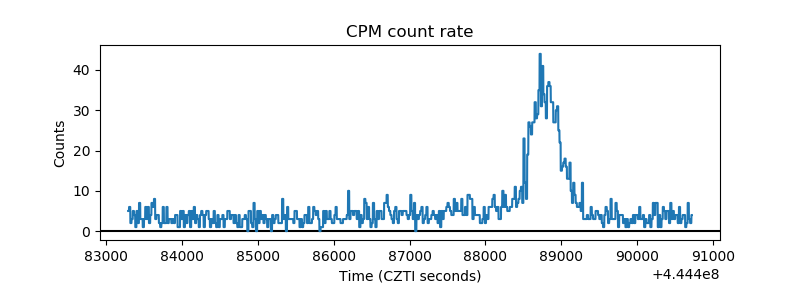 |
| CZT Counter | 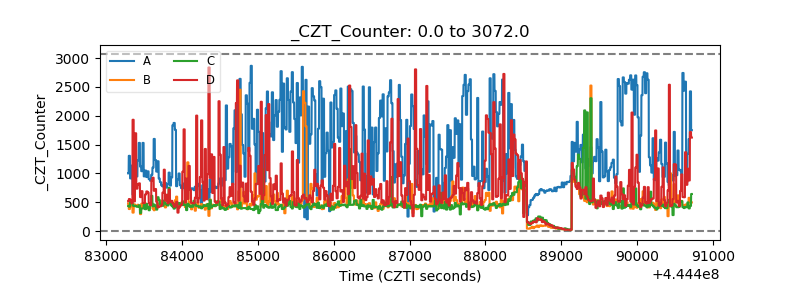 |
| +2.5 Volts monitor | 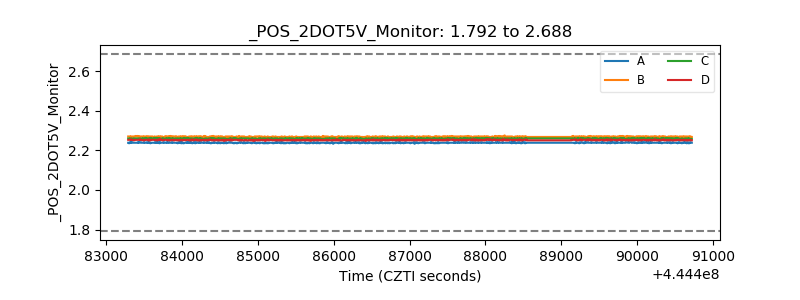 |
| +5 Volts monitor | 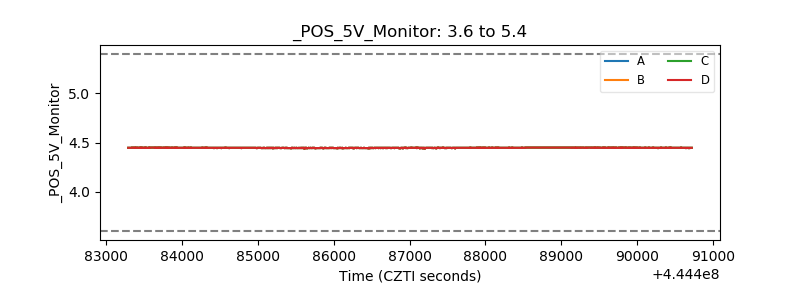 |
| _ROLL_ROT | 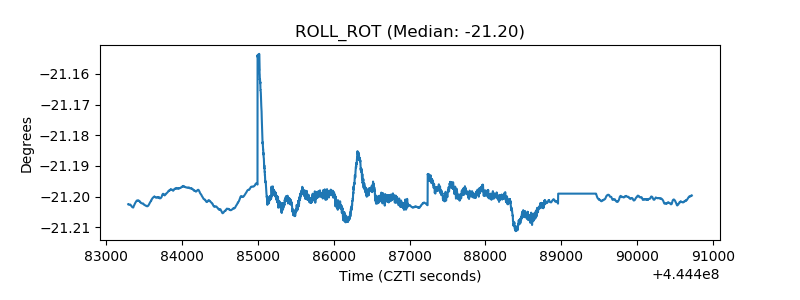 |
| _Roll_DEC | 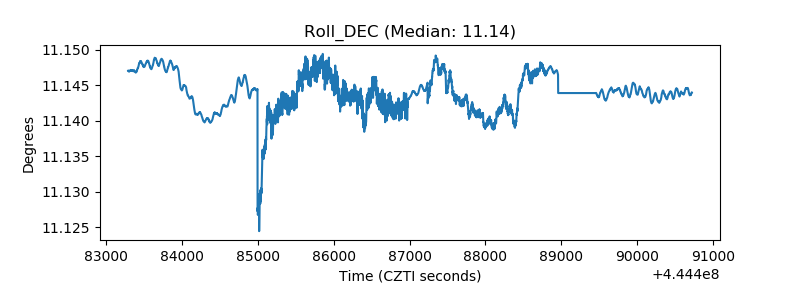 |
| _Roll_RA | 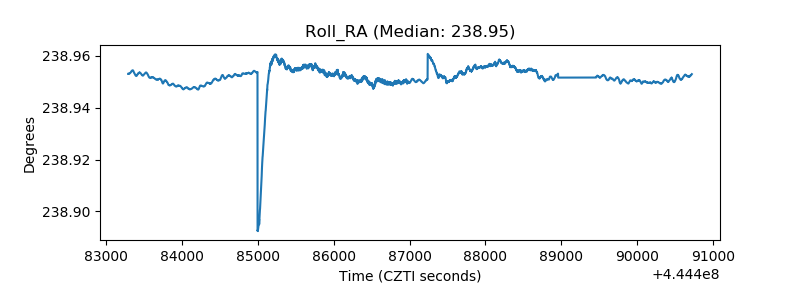 |
| Veto Counter | 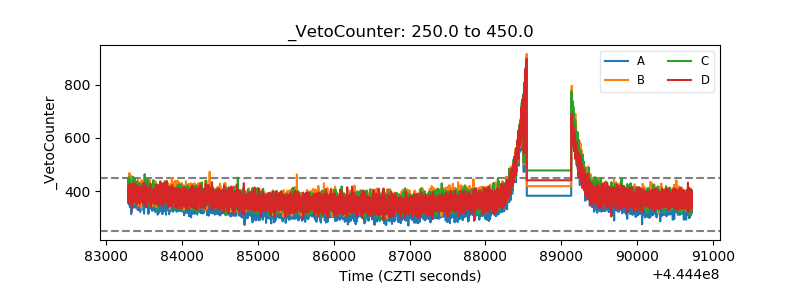 |