| Param | Original file | Final file |
|---|---|---|
| Filename | modeM0/AS1A13_017T02_9000006046_45131cztM0_level2.fits | modeM0/AS1A13_017T02_9000006046_45131cztM0_level2_quad_clean.evt |
| Size (bytes) | 710,746,560 | 117,351,360 |
| Size | 677.8 MB | 111.9 MB |
| Events in quadrant A | 11,108,393 | 634,897 |
| Events in quadrant B | 4,354,389 | 847,603 |
| Events in quadrant C | 3,958,992 | 820,831 |
| Events in quadrant D | 6,289,441 | 712,375 |
| Mode M0 | |||
|---|---|---|---|
| Quadrant | BADHDUFLAG | Total packets | Discarded packets |
| A | 0 | 38283 | 0 |
| B | 0 | 18068 | 0 |
| C | 0 | 17192 | 0 |
| D | 0 | 23884 | 0 |
| Mode SS | |||
|---|---|---|---|
| Quadrant | BADHDUFLAG | Total packets | Discarded packets |
| A | 0 | 154 | 0 |
| B | 0 | 154 | 0 |
| C | 0 | 154 | 0 |
| D | 0 | 154 | 0 |
| Quadrant | Total seconds | Saturated seconds | Saturation percentage |
|---|---|---|---|
| A | 7724 | 2194 | 28.404972% |
| B | 7724 | 224 | 2.900052% |
| C | 7724 | 97 | 1.255826% |
| D | 7725 | 561 | 7.262136% |
Noise dominated data is calculated using 1-second bins in cleaned event files. If a bin has >2000 counts, and if more than 50% of those come from <1% of pixels, then it is considered to be noise-dominated and hence unusable.
| Quadrant | # 1 sec bins | Bins with >0 counts | Bins with >2000 counts | High rate bins dominated by noise | Noise dominated (total time) | Noise dominated (detector-on time) | Marked lightcurve |
|---|---|---|---|---|---|---|---|
| A | 7725 | 7725 | 1718 | 1718 | 22.24% | 22.24% | 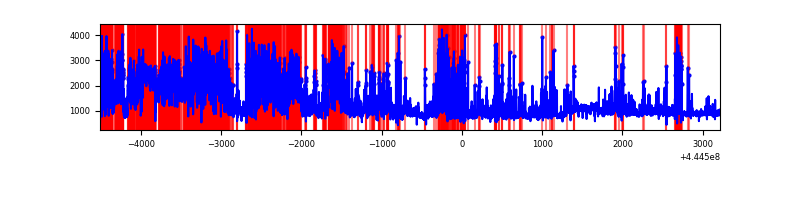 |
| B | 7725 | 7725 | 87 | 87 | 1.13% | 1.13% | 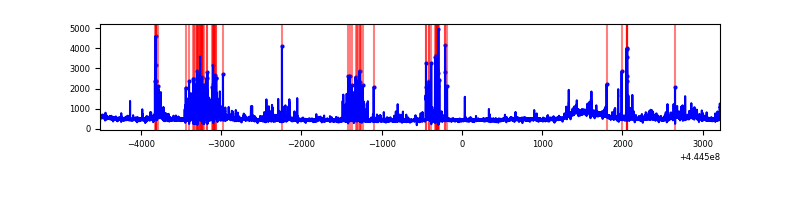 |
| C | 7725 | 7725 | 60 | 60 | 0.78% | 0.78% | 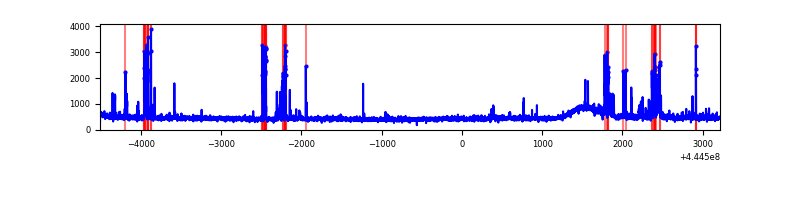 |
| D | 7726 | 7726 | 419 | 419 | 5.42% | 5.42% | 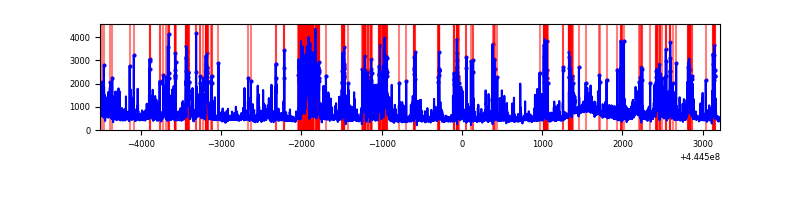 |
Top three noisy pixels from each quadrant. If the there are fewer than three noisy pixels in the level2.evt file, extra rows are filled as -1
| Pixel properties | Quadrant properties | ||||||
|---|---|---|---|---|---|---|---|
| Quadrant | DetID | PixID | Counts | Sigma | Mean | Median | Sigma |
| A | 15 | 223 | 5580520 | 32941.47 | 809 | 789 | 169.4 |
| A | 10 | 83 | 2349574 | 13866.69 | 809 | 789 | 169.4 |
| A | 0 | 243 | 37384 | 216.05 | 809 | 789 | 169.4 |
| B | 3 | 112 | 252154 | 1379.45 | 901 | 872 | 182.2 |
| B | 5 | 32 | 158085 | 863.04 | 901 | 872 | 182.2 |
| B | 0 | 183 | 132347 | 721.75 | 901 | 872 | 182.2 |
| C | 14 | 254 | 300921 | 1407.73 | 895 | 901 | 213.1 |
| C | 1 | 3 | 113400 | 527.86 | 895 | 901 | 213.1 |
| C | 12 | 250 | 33805 | 154.39 | 895 | 901 | 213.1 |
| D | 13 | 29 | 720486 | 3221.0 | 878 | 849 | 223.4 |
| D | 4 | 223 | 534539 | 2388.73 | 878 | 849 | 223.4 |
| D | 13 | 249 | 323544 | 1444.34 | 878 | 849 | 223.4 |
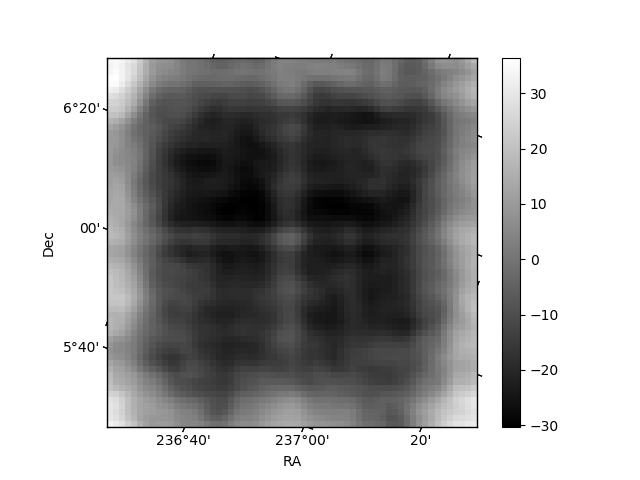
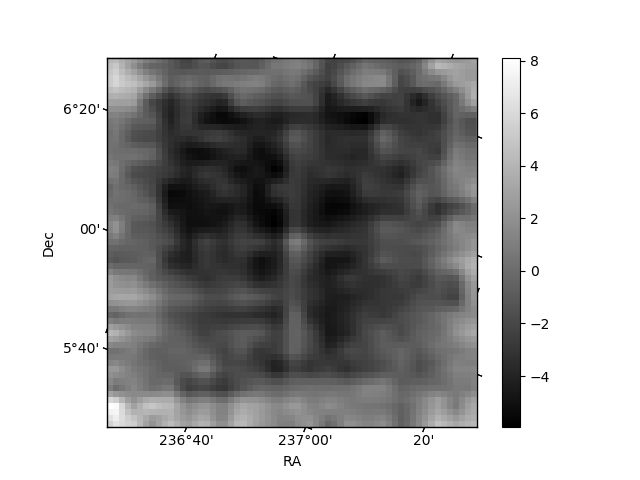
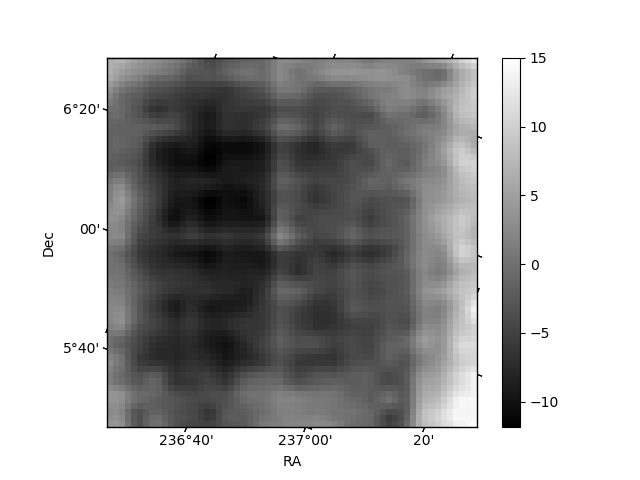
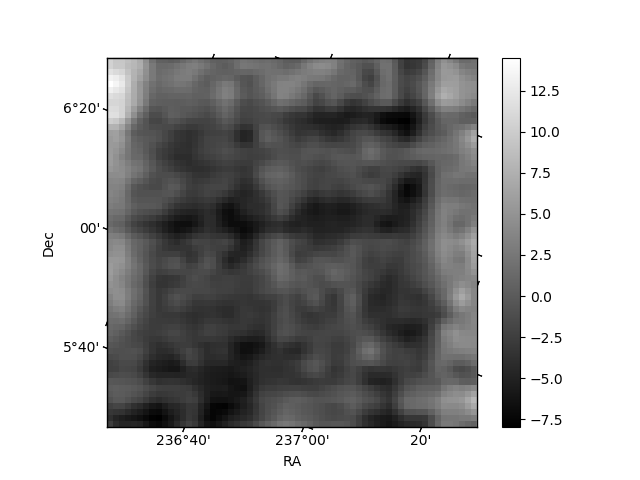
Histogram calculated using DETX and DETY for each event in the final _common_clean file
| Quadrant A | 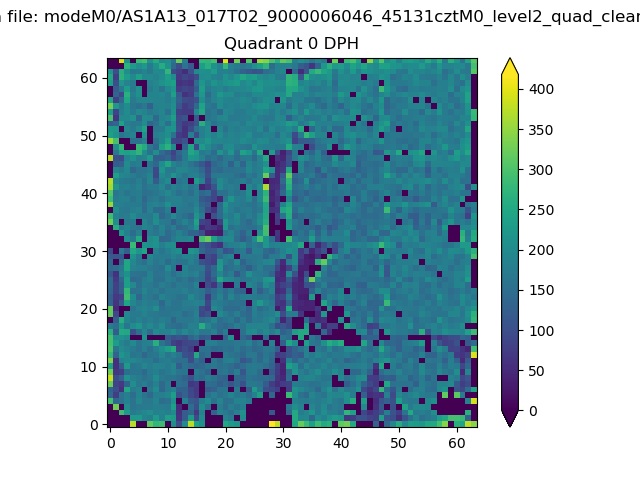 |
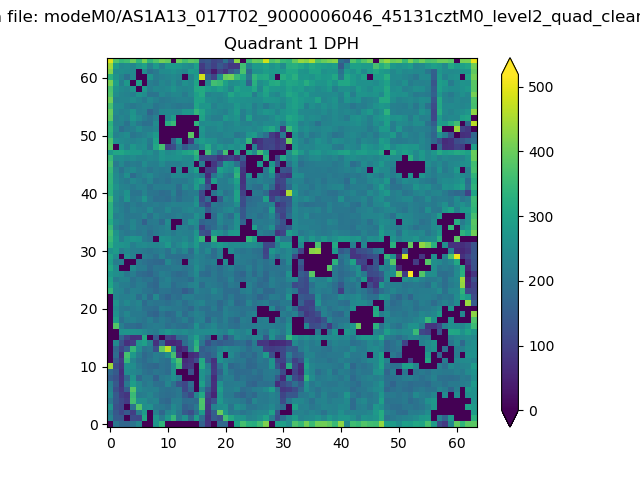 |
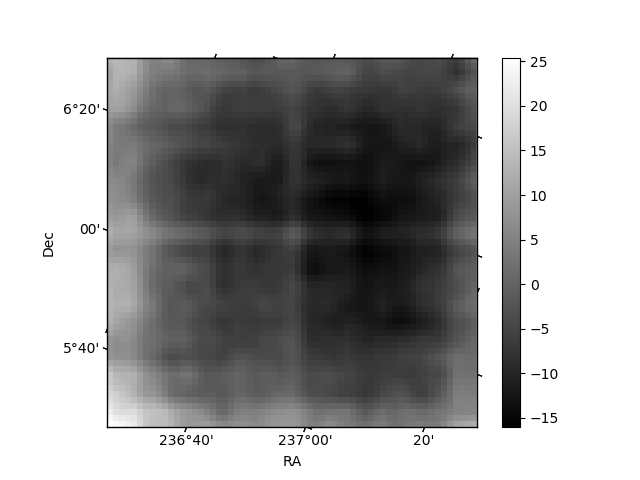
Quadrant B |
|---|---|---|---|
| Quadrant D | 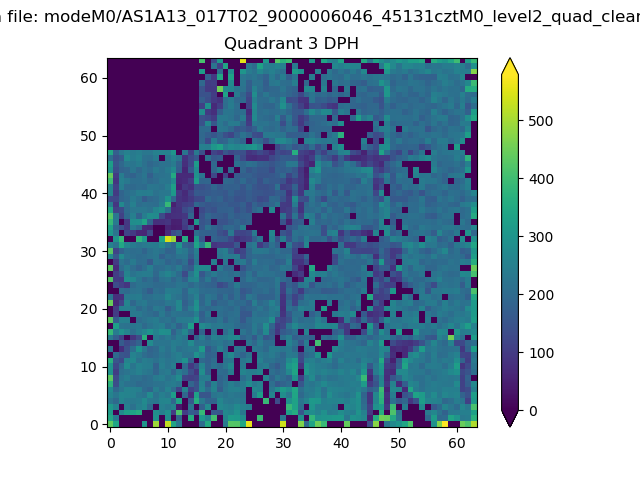 |
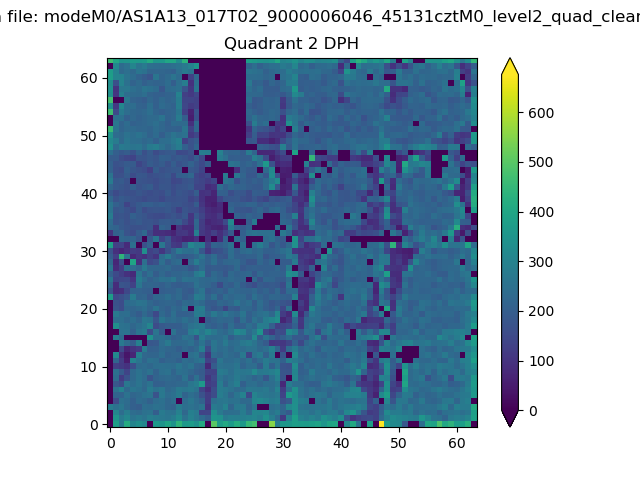 |
Quadrant C |
| Plot type | Count rate plots | Images |
|---|---|---|
| Comparison with Poisson distribution Blue bars denote a histogram of data divided into 1 sec bins. Red curve is a Poisson curve with rate = median count rate of data. |
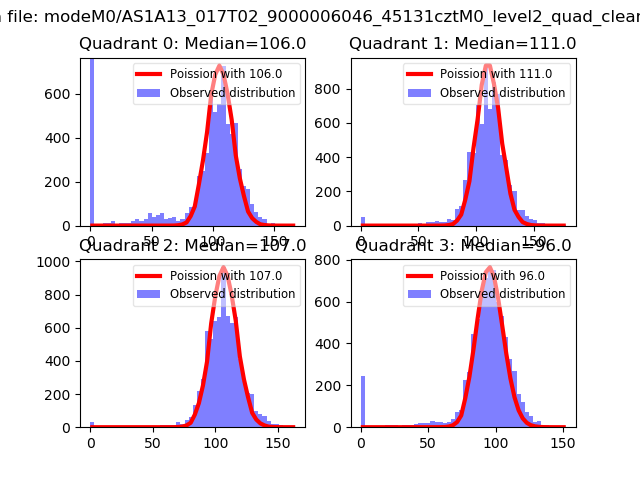 |
 |
| Quadrant-wise count rates Data is divided into 100 sec bins |
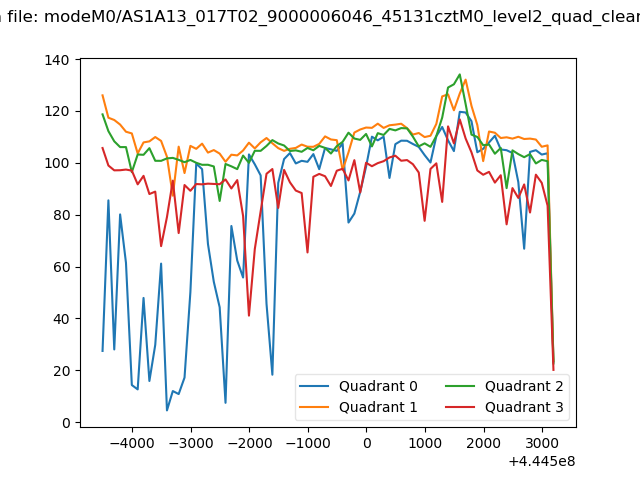 |
|
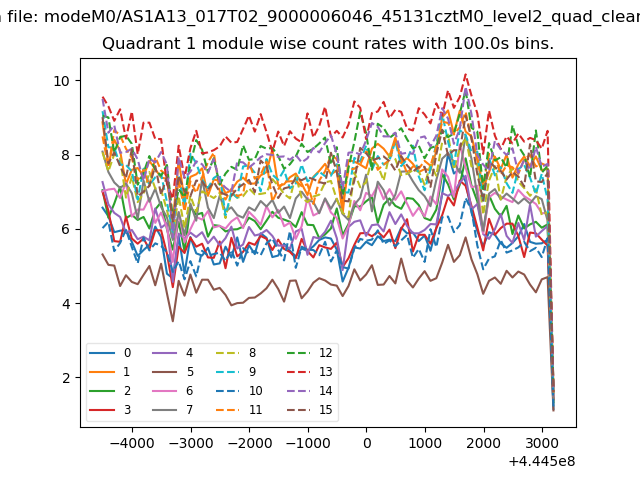
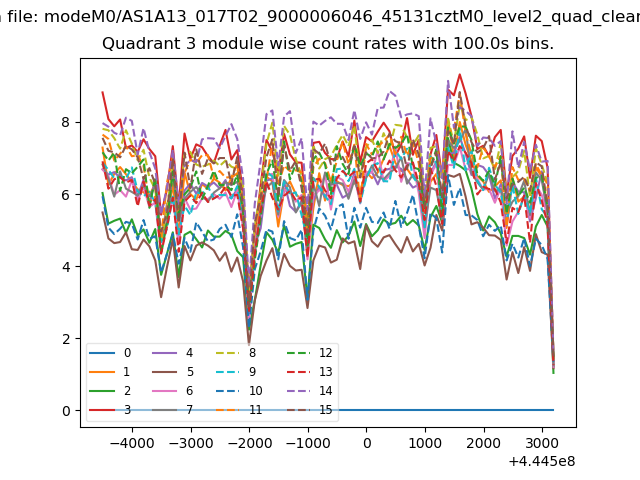
| Module-wise count rates for Quadrant A Data is divided into 100 sec bins |
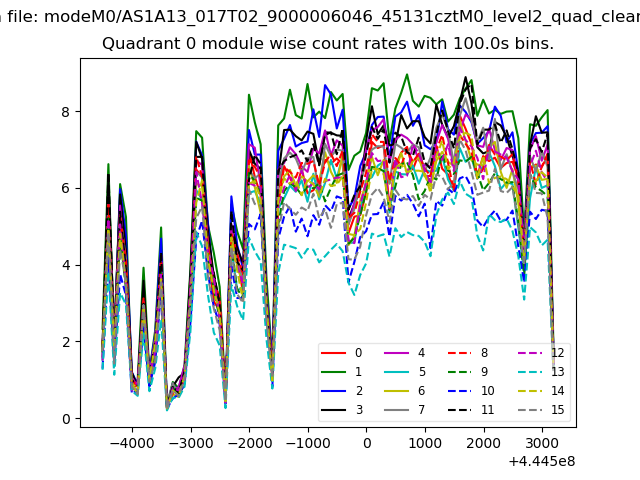 |
 |
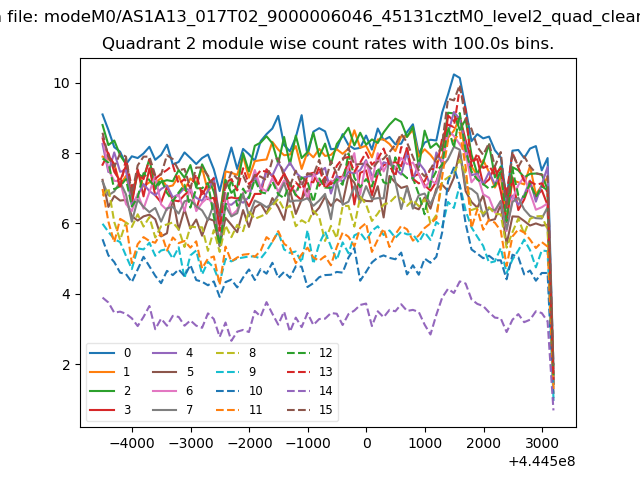
| Module-wise count rates for Quadrant B Data is divided into 100 sec bins |
 |
 |
| Module-wise count rates for Quadrant C Data is divided into 100 sec bins |
 |
 |
| Module-wise count rates for Quadrant D Data is divided into 100 sec bins |
 |
 |
| Parameter | Plot |
|---|---|
| CZT HV Monitor | 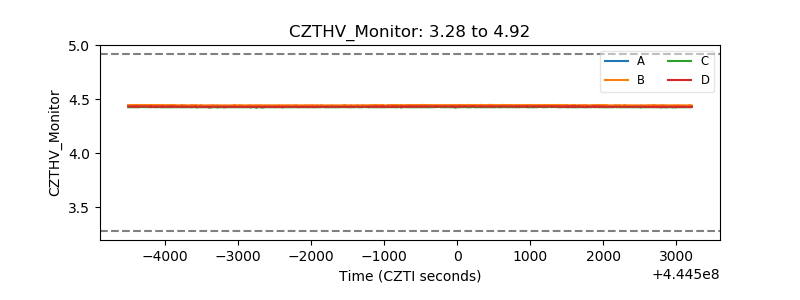 |
| D_VDD | 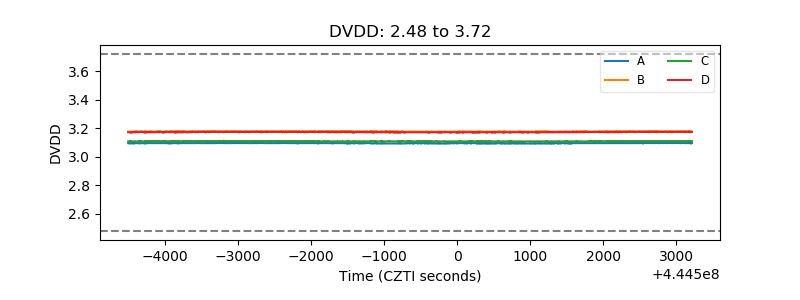 |
| Temperature 1 | 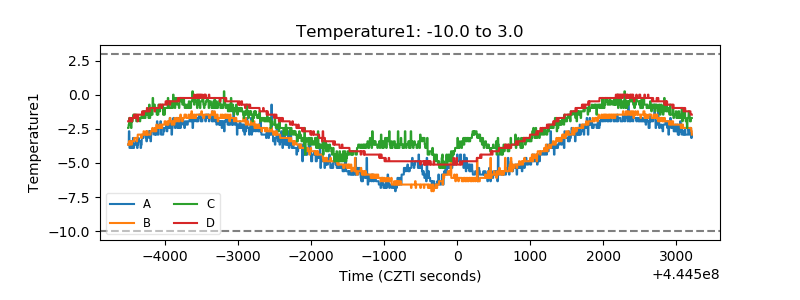 |
| Veto HV Monitor | 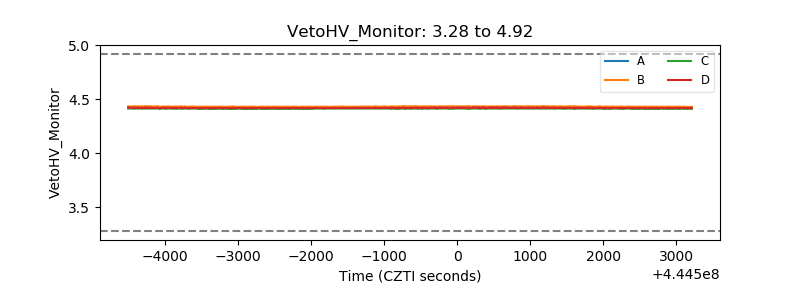 |
| Veto LLD | 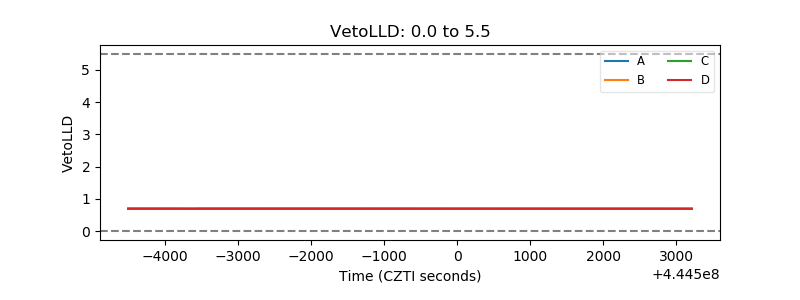 |
| Alpha Counter | 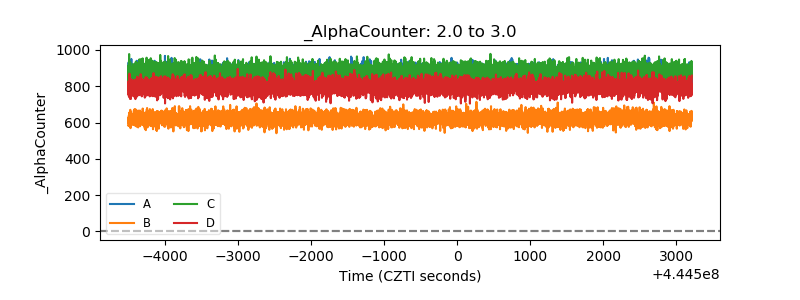 |
| _CPM_Rate | 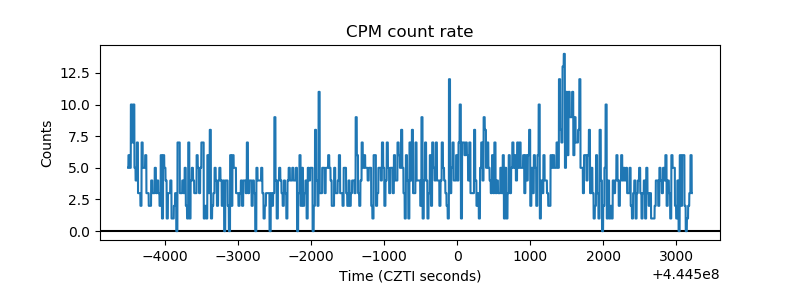 |
| CZT Counter | 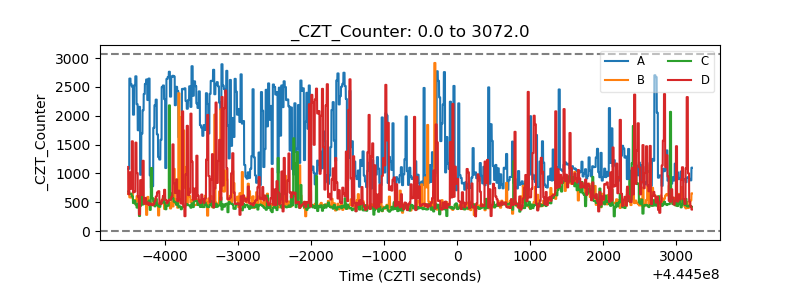 |
| +2.5 Volts monitor | 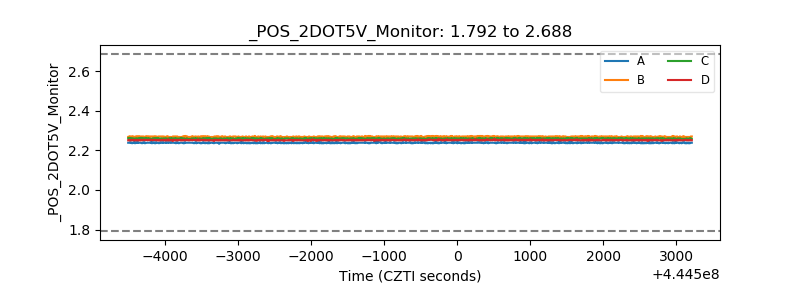 |
| +5 Volts monitor | 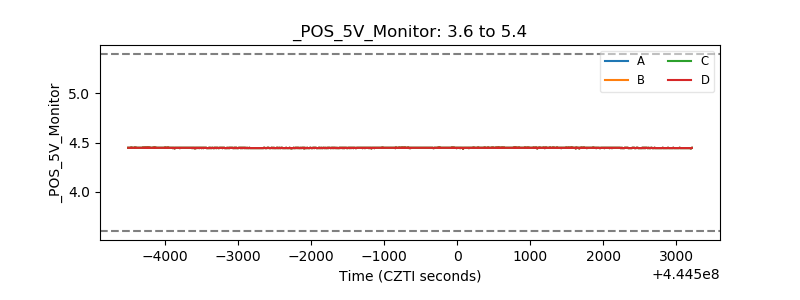 |
| _ROLL_ROT | 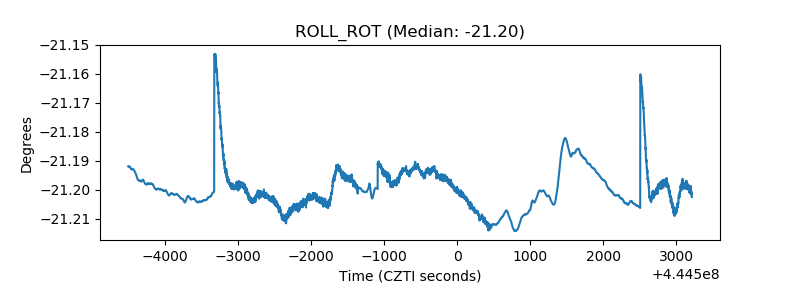 |
| _Roll_DEC | 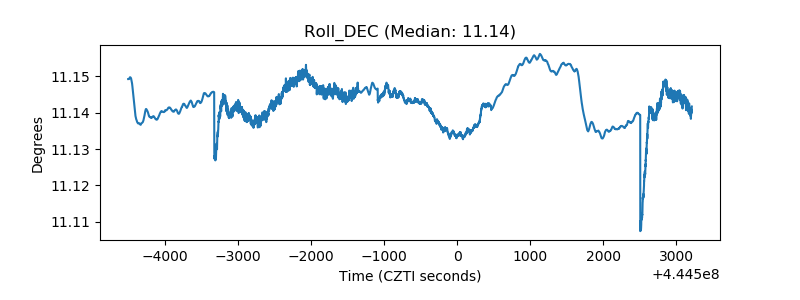 |
| _Roll_RA | 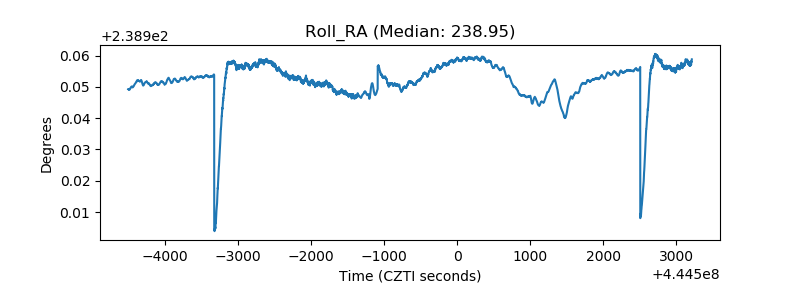 |
| Veto Counter | 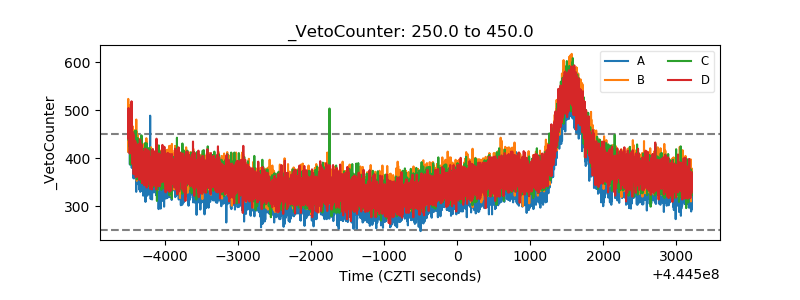 |