| Param | Original file | Final file |
|---|---|---|
| Filename | modeM0/AS1A13_017T02_9000006046_45132cztM0_level2.fits | modeM0/AS1A13_017T02_9000006046_45132cztM0_level2_quad_clean.evt |
| Size (bytes) | 693,290,880 | 126,748,800 |
| Size | 661.2 MB | 120.9 MB |
| Events in quadrant A | 8,165,777 | 796,005 |
| Events in quadrant B | 4,539,969 | 887,879 |
| Events in quadrant C | 4,565,045 | 854,463 |
| Events in quadrant D | 7,758,206 | 729,958 |
| Mode M0 | |||
|---|---|---|---|
| Quadrant | BADHDUFLAG | Total packets | Discarded packets |
| A | 0 | 30110 | 11 |
| B | 0 | 18863 | 9 |
| C | 0 | 19325 | 6 |
| D | 0 | 28681 | 13 |
| Mode SS | |||
|---|---|---|---|
| Quadrant | BADHDUFLAG | Total packets | Discarded packets |
| A | 0 | 164 | 0 |
| B | 0 | 164 | 0 |
| C | 0 | 164 | 0 |
| D | 0 | 164 | 0 |
| Quadrant | Total seconds | Saturated seconds | Saturation percentage |
|---|---|---|---|
| A | 8187 | 952 | 11.628191% |
| B | 8187 | 331 | 4.042995% |
| C | 8188 | 333 | 4.066927% |
| D | 8190 | 1040 | 12.698413% |
Noise dominated data is calculated using 1-second bins in cleaned event files. If a bin has >2000 counts, and if more than 50% of those come from <1% of pixels, then it is considered to be noise-dominated and hence unusable.
| Quadrant | # 1 sec bins | Bins with >0 counts | Bins with >2000 counts | High rate bins dominated by noise | Noise dominated (total time) | Noise dominated (detector-on time) | Marked lightcurve |
|---|---|---|---|---|---|---|---|
| A | 8206 | 8191 | 412 | 412 | 5.02% | 5.03% | 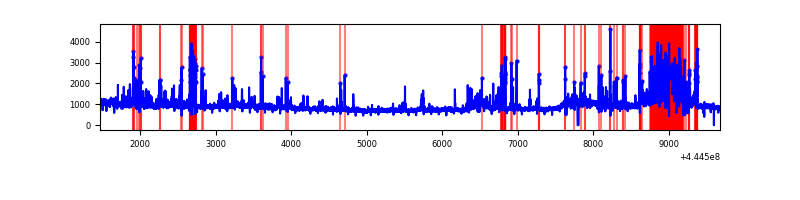 |
| B | 8206 | 8191 | 18 | 18 | 0.22% | 0.22% | 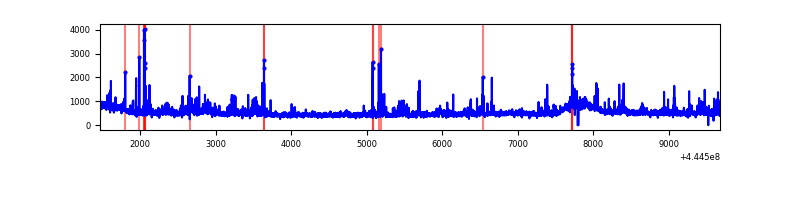 |
| C | 8207 | 8192 | 106 | 106 | 1.29% | 1.29% | 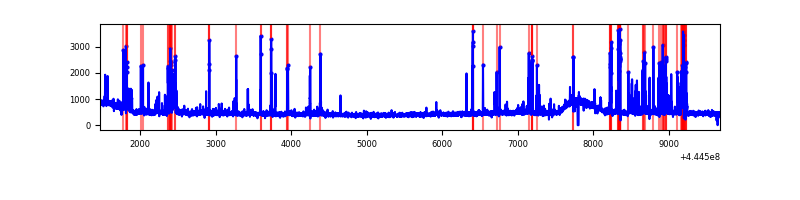 |
| D | 8207 | 8192 | 730 | 730 | 8.89% | 8.91% | 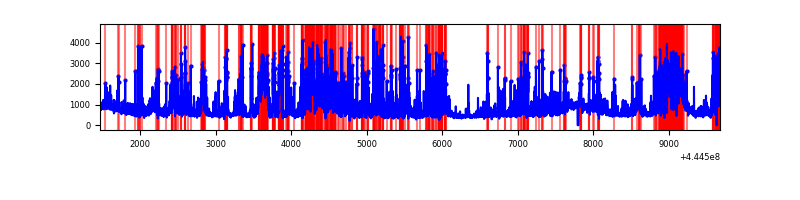 |
Top three noisy pixels from each quadrant. If the there are fewer than three noisy pixels in the level2.evt file, extra rows are filled as -1
| Pixel properties | Quadrant properties | ||||||
|---|---|---|---|---|---|---|---|
| Quadrant | DetID | PixID | Counts | Sigma | Mean | Median | Sigma |
| A | 10 | 83 | 2749447 | 13703.38 | 953 | 929 | 200.6 |
| A | 15 | 223 | 1700998 | 8476.09 | 953 | 929 | 200.6 |
| A | 0 | 243 | 19049 | 90.34 | 953 | 929 | 200.6 |
| B | 0 | 183 | 156355 | 784.45 | 986 | 954 | 198.1 |
| B | 0 | 155 | 133535 | 669.26 | 986 | 954 | 198.1 |
| B | 5 | 255 | 102526 | 512.73 | 986 | 954 | 198.1 |
| C | 14 | 254 | 521458 | 2253.06 | 969 | 974 | 231.0 |
| C | 15 | 208 | 124232 | 533.56 | 969 | 974 | 231.0 |
| C | 12 | 250 | 43020 | 182.01 | 969 | 974 | 231.0 |
| D | 13 | 249 | 790460 | 3252.44 | 947 | 914 | 242.8 |
| D | 5 | 235 | 613008 | 2521.44 | 947 | 914 | 242.8 |
| D | 4 | 223 | 526712 | 2165.96 | 947 | 914 | 242.8 |
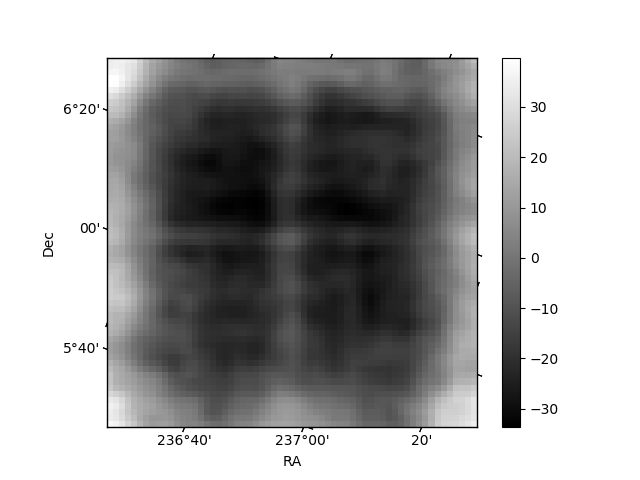
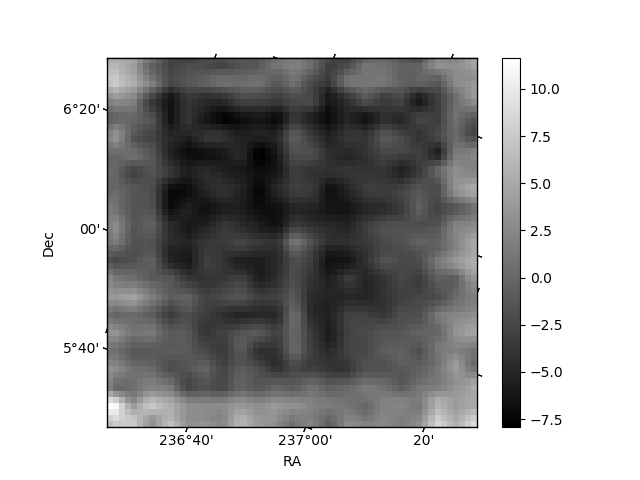
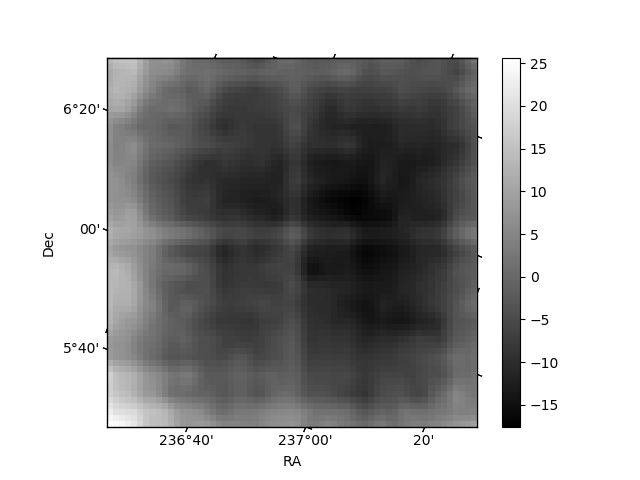
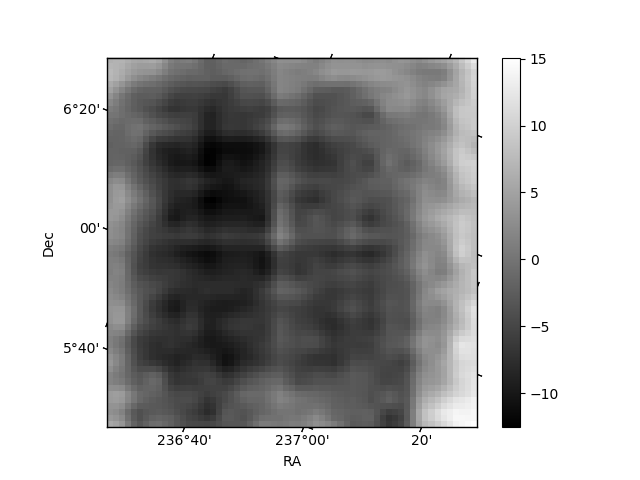
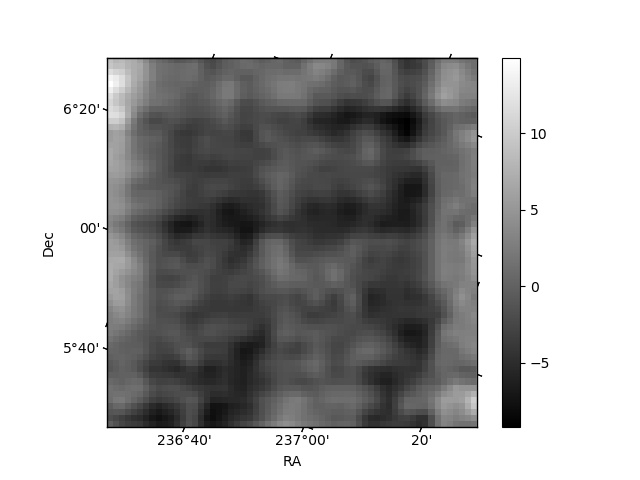
Histogram calculated using DETX and DETY for each event in the final _common_clean file
| Quadrant A | 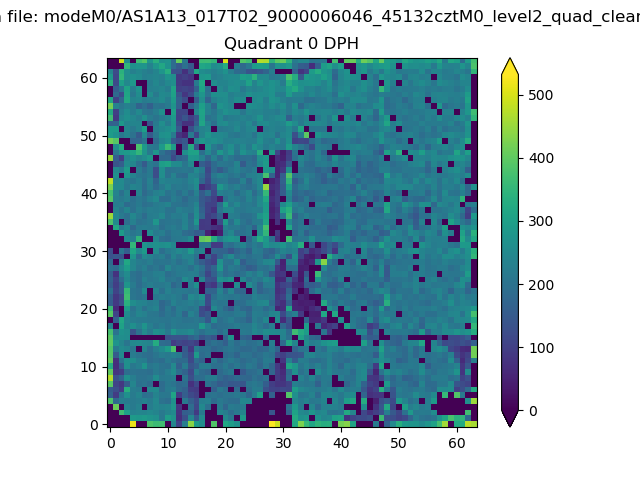 |
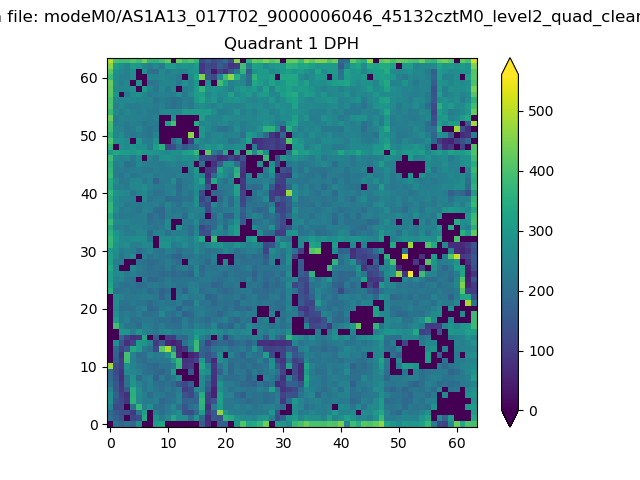 |
Quadrant B |
|---|---|---|---|
| Quadrant D | 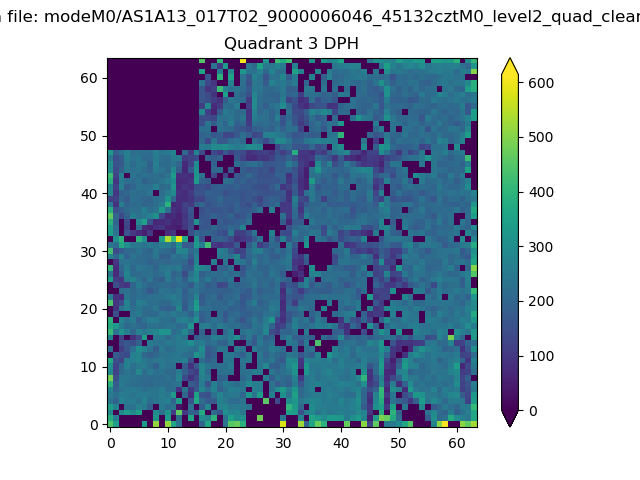 |
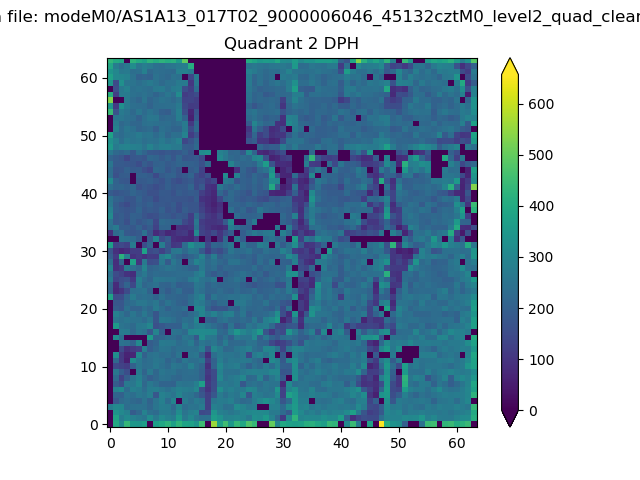 |
Quadrant C |
| Plot type | Count rate plots | Images |
|---|---|---|
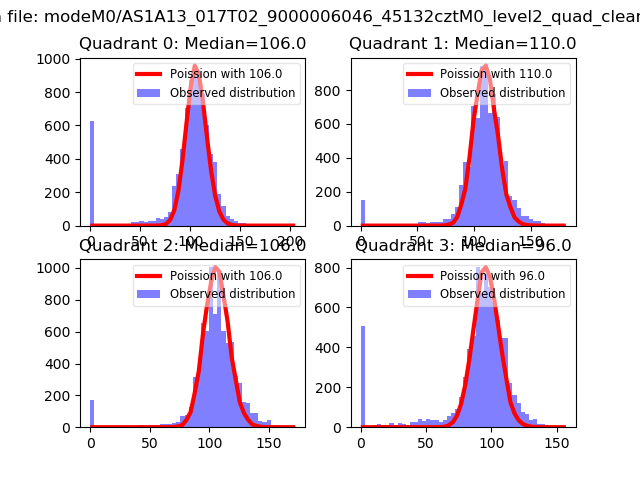
| Comparison with Poisson distribution Blue bars denote a histogram of data divided into 1 sec bins. Red curve is a Poisson curve with rate = median count rate of data. |
 |
 |
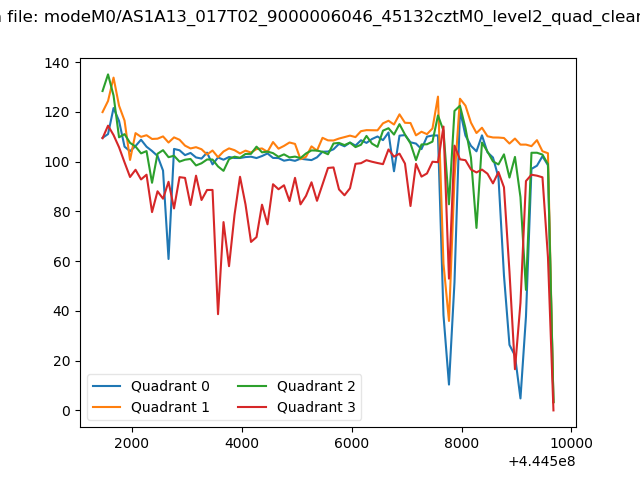
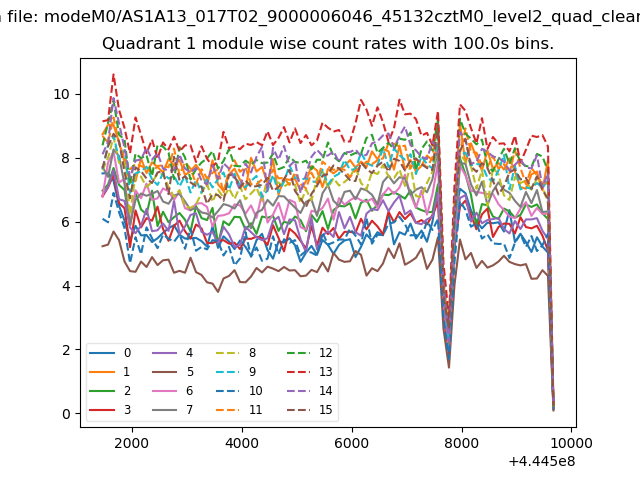
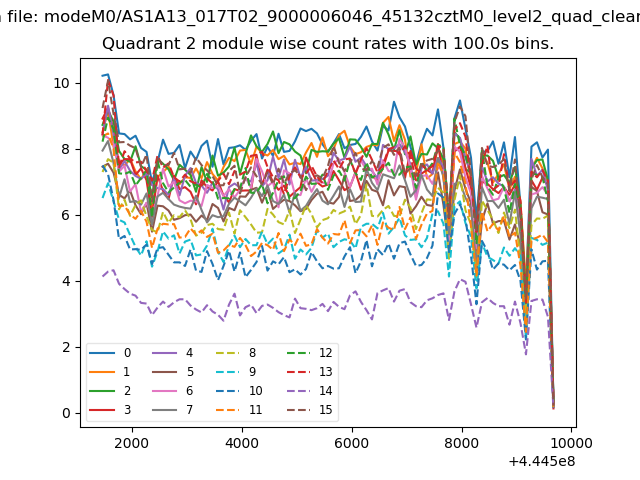
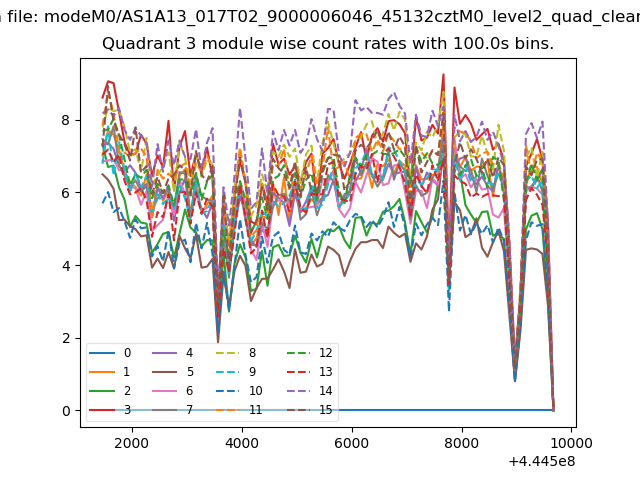
| Quadrant-wise count rates Data is divided into 100 sec bins |
 |
|
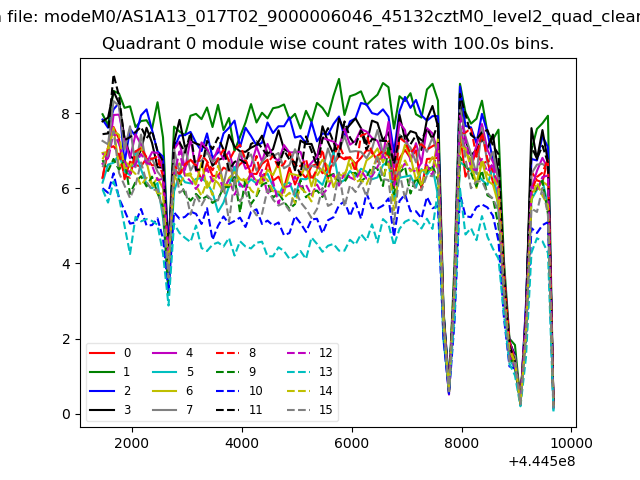
| Module-wise count rates for Quadrant A Data is divided into 100 sec bins |
 |
 |
| Module-wise count rates for Quadrant B Data is divided into 100 sec bins |
 |
 |
| Module-wise count rates for Quadrant C Data is divided into 100 sec bins |
 |
 |
| Module-wise count rates for Quadrant D Data is divided into 100 sec bins |
 |
 |
| Parameter | Plot |
|---|---|
| CZT HV Monitor | 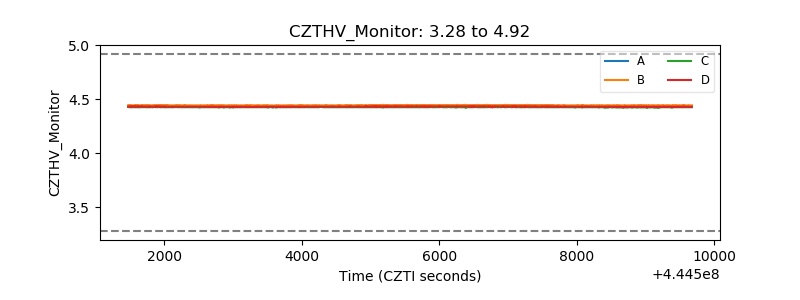 |
| D_VDD | 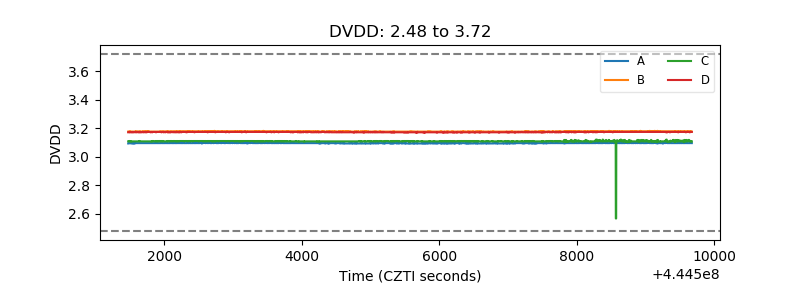 |
| Temperature 1 | 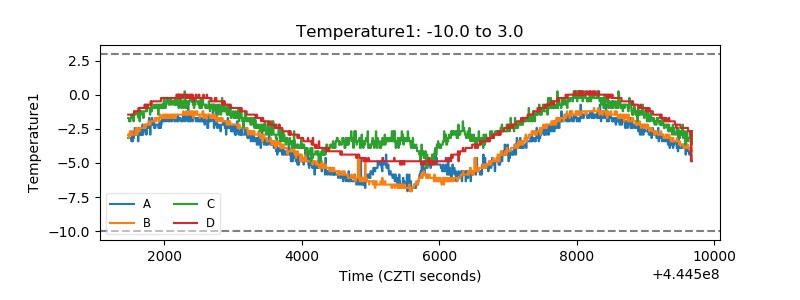 |
| Veto HV Monitor | 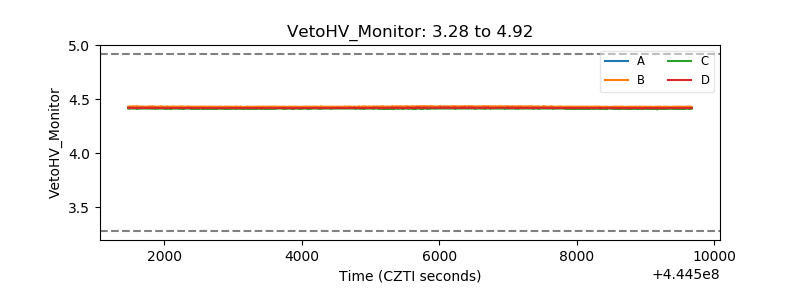 |
| Veto LLD | 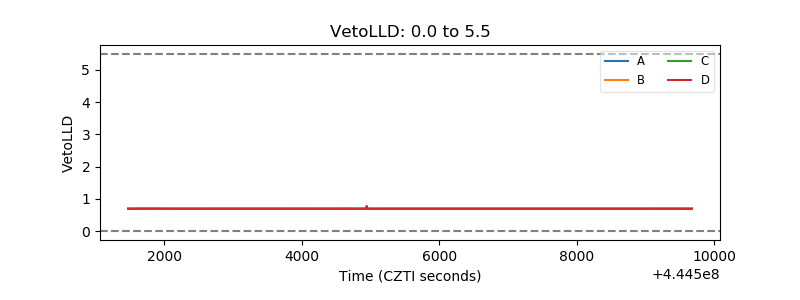 |
| Alpha Counter | 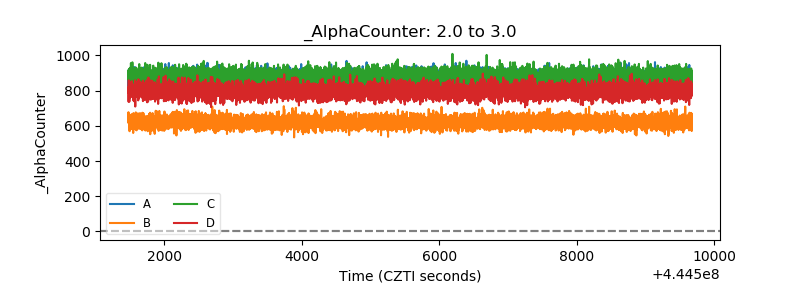 |
| _CPM_Rate | 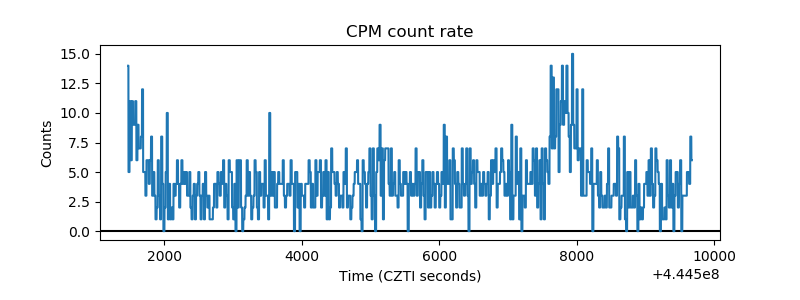 |
| CZT Counter | 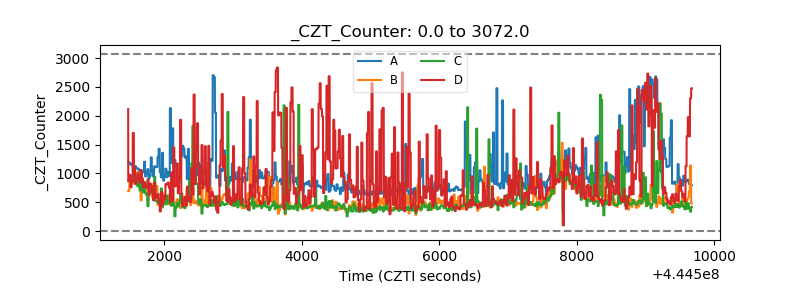 |
| +2.5 Volts monitor | 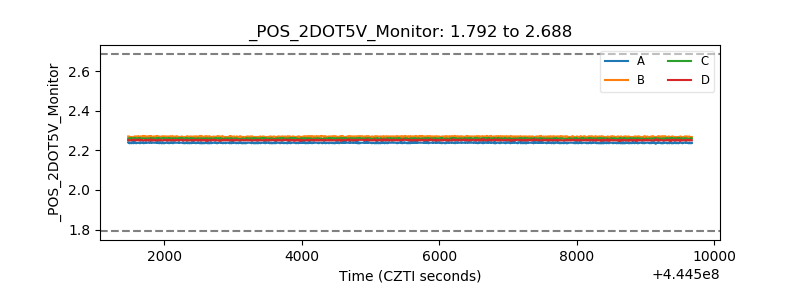 |
| +5 Volts monitor | 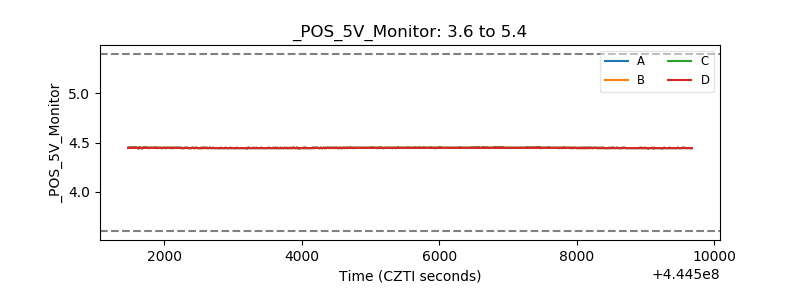 |
| _ROLL_ROT | 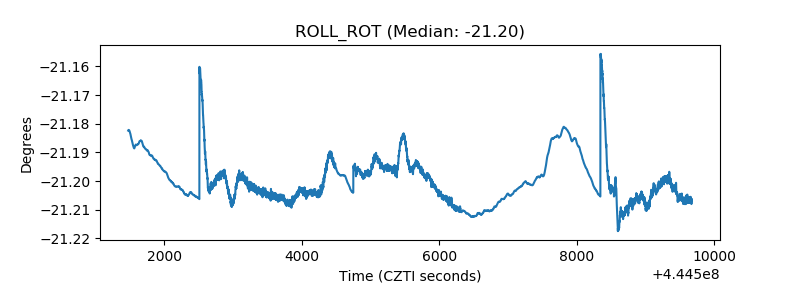 |
| _Roll_DEC | 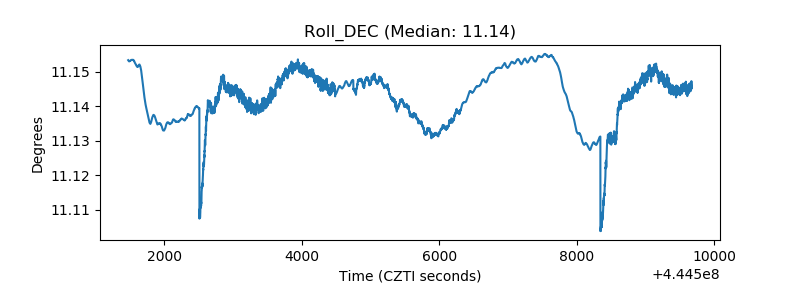 |
| _Roll_RA | 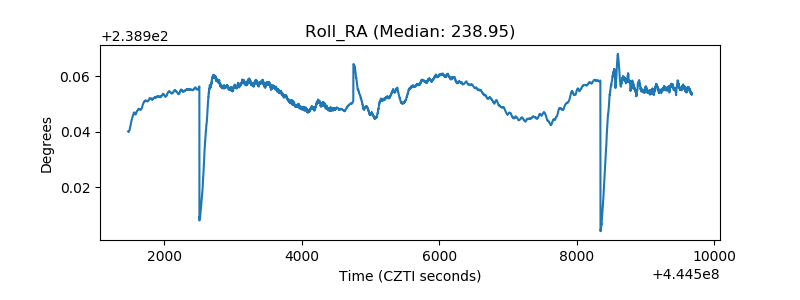 |
| Veto Counter | 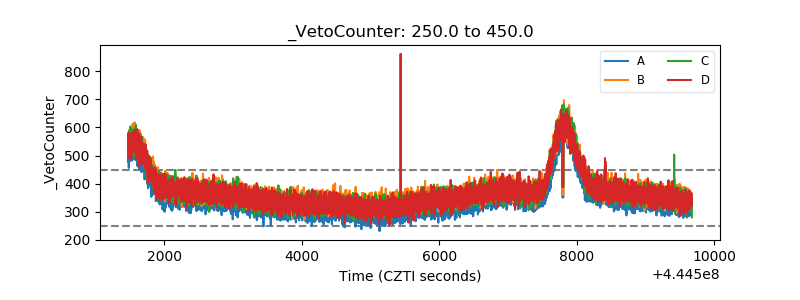 |