| Param | Original file | Final file |
|---|---|---|
| Filename | modeM0/AS1A13_017T02_9000006046_45136cztM0_level2.fits | modeM0/AS1A13_017T02_9000006046_45136cztM0_level2_quad_clean.evt |
| Size (bytes) | 1,124,844,480 | 196,706,880 |
| Size | 1.0 GB | 187.6 MB |
| Events in quadrant A | 16,518,371 | 1,097,186 |
| Events in quadrant B | 6,736,098 | 1,424,220 |
| Events in quadrant C | 6,427,053 | 1,375,905 |
| Events in quadrant D | 10,935,790 | 1,145,968 |
| Mode M0 | |||
|---|---|---|---|
| Quadrant | BADHDUFLAG | Total packets | Discarded packets |
| A | 0 | 58236 | 3 |
| B | 0 | 28961 | 3 |
| C | 0 | 28473 | 3 |
| D | 0 | 41681 | 3 |
| Mode M9 | |||
|---|---|---|---|
| Quadrant | BADHDUFLAG | Total packets | Discarded packets |
| A | 0 | 10 | 0 |
| B | 0 | 10 | 0 |
| C | 0 | 10 | 0 |
| D | 0 | 10 | 0 |
| Mode SS | |||
|---|---|---|---|
| Quadrant | BADHDUFLAG | Total packets | Discarded packets |
| A | 0 | 266 | 0 |
| B | 0 | 266 | 0 |
| C | 0 | 266 | 0 |
| D | 0 | 266 | 0 |
| Quadrant | Total seconds | Saturated seconds | Saturation percentage |
|---|---|---|---|
| A | 13196 | 3109 | 23.560170% |
| B | 13197 | 293 | 2.220202% |
| C | 13197 | 297 | 2.250511% |
| D | 13197 | 1263 | 9.570357% |
Noise dominated data is calculated using 1-second bins in cleaned event files. If a bin has >2000 counts, and if more than 50% of those come from <1% of pixels, then it is considered to be noise-dominated and hence unusable.
| Quadrant | # 1 sec bins | Bins with >0 counts | Bins with >2000 counts | High rate bins dominated by noise | Noise dominated (total time) | Noise dominated (detector-on time) | Marked lightcurve |
|---|---|---|---|---|---|---|---|
| A | 14215 | 13196 | 2447 | 2447 | 17.21% | 18.54% | 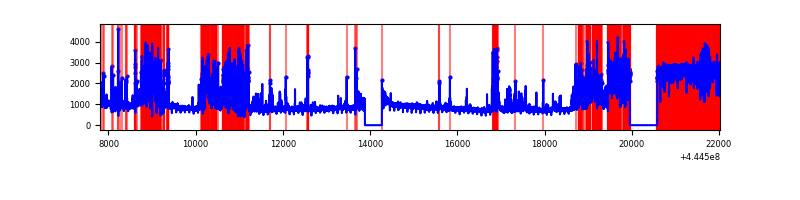 |
| B | 14217 | 13199 | 14 | 14 | 0.10% | 0.11% | 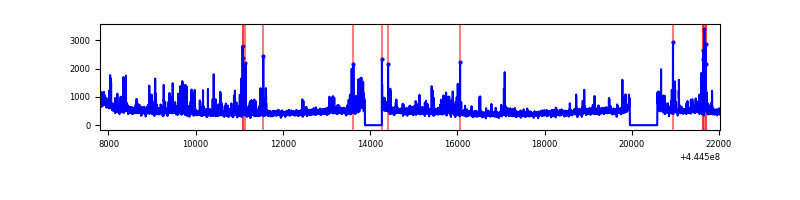 |
| C | 14217 | 13199 | 90 | 90 | 0.63% | 0.68% | 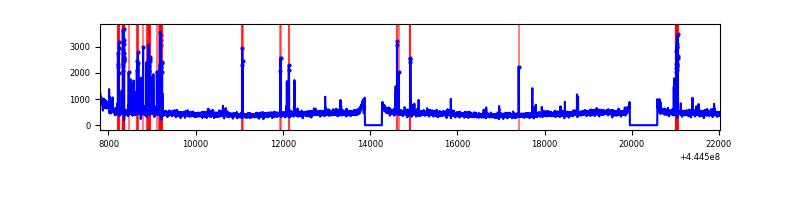 |
| D | 14217 | 13199 | 817 | 817 | 5.75% | 6.19% | 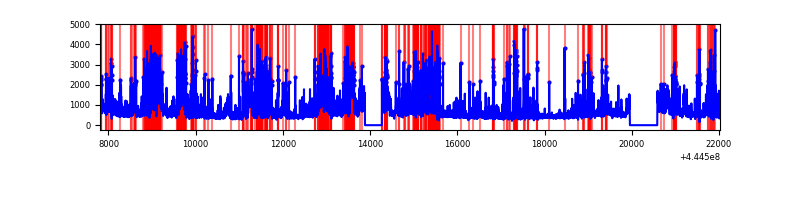 |
Top three noisy pixels from each quadrant. If the there are fewer than three noisy pixels in the level2.evt file, extra rows are filled as -1
| Pixel properties | Quadrant properties | ||||||
|---|---|---|---|---|---|---|---|
| Quadrant | DetID | PixID | Counts | Sigma | Mean | Median | Sigma |
| A | 15 | 223 | 6936653 | 25073.72 | 1330 | 1301 | 276.6 |
| A | 10 | 83 | 4106568 | 14841.97 | 1330 | 1301 | 276.6 |
| A | 13 | 248 | 270971 | 974.95 | 1330 | 1301 | 276.6 |
| B | 4 | 170 | 199745 | 657.79 | 1521 | 1469 | 301.4 |
| B | 0 | 183 | 122888 | 402.82 | 1521 | 1469 | 301.4 |
| B | 5 | 255 | 92433 | 301.78 | 1521 | 1469 | 301.4 |
| C | 14 | 254 | 240319 | 672.64 | 1496 | 1504 | 355.0 |
| C | 15 | 208 | 181502 | 506.98 | 1496 | 1504 | 355.0 |
| C | 1 | 3 | 70887 | 195.42 | 1496 | 1504 | 355.0 |
| D | 13 | 249 | 1386890 | 3764.11 | 1457 | 1412 | 368.1 |
| D | 4 | 232 | 808328 | 2192.26 | 1457 | 1412 | 368.1 |
| D | 13 | 29 | 790041 | 2142.57 | 1457 | 1412 | 368.1 |
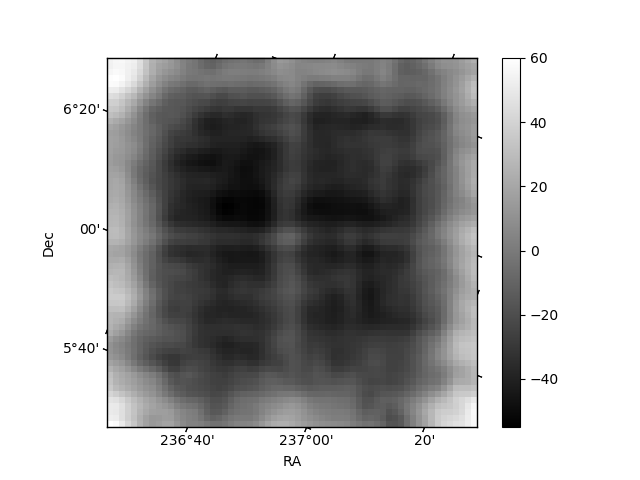
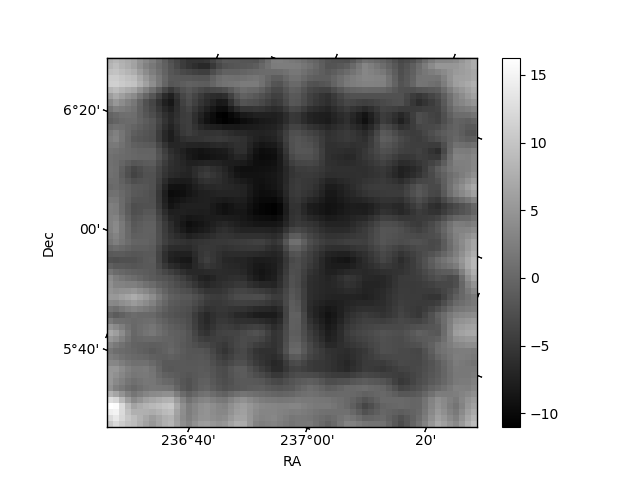
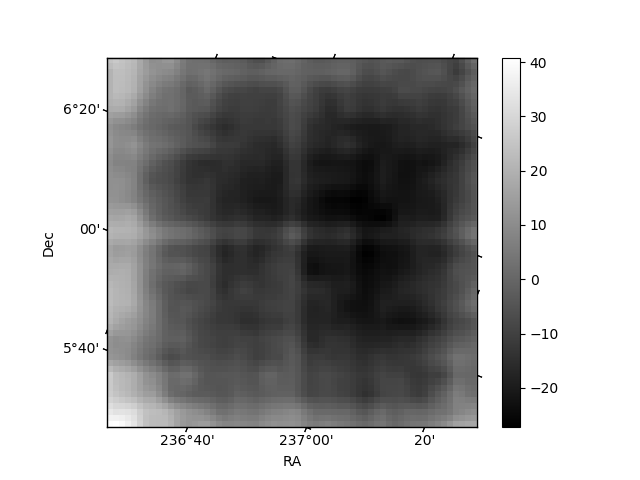
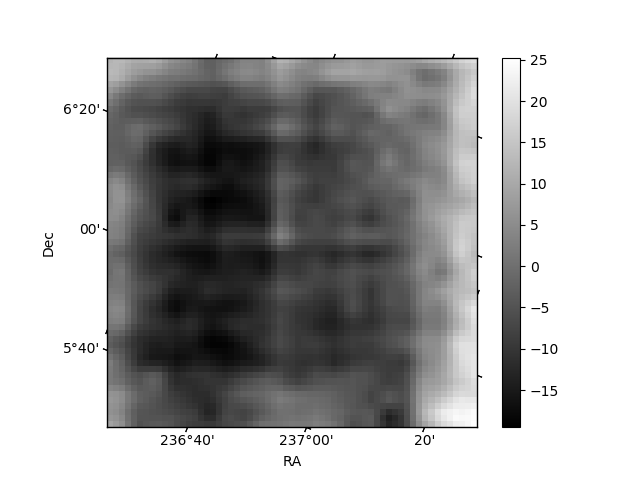
Histogram calculated using DETX and DETY for each event in the final _common_clean file
| Quadrant A | 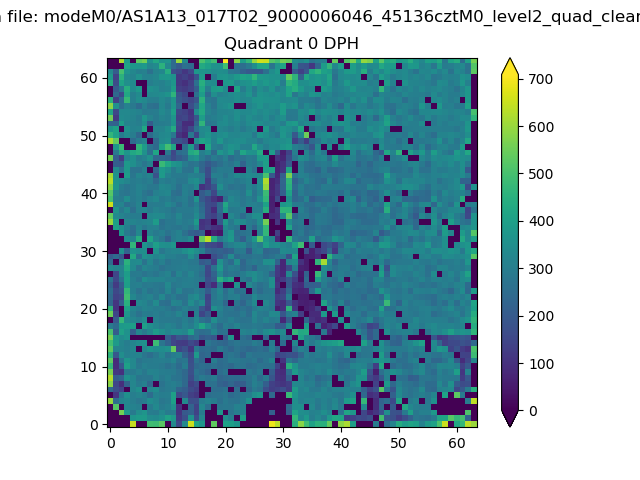 |
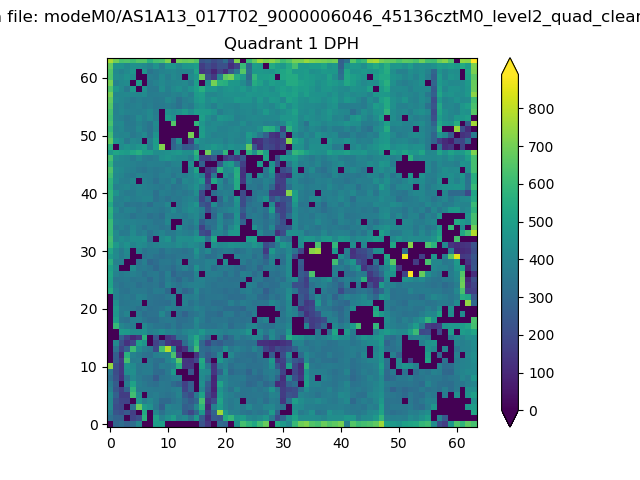 |
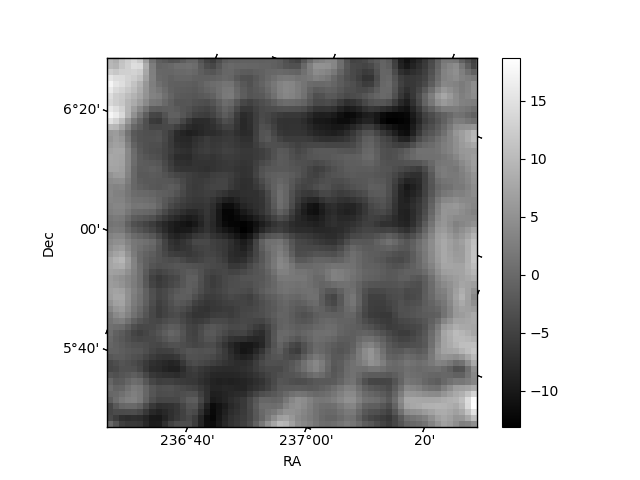
Quadrant B |
|---|---|---|---|
| Quadrant D | 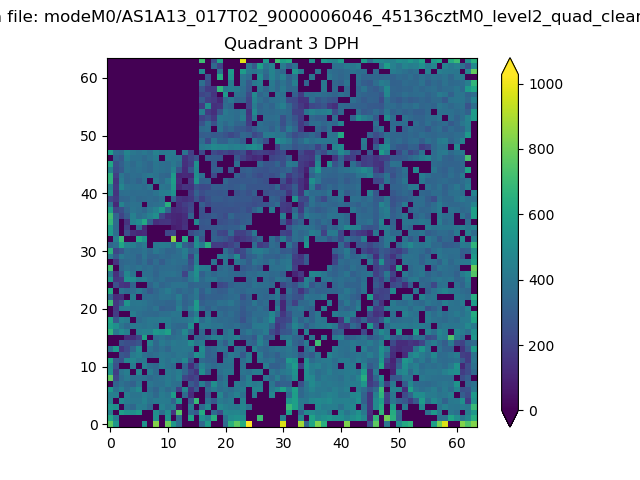 |
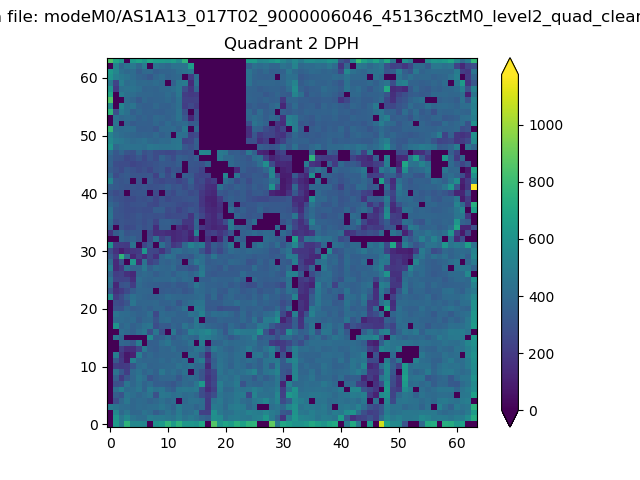 |
Quadrant C |
| Plot type | Count rate plots | Images |
|---|---|---|
| Comparison with Poisson distribution Blue bars denote a histogram of data divided into 1 sec bins. Red curve is a Poisson curve with rate = median count rate of data. |
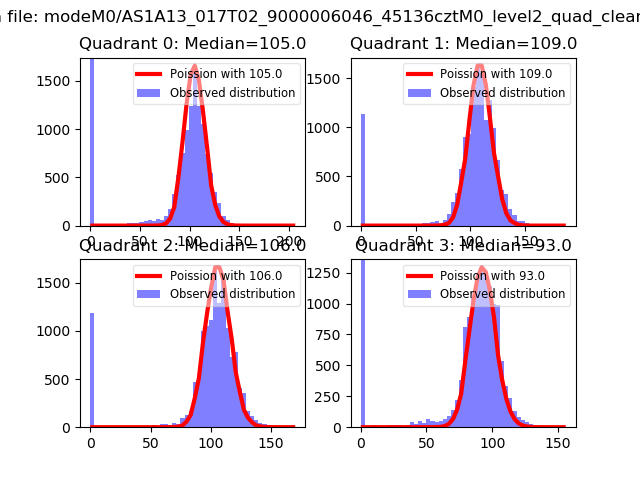 |
 |
| Quadrant-wise count rates Data is divided into 100 sec bins |
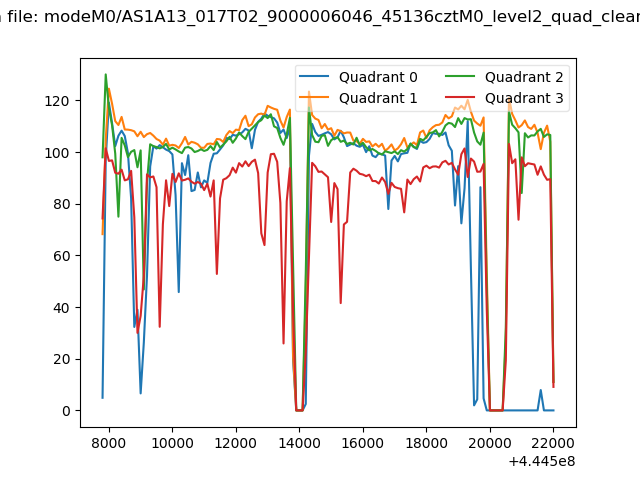 |
|
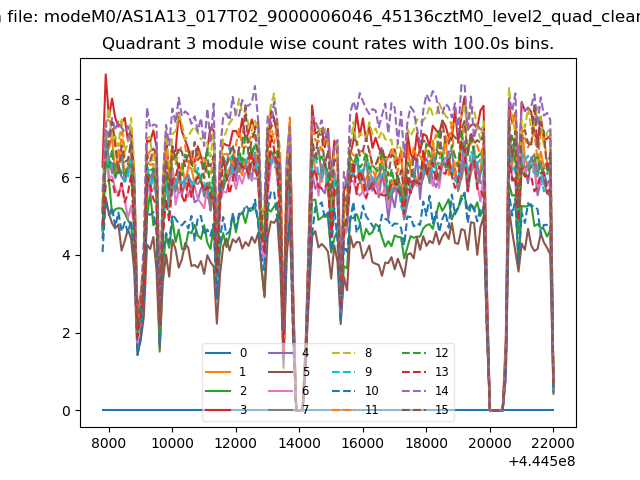
| Module-wise count rates for Quadrant A Data is divided into 100 sec bins |
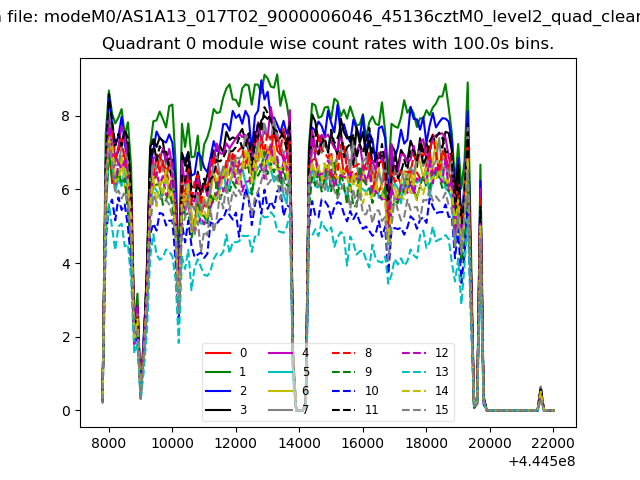 |
 |
| Module-wise count rates for Quadrant B Data is divided into 100 sec bins |
 |
 |
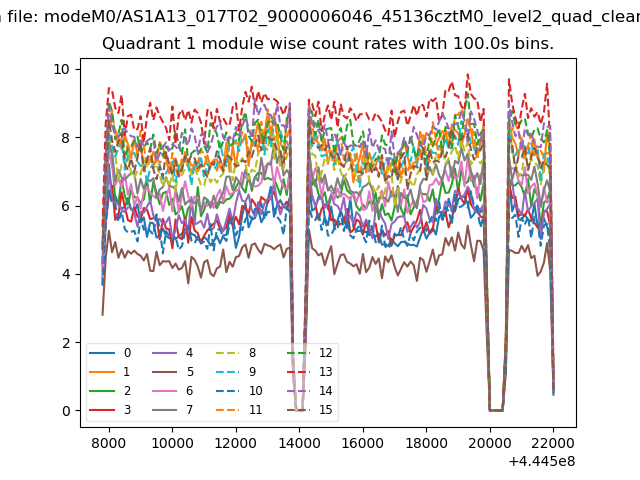
| Module-wise count rates for Quadrant C Data is divided into 100 sec bins |
 |
 |
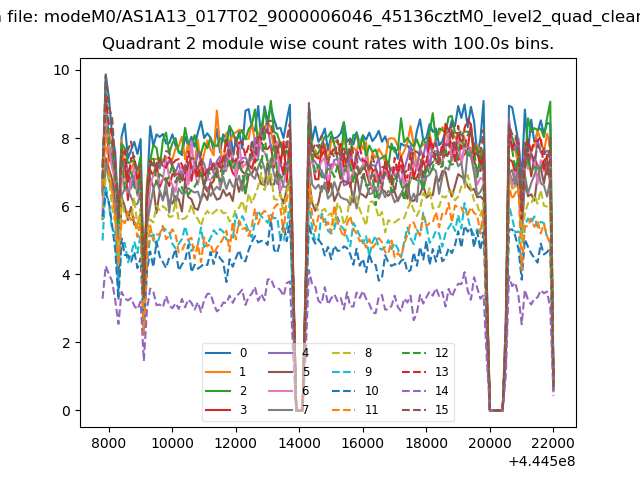
| Module-wise count rates for Quadrant D Data is divided into 100 sec bins |
 |
 |
| Parameter | Plot |
|---|---|
| CZT HV Monitor | 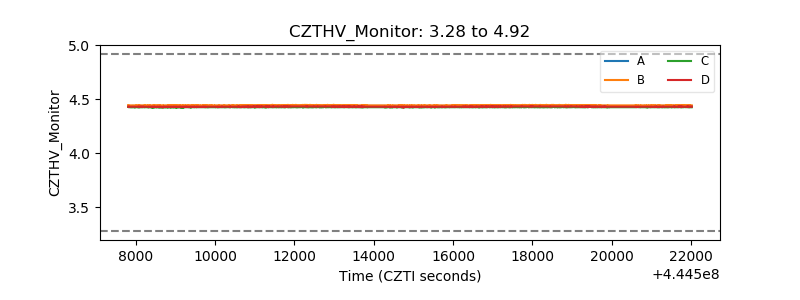 |
| D_VDD | 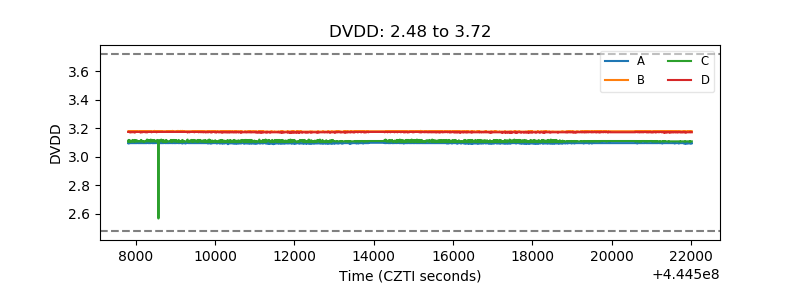 |
| Temperature 1 | 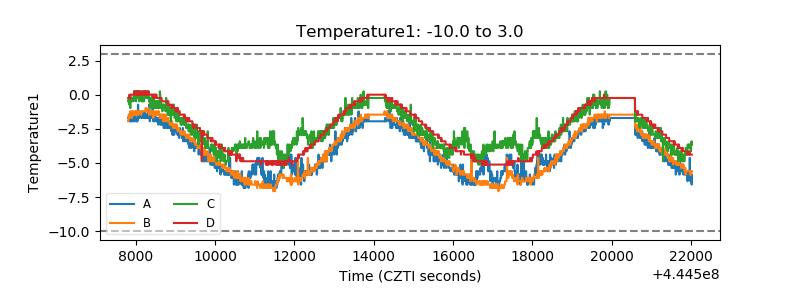 |
| Veto HV Monitor | 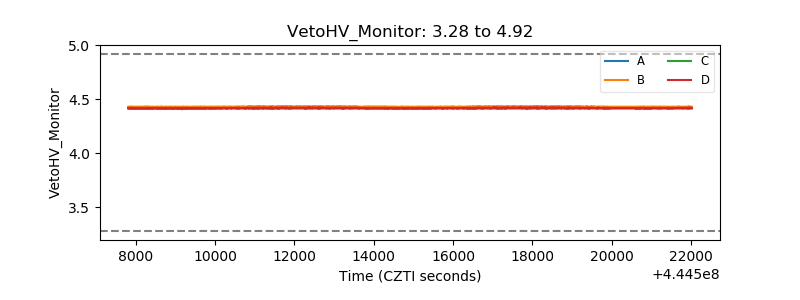 |
| Veto LLD | 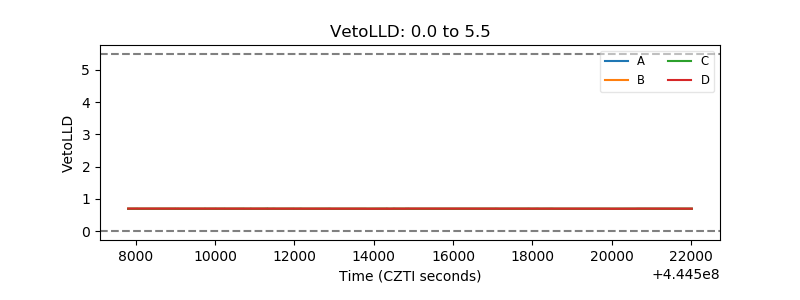 |
| Alpha Counter | 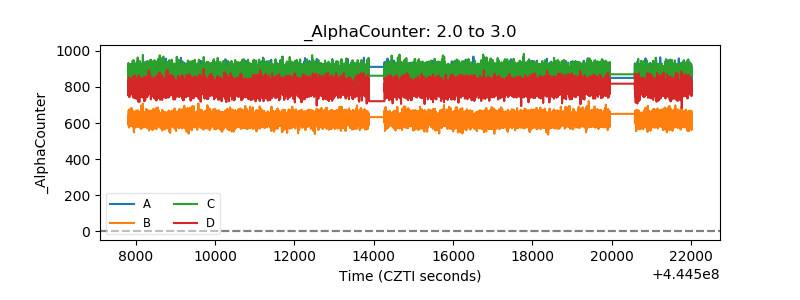 |
| _CPM_Rate | 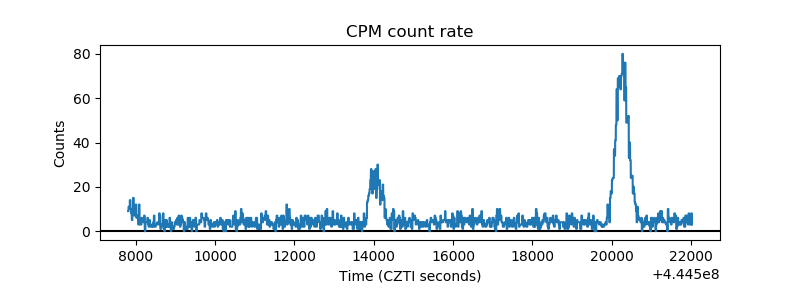 |
| CZT Counter | 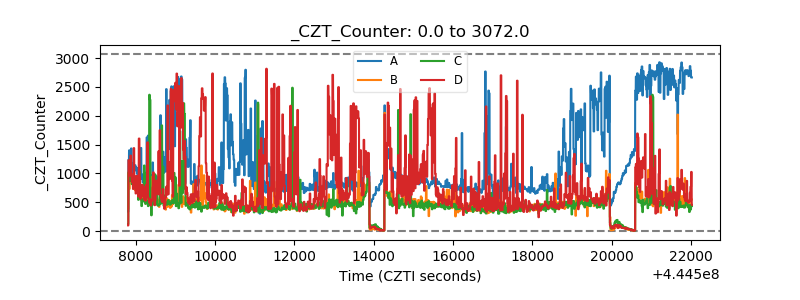 |
| +2.5 Volts monitor | 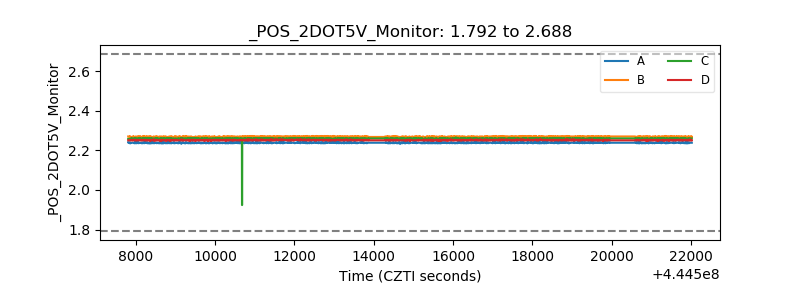 |
| +5 Volts monitor | 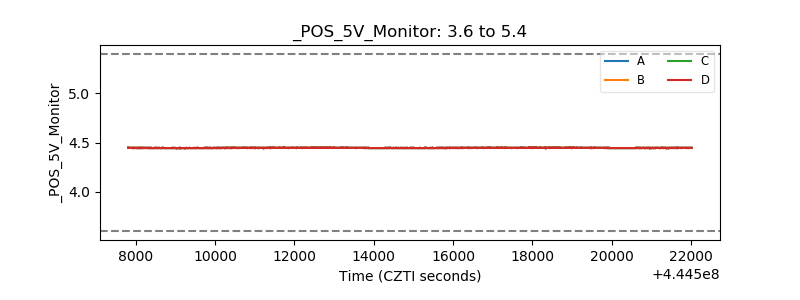 |
| _ROLL_ROT | 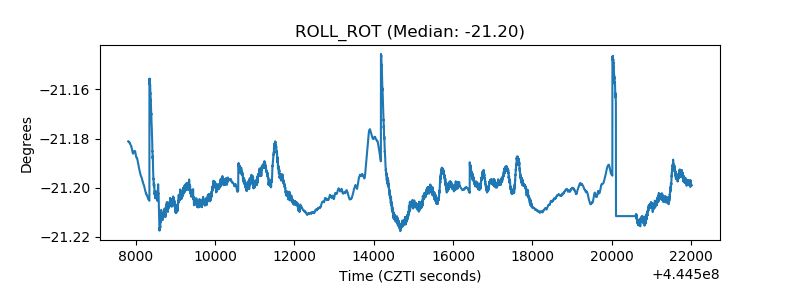 |
| _Roll_DEC | 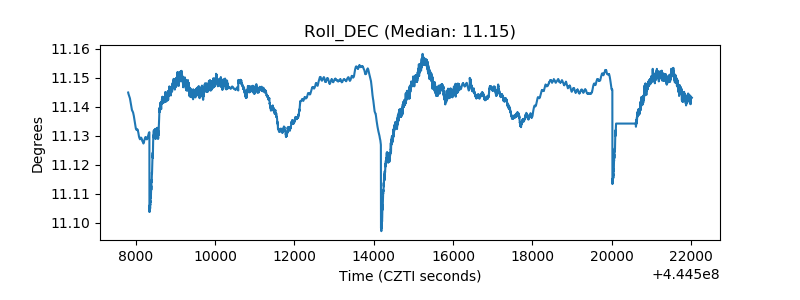 |
| _Roll_RA | 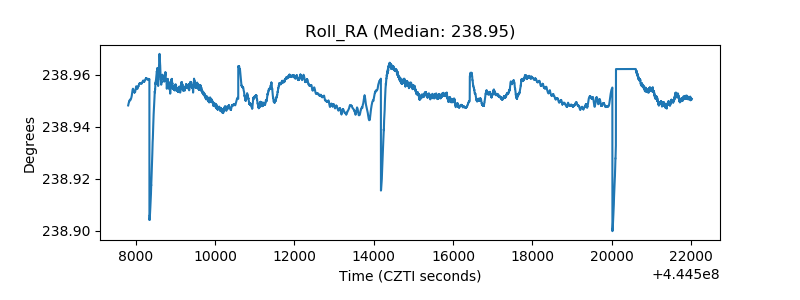 |
| Veto Counter | 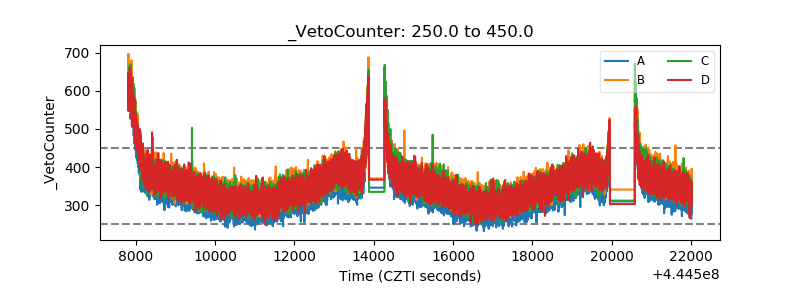 |