| Param | Original file | Final file |
|---|---|---|
| Filename | modeM0/AS1A13_017T02_9000006046_45138cztM0_level2.fits | modeM0/AS1A13_017T02_9000006046_45138cztM0_level2_quad_clean.evt |
| Size (bytes) | 1,725,269,760 | 249,042,240 |
| Size | 1.6 GB | 237.5 MB |
| Events in quadrant A | 31,300,171 | 1,049,773 |
| Events in quadrant B | 8,932,020 | 1,900,050 |
| Events in quadrant C | 9,729,616 | 1,793,405 |
| Events in quadrant D | 12,560,204 | 1,599,528 |
| Mode M0 | |||
|---|---|---|---|
| Quadrant | BADHDUFLAG | Total packets | Discarded packets |
| A | 0 | 104903 | 2 |
| B | 0 | 38684 | 2 |
| C | 0 | 41417 | 2 |
| D | 0 | 49407 | 2 |
| Mode M9 | |||
|---|---|---|---|
| Quadrant | BADHDUFLAG | Total packets | Discarded packets |
| A | 0 | 29 | 0 |
| B | 0 | 29 | 0 |
| C | 0 | 29 | 0 |
| D | 0 | 29 | 0 |
| Mode SS | |||
|---|---|---|---|
| Quadrant | BADHDUFLAG | Total packets | Discarded packets |
| A | 0 | 350 | 0 |
| B | 0 | 350 | 0 |
| C | 0 | 350 | 0 |
| D | 0 | 350 | 0 |
| Quadrant | Total seconds | Saturated seconds | Saturation percentage |
|---|---|---|---|
| A | 17372 | 8145 | 46.885793% |
| B | 17372 | 410 | 2.360120% |
| C | 17373 | 629 | 3.620561% |
| D | 17373 | 964 | 5.548840% |
Noise dominated data is calculated using 1-second bins in cleaned event files. If a bin has >2000 counts, and if more than 50% of those come from <1% of pixels, then it is considered to be noise-dominated and hence unusable.
| Quadrant | # 1 sec bins | Bins with >0 counts | Bins with >2000 counts | High rate bins dominated by noise | Noise dominated (total time) | Noise dominated (detector-on time) | Marked lightcurve |
|---|---|---|---|---|---|---|---|
| A | 20142 | 17373 | 7108 | 7108 | 35.29% | 40.91% | 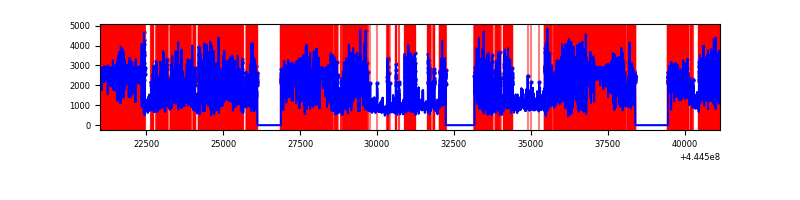 |
| B | 20142 | 17374 | 163 | 163 | 0.81% | 0.94% | 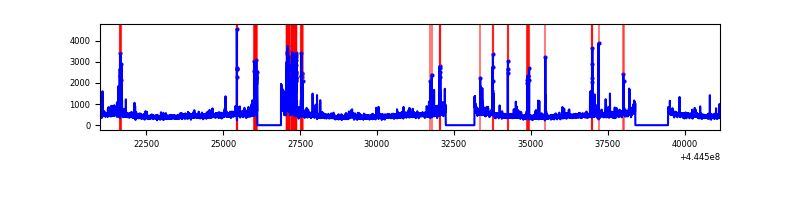 |
| C | 20143 | 17375 | 456 | 456 | 2.26% | 2.62% | 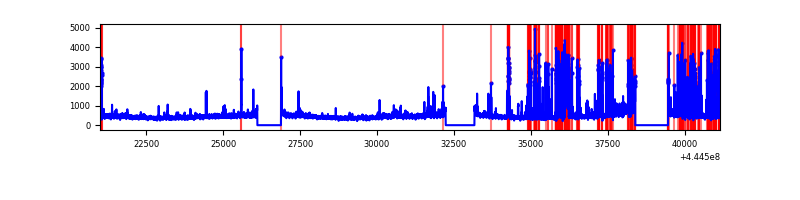 |
| D | 20143 | 17376 | 790 | 790 | 3.92% | 4.55% | 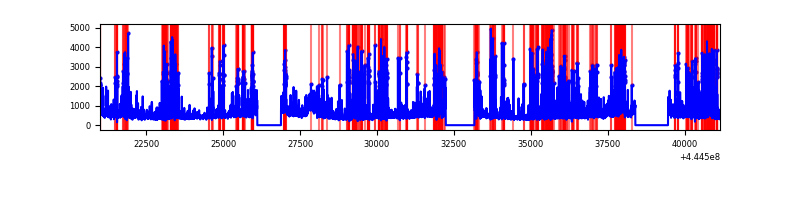 |
Top three noisy pixels from each quadrant. If the there are fewer than three noisy pixels in the level2.evt file, extra rows are filled as -1
| Pixel properties | Quadrant properties | ||||||
|---|---|---|---|---|---|---|---|
| Quadrant | DetID | PixID | Counts | Sigma | Mean | Median | Sigma |
| A | 15 | 223 | 20583563 | 68265.3 | 1473 | 1444 | 301.5 |
| A | 10 | 83 | 4636213 | 15372.27 | 1473 | 1444 | 301.5 |
| A | 13 | 248 | 383590 | 1267.47 | 1473 | 1444 | 301.5 |
| B | 3 | 112 | 435205 | 1128.04 | 1944 | 1888 | 384.1 |
| B | 4 | 170 | 215695 | 556.6 | 1944 | 1888 | 384.1 |
| B | 0 | 183 | 190961 | 492.21 | 1944 | 1888 | 384.1 |
| C | 14 | 254 | 1937910 | 4360.93 | 1891 | 1904 | 443.9 |
| C | 12 | 2 | 146276 | 325.2 | 1891 | 1904 | 443.9 |
| C | 1 | 3 | 69229 | 151.65 | 1891 | 1904 | 443.9 |
| D | 13 | 249 | 1974633 | 4176.4 | 1869 | 1811 | 472.4 |
| D | 13 | 29 | 700417 | 1478.92 | 1869 | 1811 | 472.4 |
| D | 5 | 235 | 666856 | 1407.88 | 1869 | 1811 | 472.4 |
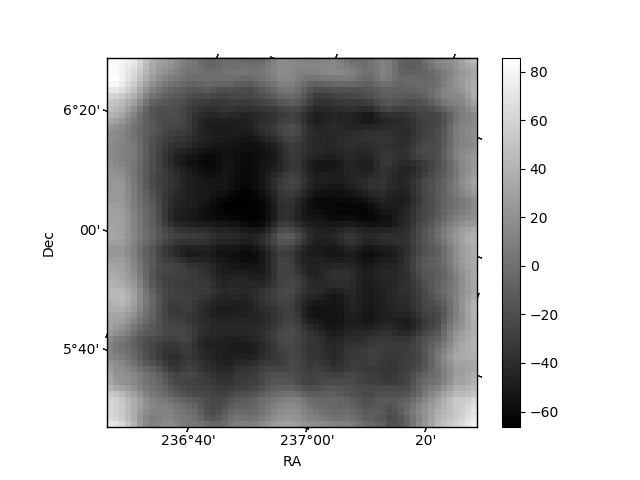
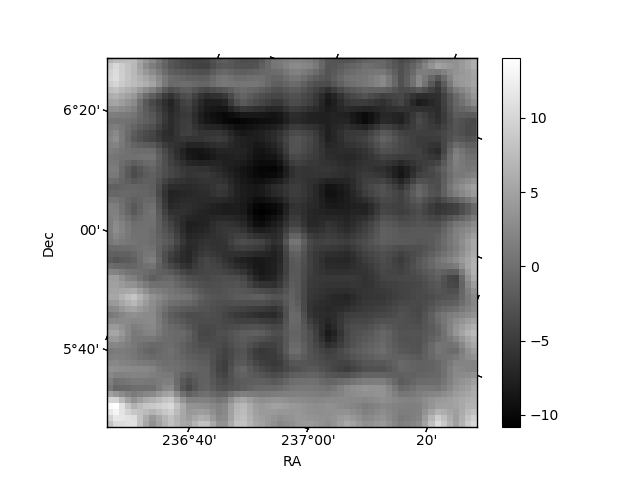
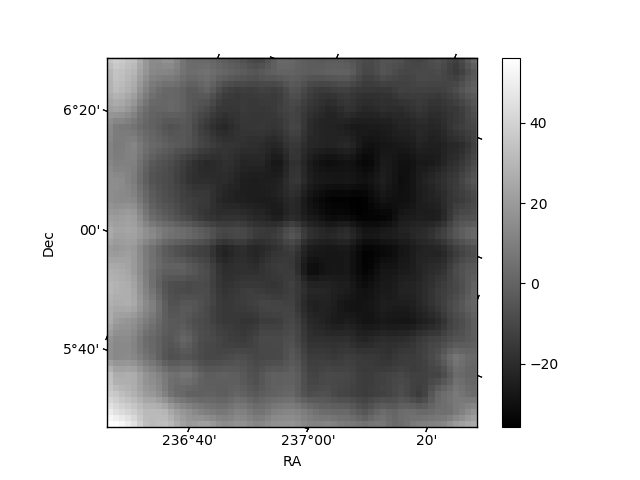
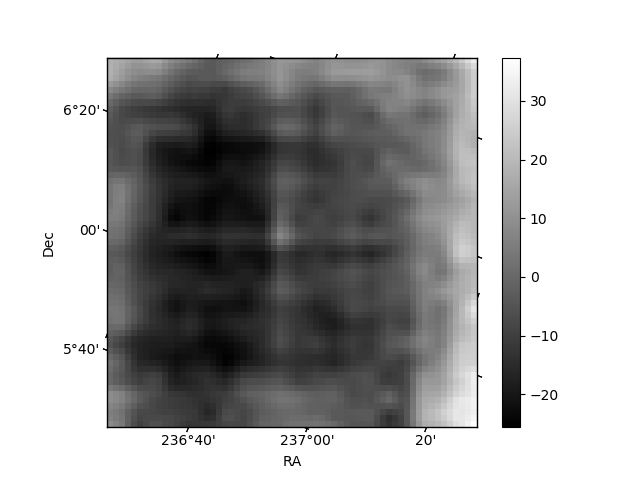
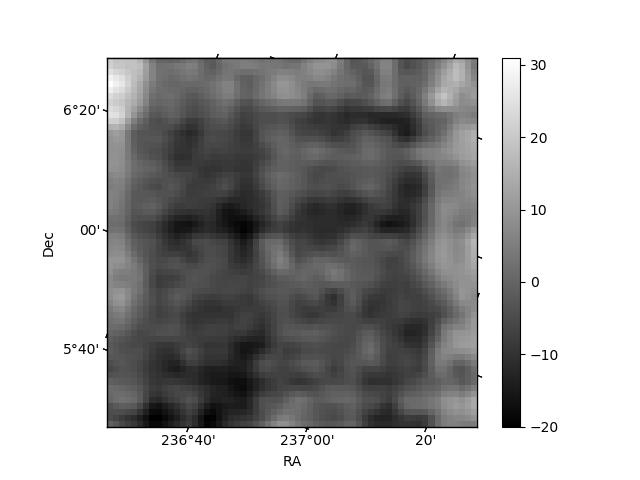
Histogram calculated using DETX and DETY for each event in the final _common_clean file
| Quadrant A | 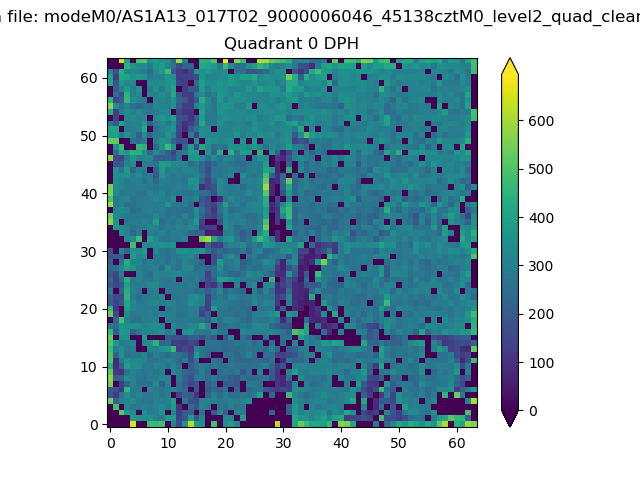 |
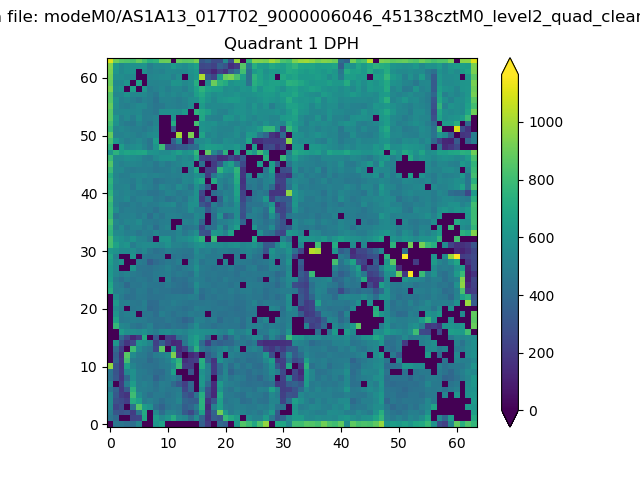 |
Quadrant B |
|---|---|---|---|
| Quadrant D | 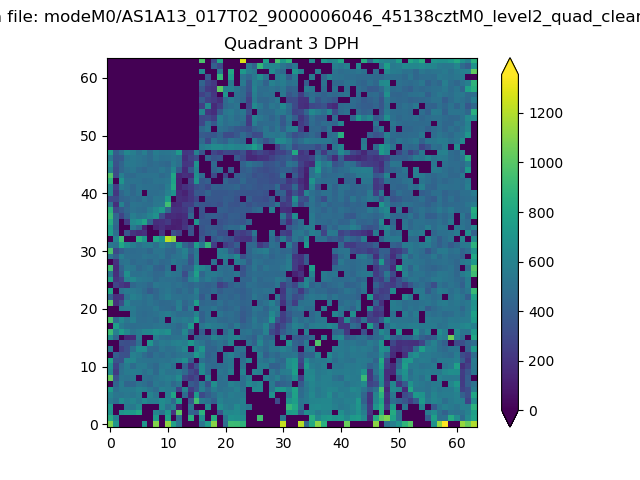 |
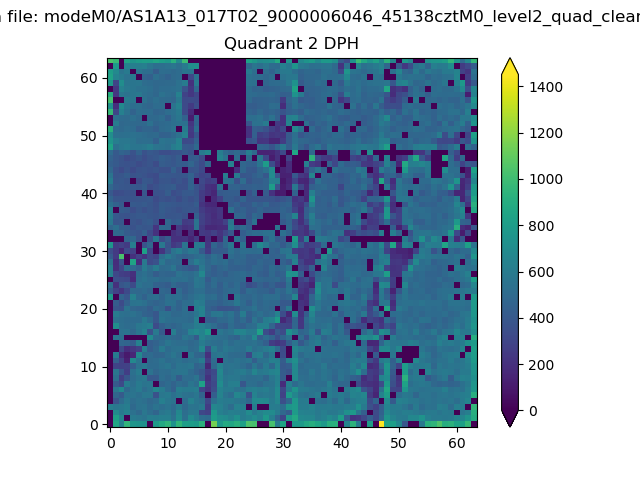 |
Quadrant C |
| Plot type | Count rate plots | Images |
|---|---|---|
| Comparison with Poisson distribution Blue bars denote a histogram of data divided into 1 sec bins. Red curve is a Poisson curve with rate = median count rate of data. |
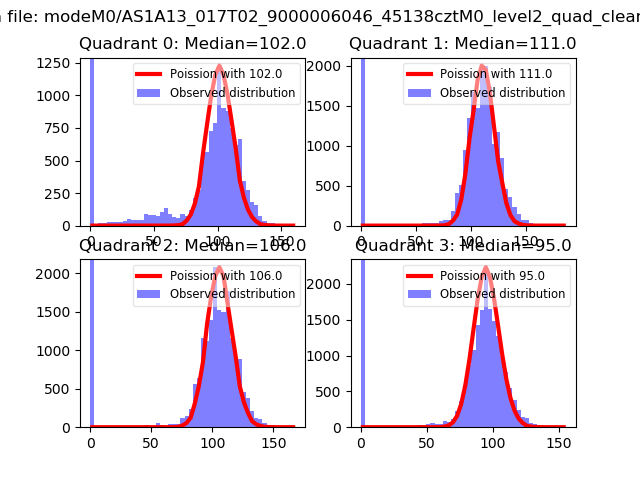 |
 |
| Quadrant-wise count rates Data is divided into 100 sec bins |
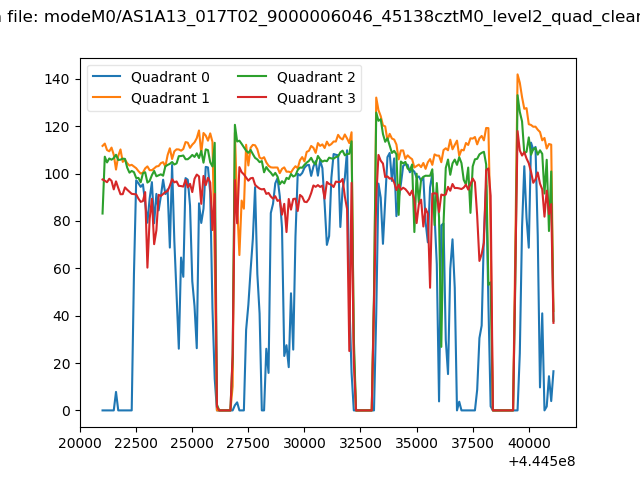 |
|
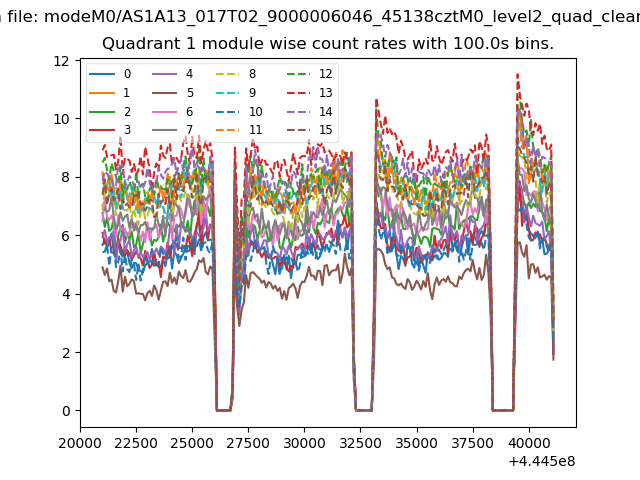
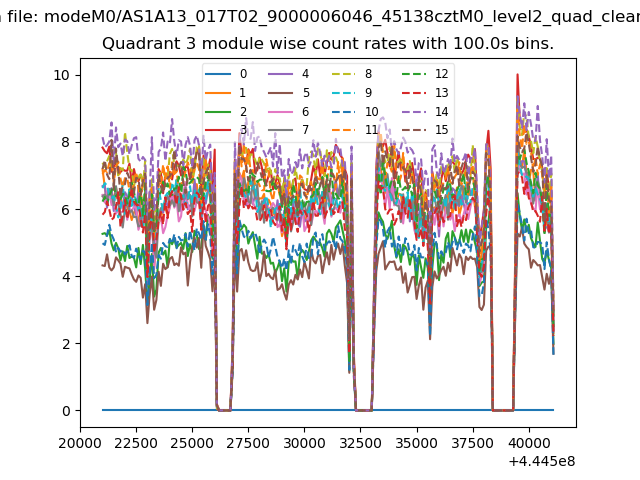
| Module-wise count rates for Quadrant A Data is divided into 100 sec bins |
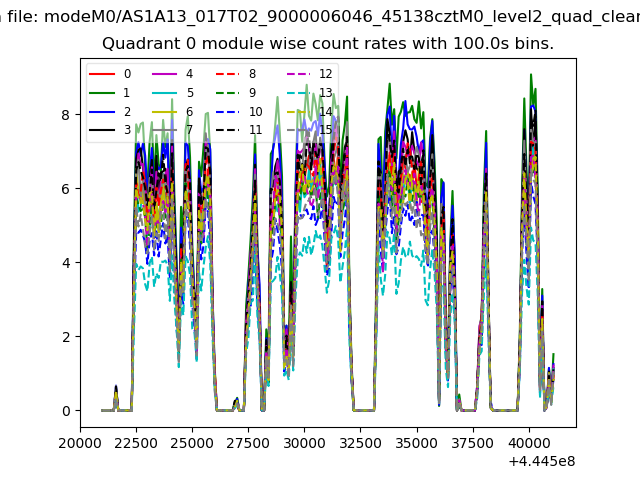 |
 |
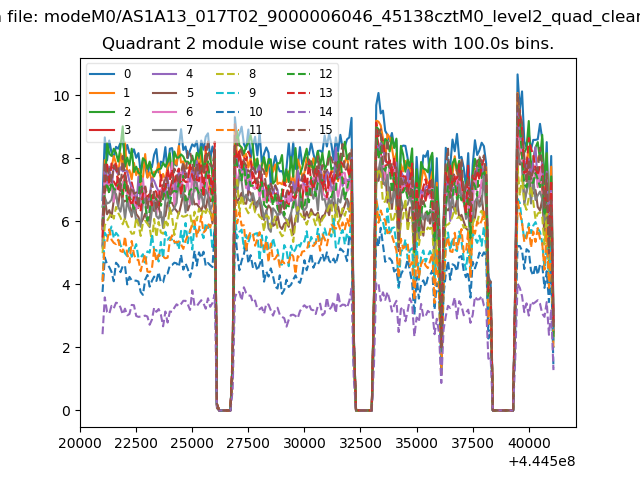
| Module-wise count rates for Quadrant B Data is divided into 100 sec bins |
 |
 |
| Module-wise count rates for Quadrant C Data is divided into 100 sec bins |
 |
 |
| Module-wise count rates for Quadrant D Data is divided into 100 sec bins |
 |
 |
| Parameter | Plot |
|---|---|
| CZT HV Monitor |  |
| D_VDD | 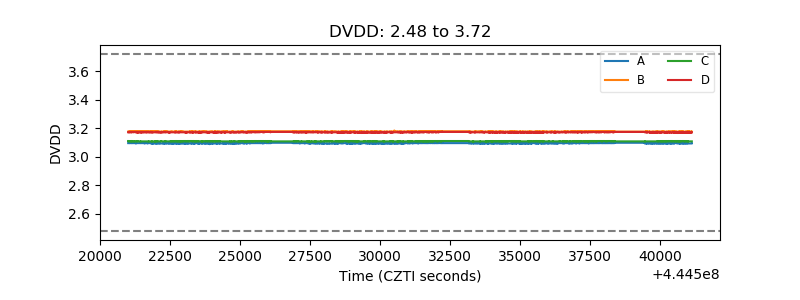 |
| Temperature 1 | 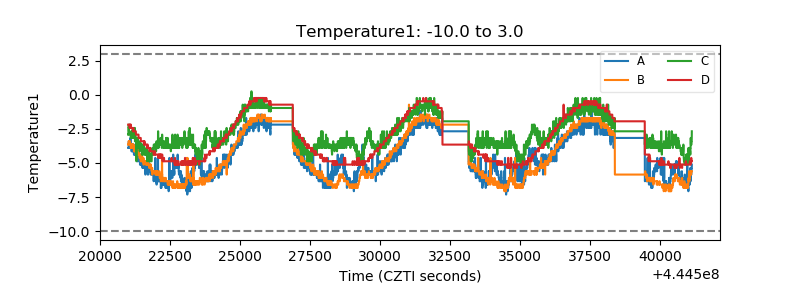 |
| Veto HV Monitor | 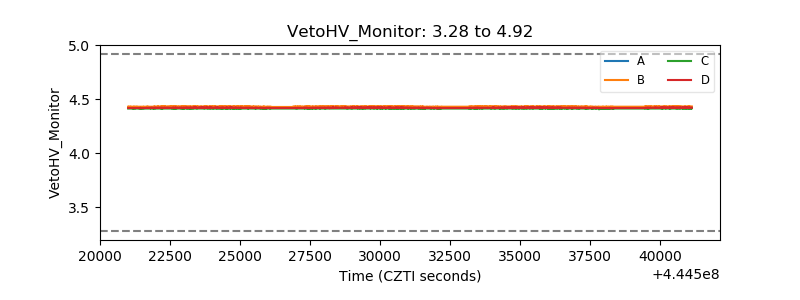 |
| Veto LLD | 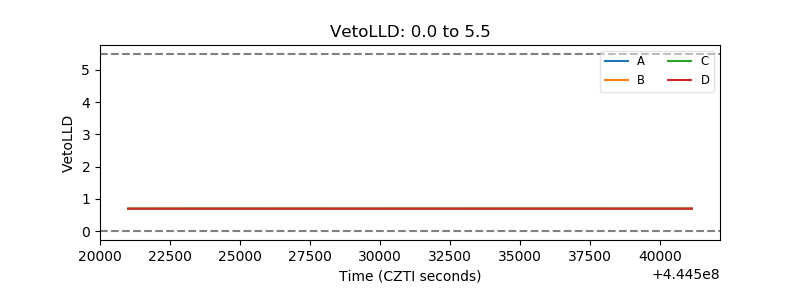 |
| Alpha Counter | 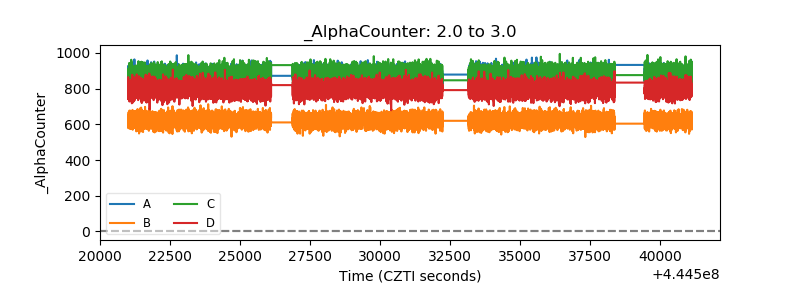 |
| _CPM_Rate | 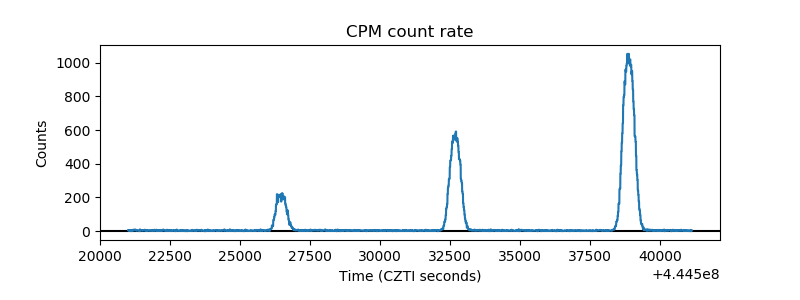 |
| CZT Counter | 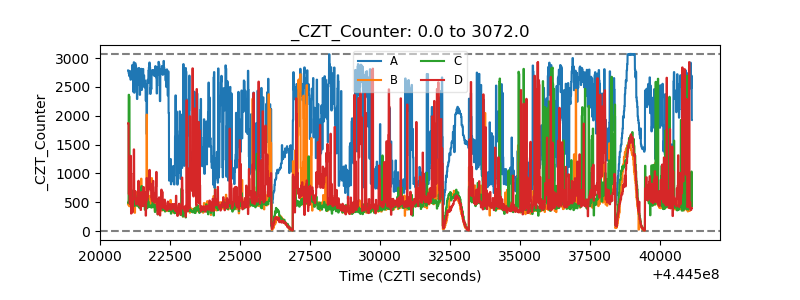 |
| +2.5 Volts monitor | 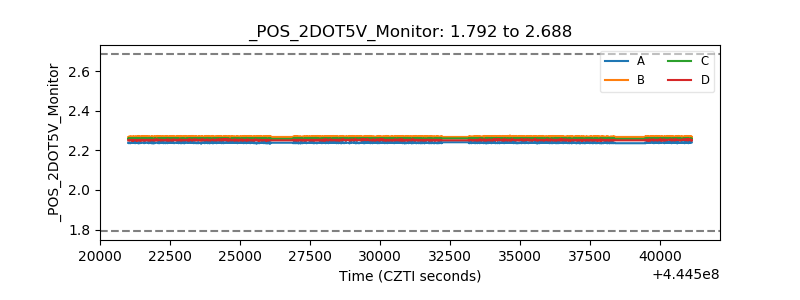 |
| +5 Volts monitor | 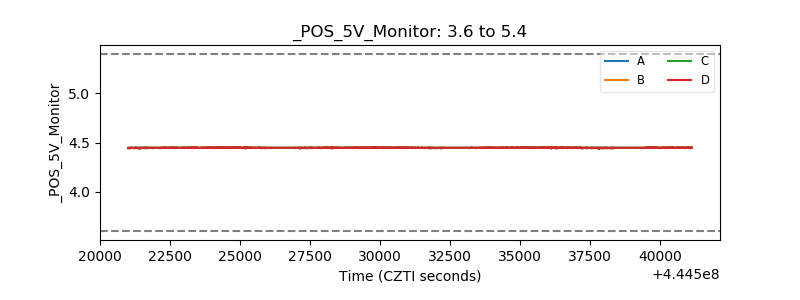 |
| _ROLL_ROT | 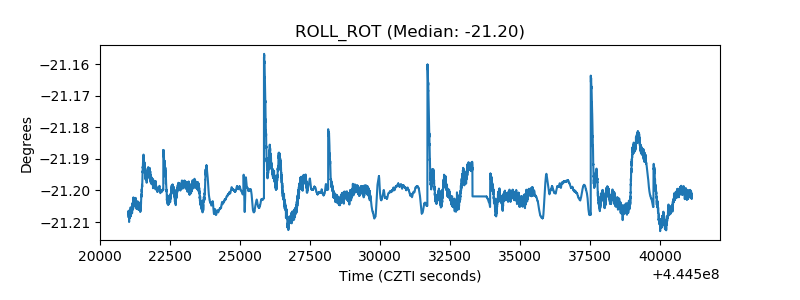 |
| _Roll_DEC | 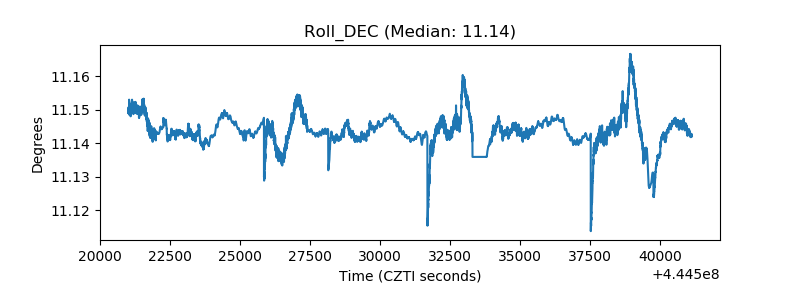 |
| _Roll_RA | 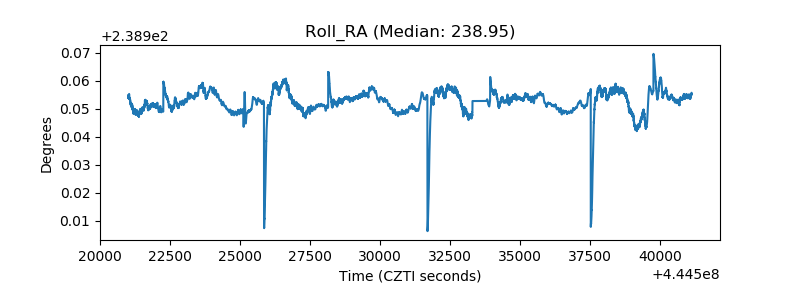 |
| Veto Counter | 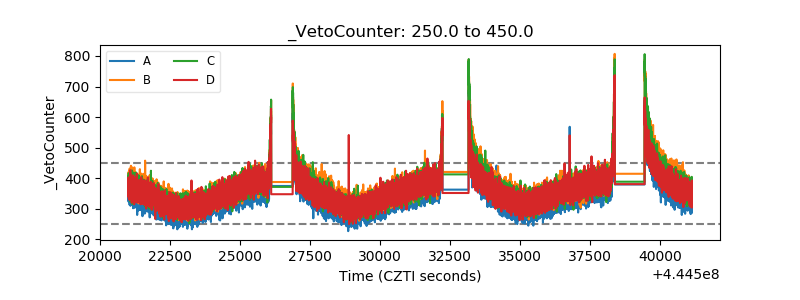 |