| Param | Original file | Final file |
|---|---|---|
| Filename | modeM0/AS1A13_017T02_9000006046_45139cztM0_level2.fits | modeM0/AS1A13_017T02_9000006046_45139cztM0_level2_quad_clean.evt |
| Size (bytes) | 612,118,080 | 97,202,880 |
| Size | 583.8 MB | 92.7 MB |
| Events in quadrant A | 10,870,409 | 452,902 |
| Events in quadrant B | 3,039,938 | 746,483 |
| Events in quadrant C | 3,556,431 | 697,159 |
| Events in quadrant D | 4,704,325 | 608,003 |
| Mode M0 | |||
|---|---|---|---|
| Quadrant | BADHDUFLAG | Total packets | Discarded packets |
| A | 0 | 36545 | 1 |
| B | 0 | 13292 | 1 |
| C | 0 | 14932 | 1 |
| D | 0 | 18350 | 1 |
| Mode M9 | |||
|---|---|---|---|
| Quadrant | BADHDUFLAG | Total packets | Discarded packets |
| A | 0 | 12 | 0 |
| B | 0 | 12 | 0 |
| C | 0 | 12 | 0 |
| D | 0 | 12 | 0 |
| Mode SS | |||
|---|---|---|---|
| Quadrant | BADHDUFLAG | Total packets | Discarded packets |
| A | 0 | 128 | 0 |
| B | 0 | 128 | 0 |
| C | 0 | 128 | 0 |
| D | 0 | 128 | 0 |
| Quadrant | Total seconds | Saturated seconds | Saturation percentage |
|---|---|---|---|
| A | 6282 | 2613 | 41.595033% |
| B | 6282 | 44 | 0.700414% |
| C | 6283 | 190 | 3.024033% |
| D | 6283 | 434 | 6.907528% |
Noise dominated data is calculated using 1-second bins in cleaned event files. If a bin has >2000 counts, and if more than 50% of those come from <1% of pixels, then it is considered to be noise-dominated and hence unusable.
| Quadrant | # 1 sec bins | Bins with >0 counts | Bins with >2000 counts | High rate bins dominated by noise | Noise dominated (total time) | Noise dominated (detector-on time) | Marked lightcurve |
|---|---|---|---|---|---|---|---|
| A | 7467 | 6282 | 2302 | 2302 | 30.83% | 36.64% | 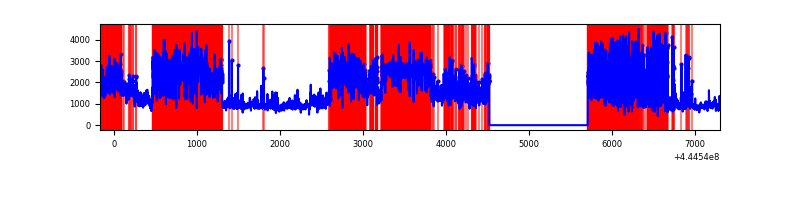 |
| B | 7467 | 6283 | 12 | 12 | 0.16% | 0.19% | 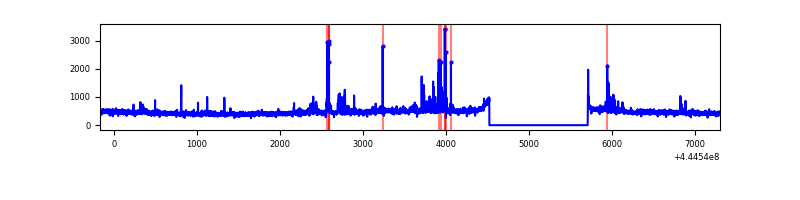 |
| C | 7468 | 6284 | 168 | 168 | 2.25% | 2.67% | 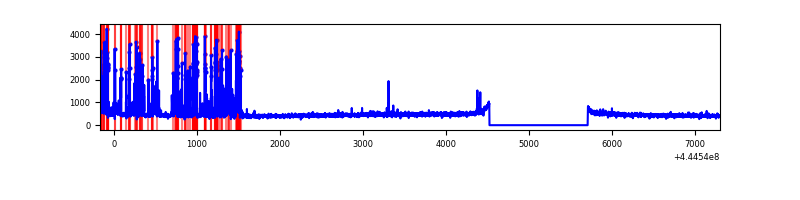 |
| D | 7468 | 6284 | 308 | 308 | 4.12% | 4.90% | 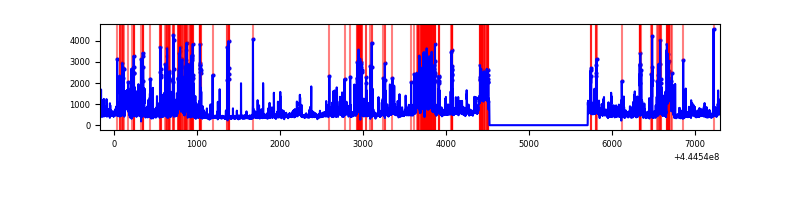 |
Top three noisy pixels from each quadrant. If the there are fewer than three noisy pixels in the level2.evt file, extra rows are filled as -1
| Pixel properties | Quadrant properties | ||||||
|---|---|---|---|---|---|---|---|
| Quadrant | DetID | PixID | Counts | Sigma | Mean | Median | Sigma |
| A | 15 | 223 | 6624763 | 54376.9 | 593 | 582 | 121.8 |
| A | 10 | 83 | 1896859 | 15566.25 | 593 | 582 | 121.8 |
| A | 13 | 248 | 57453 | 466.85 | 593 | 582 | 121.8 |
| B | 4 | 170 | 84121 | 586.6 | 720 | 696 | 142.2 |
| B | 0 | 186 | 43814 | 303.18 | 720 | 696 | 142.2 |
| B | 10 | 3 | 26692 | 182.79 | 720 | 696 | 142.2 |
| C | 14 | 254 | 783241 | 4763.36 | 698 | 704 | 164.3 |
| C | 12 | 2 | 17040 | 99.44 | 698 | 704 | 164.3 |
| C | 11 | 16 | 8063 | 44.79 | 698 | 704 | 164.3 |
| D | 13 | 249 | 658501 | 3840.56 | 680 | 659 | 171.3 |
| D | 13 | 29 | 429099 | 2501.28 | 680 | 659 | 171.3 |
| D | 1 | 52 | 202865 | 1180.5 | 680 | 659 | 171.3 |
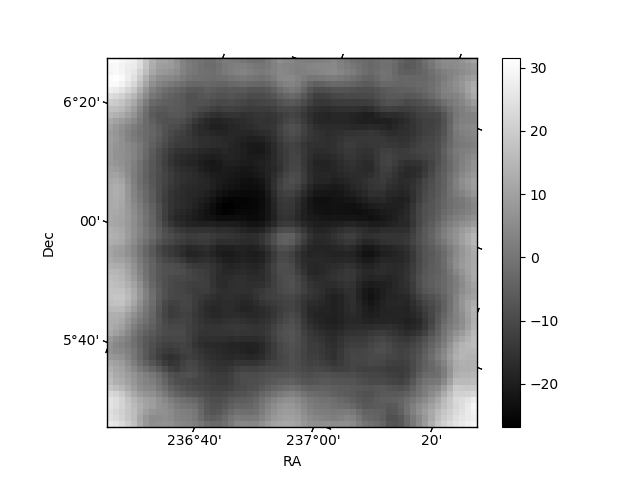
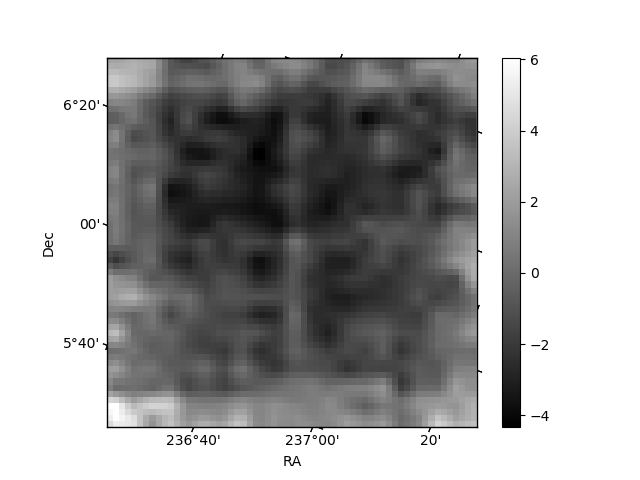
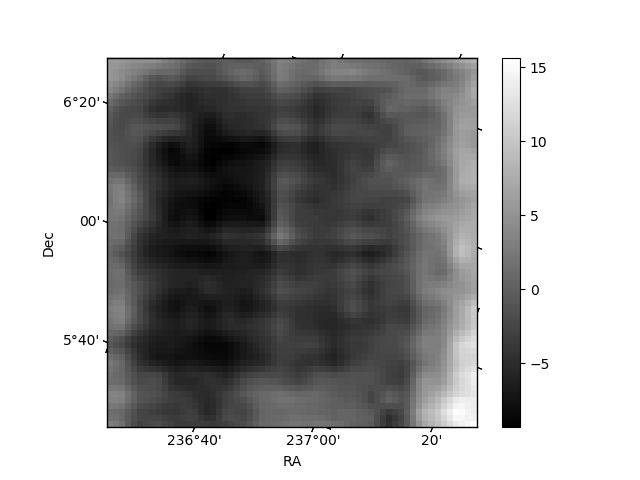
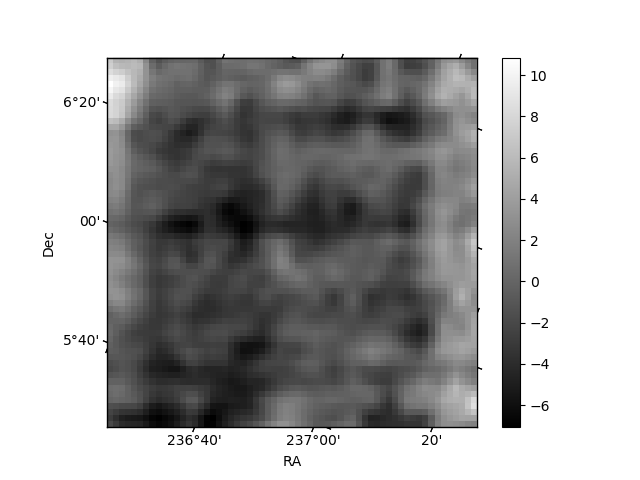
Histogram calculated using DETX and DETY for each event in the final _common_clean file
| Quadrant A | 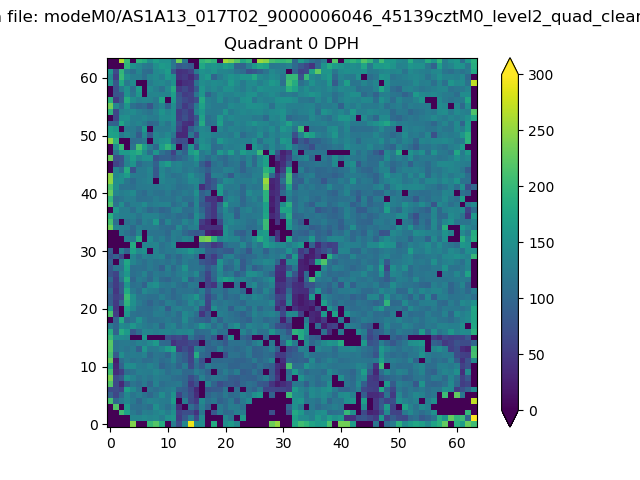 |
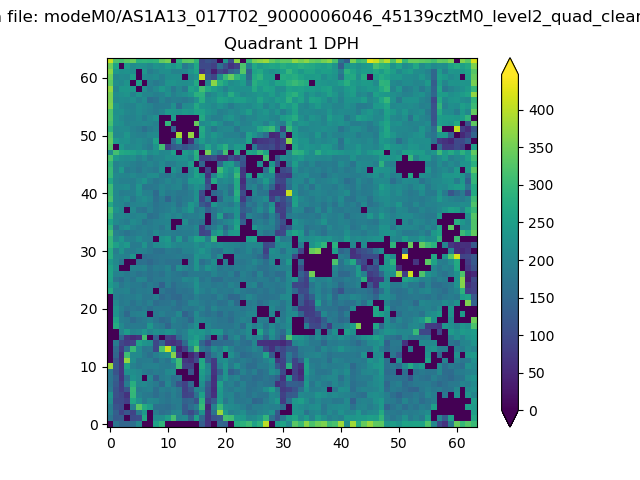 |
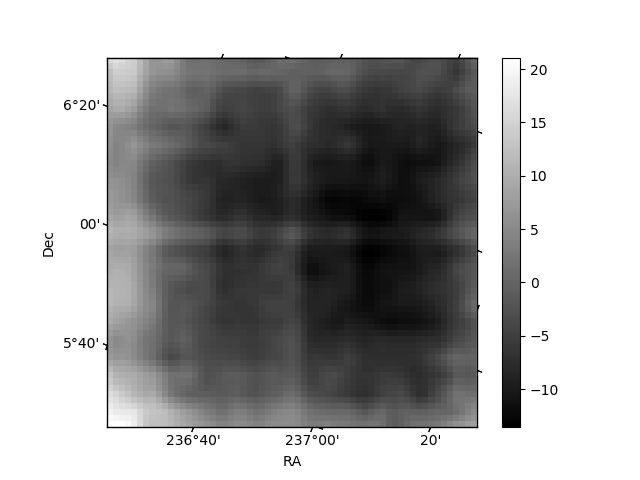
Quadrant B |
|---|---|---|---|
| Quadrant D | 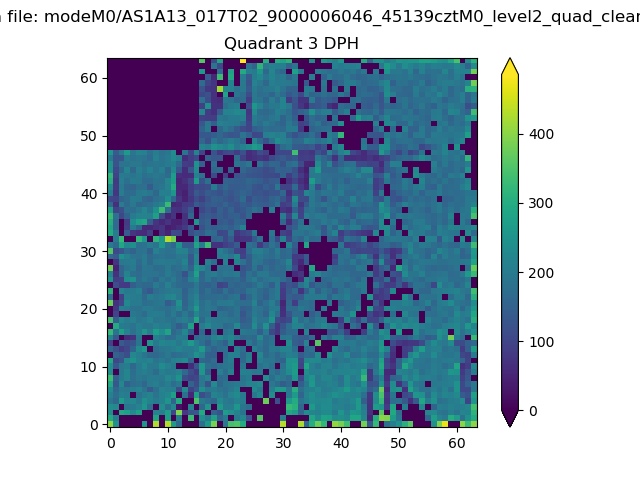 |
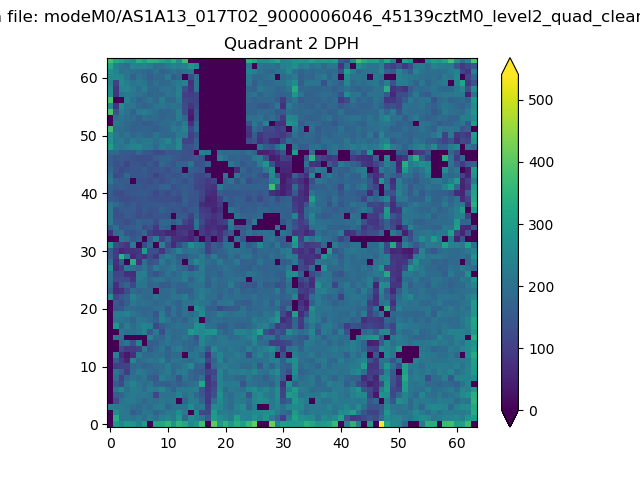 |
Quadrant C |
| Plot type | Count rate plots | Images |
|---|---|---|
| Comparison with Poisson distribution Blue bars denote a histogram of data divided into 1 sec bins. Red curve is a Poisson curve with rate = median count rate of data. |
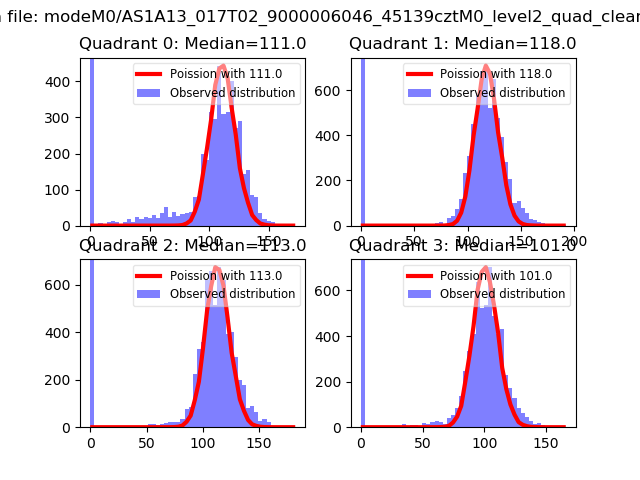 |
 |
| Quadrant-wise count rates Data is divided into 100 sec bins |
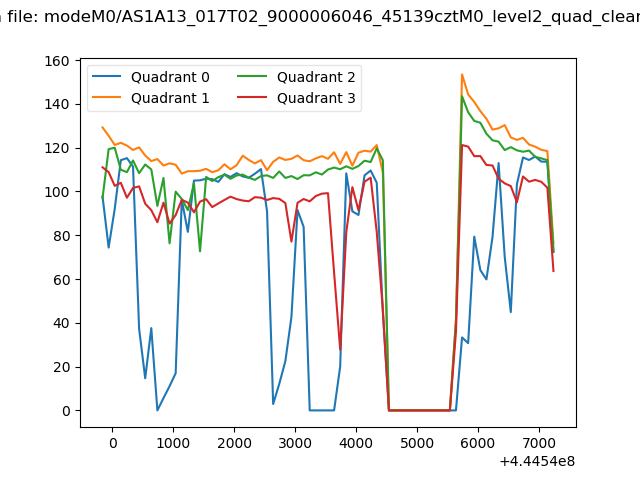 |
|
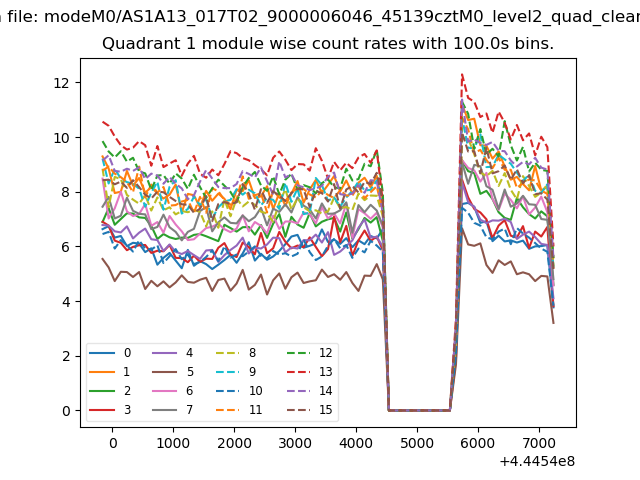
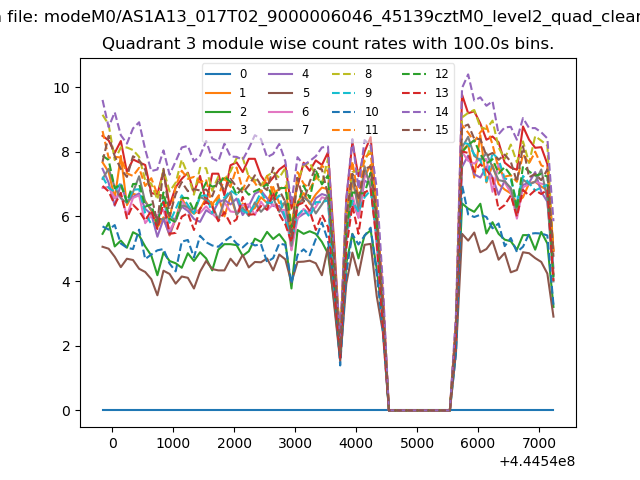
| Module-wise count rates for Quadrant A Data is divided into 100 sec bins |
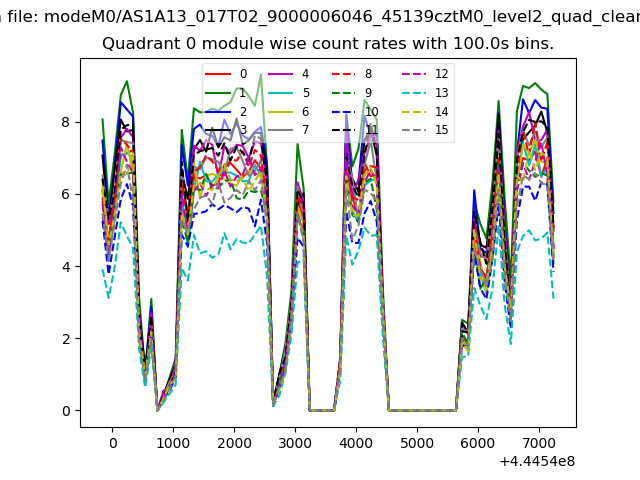 |
 |
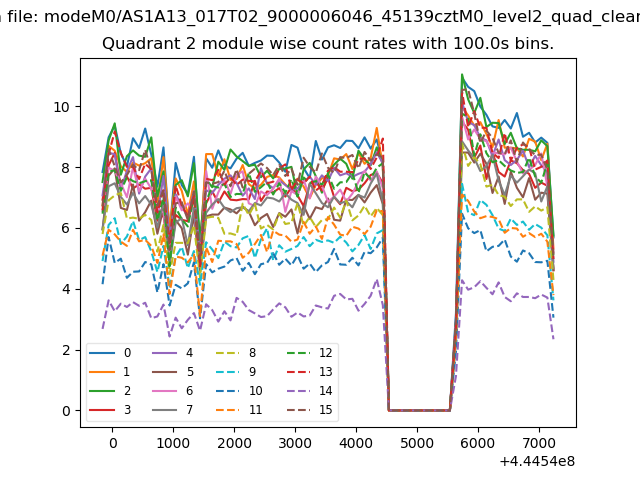
| Module-wise count rates for Quadrant B Data is divided into 100 sec bins |
 |
 |
| Module-wise count rates for Quadrant C Data is divided into 100 sec bins |
 |
 |
| Module-wise count rates for Quadrant D Data is divided into 100 sec bins |
 |
 |
| Parameter | Plot |
|---|---|
| CZT HV Monitor | 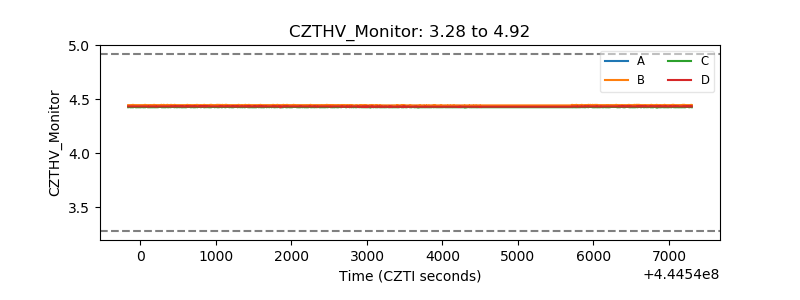 |
| D_VDD | 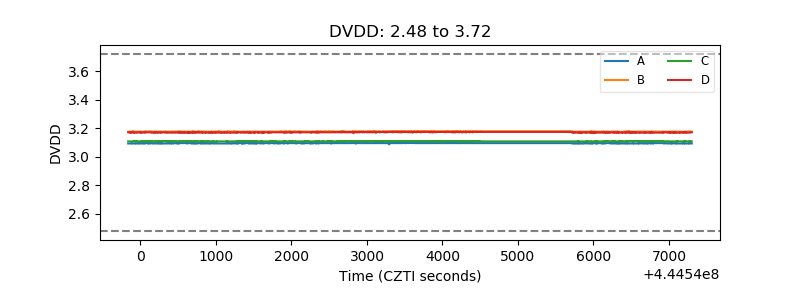 |
| Temperature 1 | 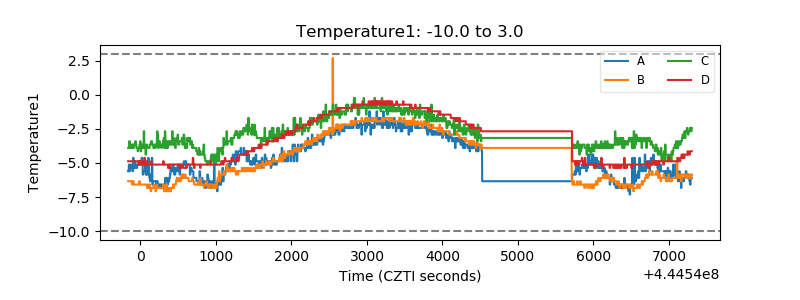 |
| Veto HV Monitor | 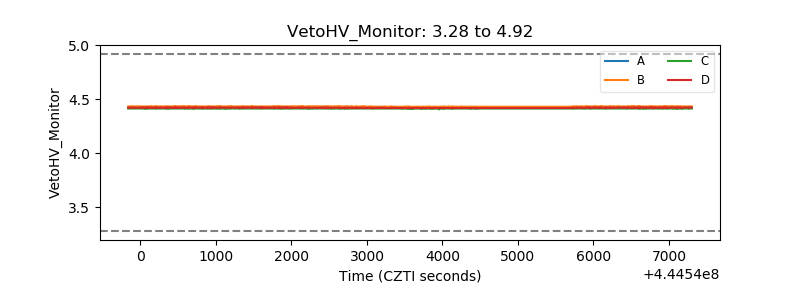 |
| Veto LLD | 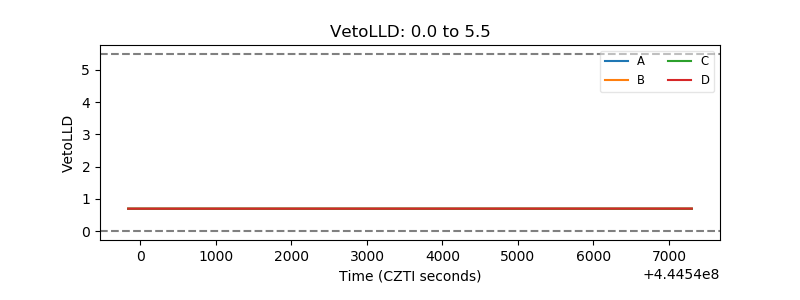 |
| Alpha Counter | 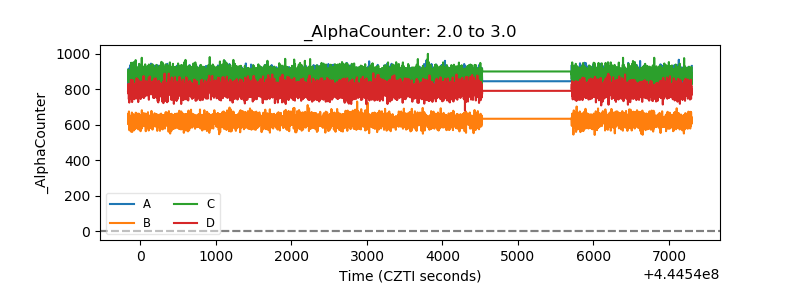 |
| _CPM_Rate | 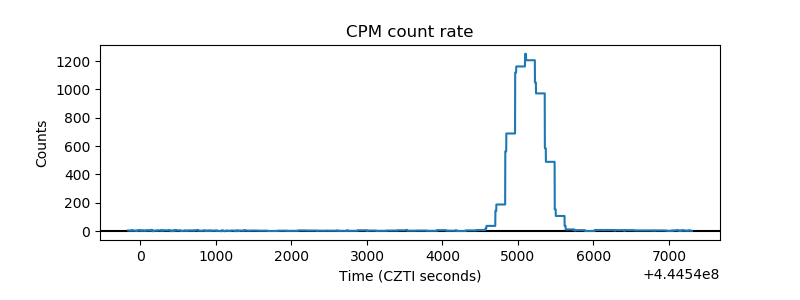 |
| CZT Counter | 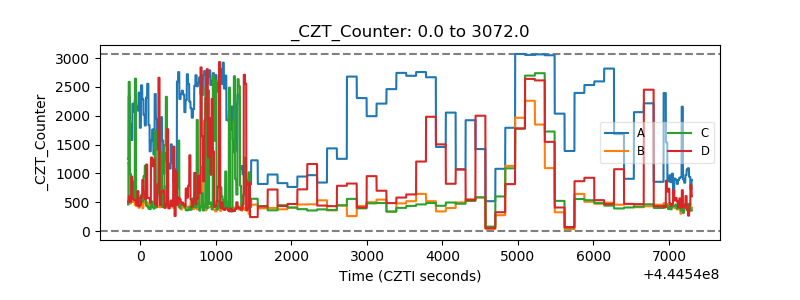 |
| +2.5 Volts monitor | 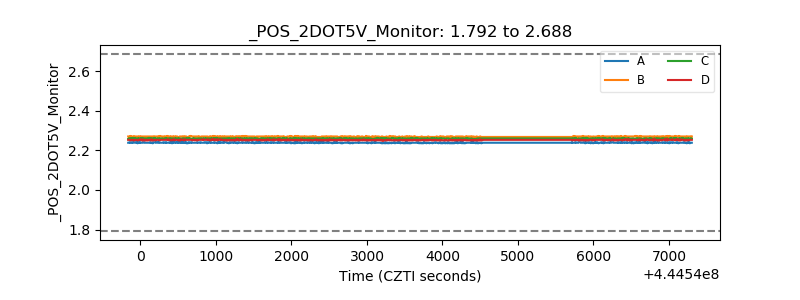 |
| +5 Volts monitor | 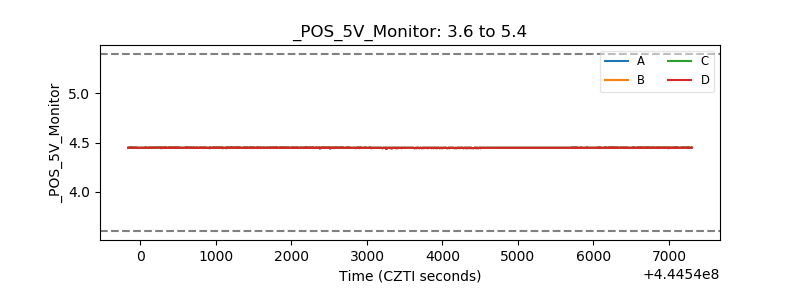 |
| _ROLL_ROT | 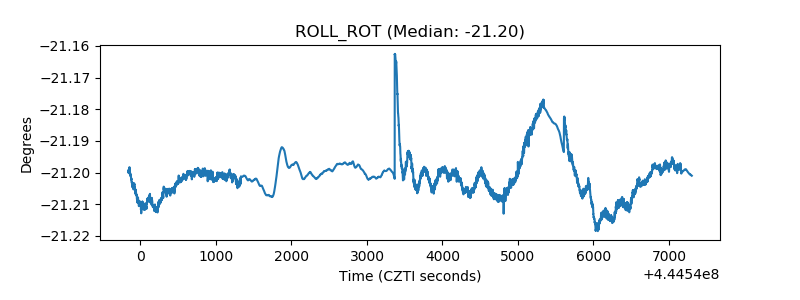 |
| _Roll_DEC |  |
| _Roll_RA | 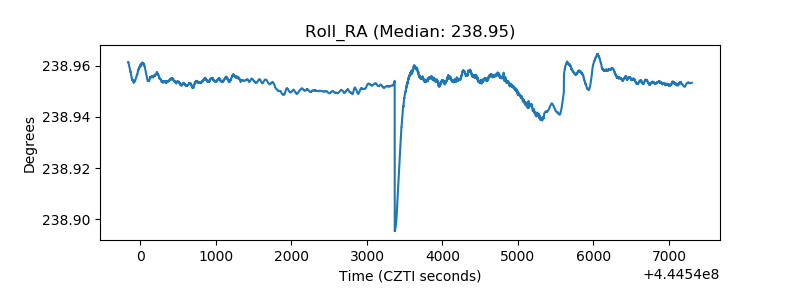 |
| Veto Counter | 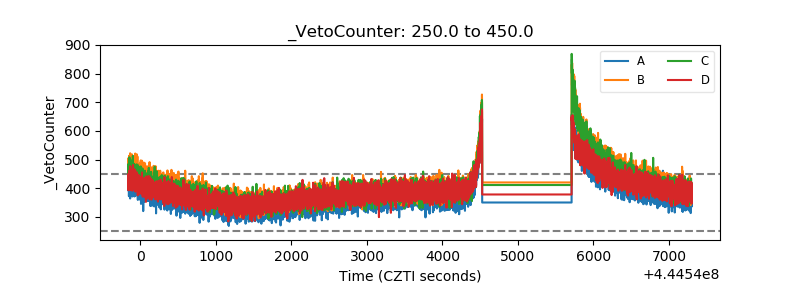 |