| Param | Original file | Final file |
|---|---|---|
| Filename | modeM0/AS1A13_017T02_9000006046_45140cztM0_level2.fits | modeM0/AS1A13_017T02_9000006046_45140cztM0_level2_quad_clean.evt |
| Size (bytes) | 627,284,160 | 101,111,040 |
| Size | 598.2 MB | 96.4 MB |
| Events in quadrant A | 10,112,241 | 527,006 |
| Events in quadrant B | 3,322,888 | 779,638 |
| Events in quadrant C | 3,967,453 | 696,862 |
| Events in quadrant D | 5,322,953 | 613,176 |
| Mode M0 | |||
|---|---|---|---|
| Quadrant | BADHDUFLAG | Total packets | Discarded packets |
| A | 0 | 34339 | 1 |
| B | 0 | 14096 | 1 |
| C | 0 | 16173 | 1 |
| D | 0 | 20185 | 1 |
| Mode M9 | |||
|---|---|---|---|
| Quadrant | BADHDUFLAG | Total packets | Discarded packets |
| A | 0 | 12 | 0 |
| B | 0 | 12 | 0 |
| C | 0 | 12 | 0 |
| D | 0 | 12 | 0 |
| Mode SS | |||
|---|---|---|---|
| Quadrant | BADHDUFLAG | Total packets | Discarded packets |
| A | 0 | 130 | 0 |
| B | 0 | 130 | 0 |
| C | 0 | 130 | 0 |
| D | 0 | 130 | 0 |
| Quadrant | Total seconds | Saturated seconds | Saturation percentage |
|---|---|---|---|
| A | 6374 | 2293 | 35.974270% |
| B | 6374 | 110 | 1.725761% |
| C | 6374 | 438 | 6.871666% |
| D | 6375 | 701 | 10.996078% |
Noise dominated data is calculated using 1-second bins in cleaned event files. If a bin has >2000 counts, and if more than 50% of those come from <1% of pixels, then it is considered to be noise-dominated and hence unusable.
| Quadrant | # 1 sec bins | Bins with >0 counts | Bins with >2000 counts | High rate bins dominated by noise | Noise dominated (total time) | Noise dominated (detector-on time) | Marked lightcurve |
|---|---|---|---|---|---|---|---|
| A | 7544 | 6375 | 1744 | 1744 | 23.12% | 27.36% | 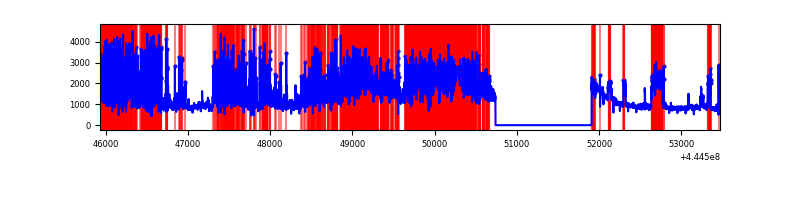 |
| B | 7544 | 6375 | 25 | 25 | 0.33% | 0.39% | 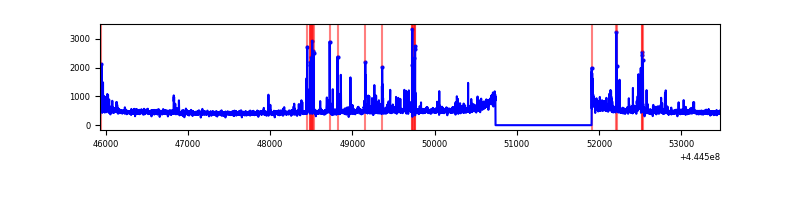 |
| C | 7543 | 6374 | 371 | 371 | 4.92% | 5.82% | 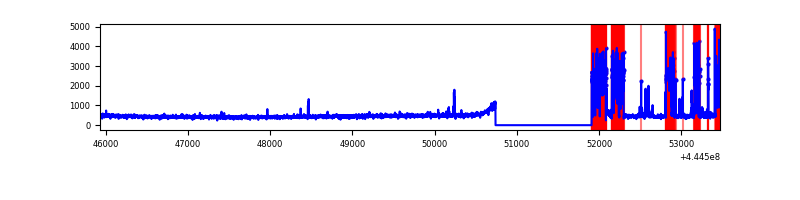 |
| D | 7545 | 6376 | 558 | 558 | 7.40% | 8.75% | 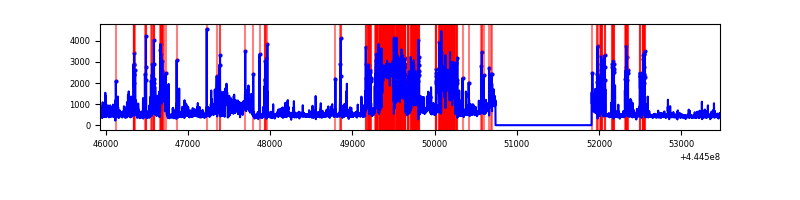 |
Top three noisy pixels from each quadrant. If the there are fewer than three noisy pixels in the level2.evt file, extra rows are filled as -1
| Pixel properties | Quadrant properties | ||||||
|---|---|---|---|---|---|---|---|
| Quadrant | DetID | PixID | Counts | Sigma | Mean | Median | Sigma |
| A | 15 | 223 | 5508209 | 40559.03 | 660 | 647 | 135.8 |
| A | 10 | 83 | 2054416 | 15124.46 | 660 | 647 | 135.8 |
| A | 3 | 137 | 7255 | 48.66 | 660 | 647 | 135.8 |
| B | 4 | 170 | 115220 | 771.25 | 755 | 732 | 148.4 |
| B | 0 | 186 | 48861 | 324.22 | 755 | 732 | 148.4 |
| B | 10 | 3 | 45216 | 299.67 | 755 | 732 | 148.4 |
| C | 12 | 2 | 1089206 | 6496.83 | 713 | 719 | 167.5 |
| C | 11 | 16 | 65400 | 386.06 | 713 | 719 | 167.5 |
| C | 14 | 254 | 15261 | 86.8 | 713 | 719 | 167.5 |
| D | 13 | 29 | 1216271 | 6799.79 | 702 | 680 | 178.8 |
| D | 13 | 174 | 392914 | 2194.08 | 702 | 680 | 178.8 |
| D | 13 | 249 | 329735 | 1840.67 | 702 | 680 | 178.8 |
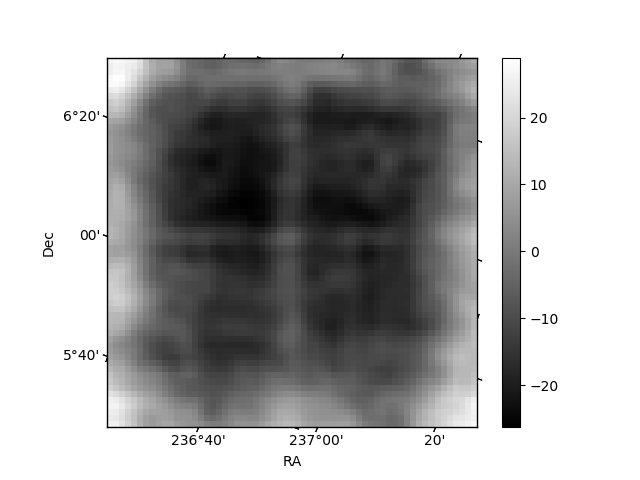
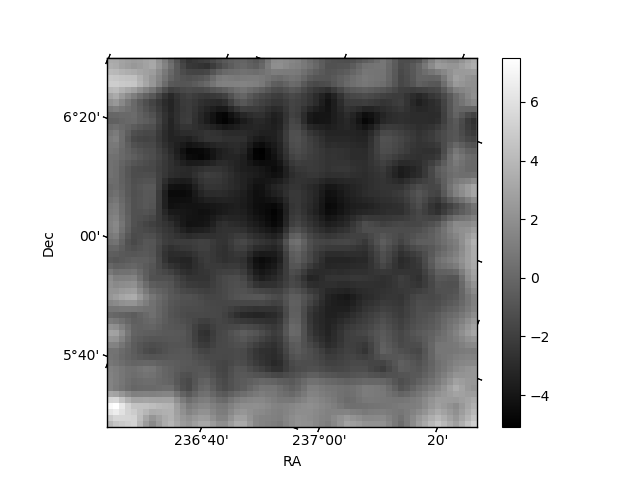
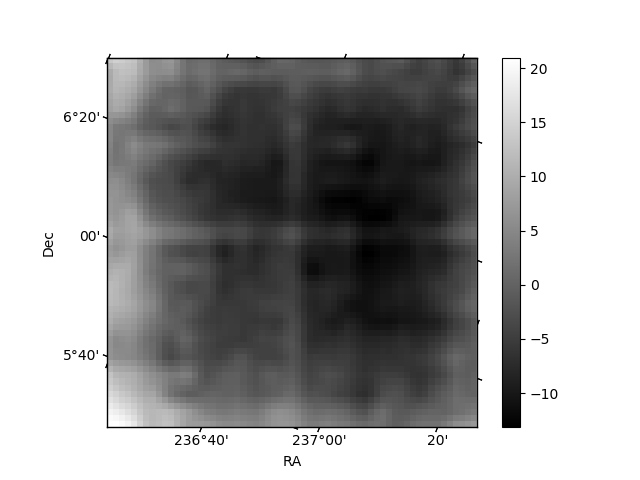
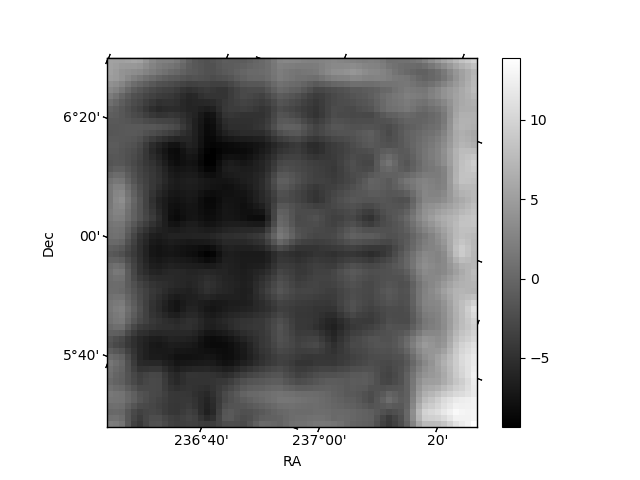
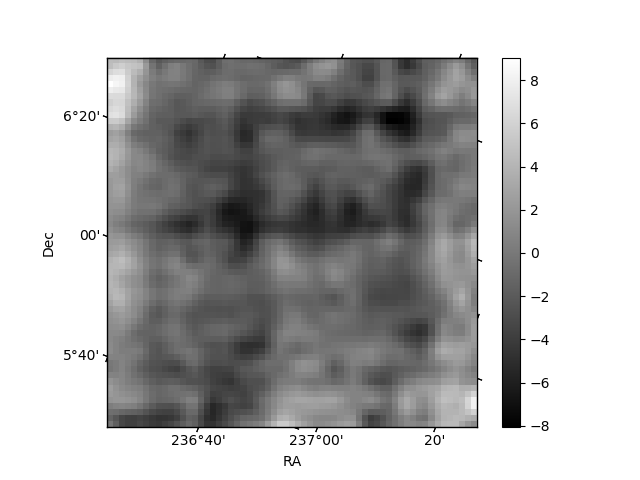
Histogram calculated using DETX and DETY for each event in the final _common_clean file
| Quadrant A | 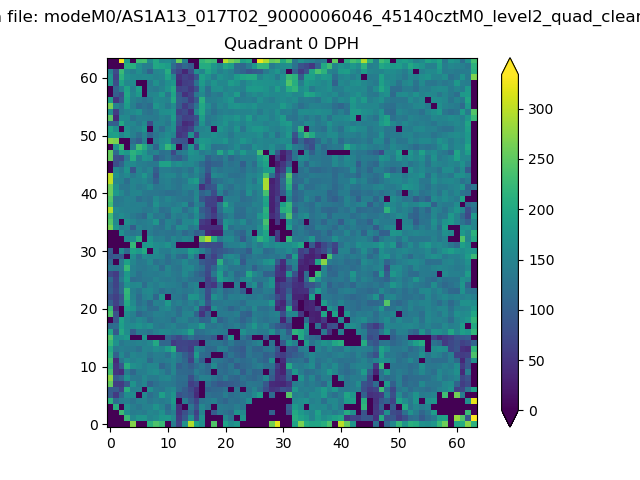 |
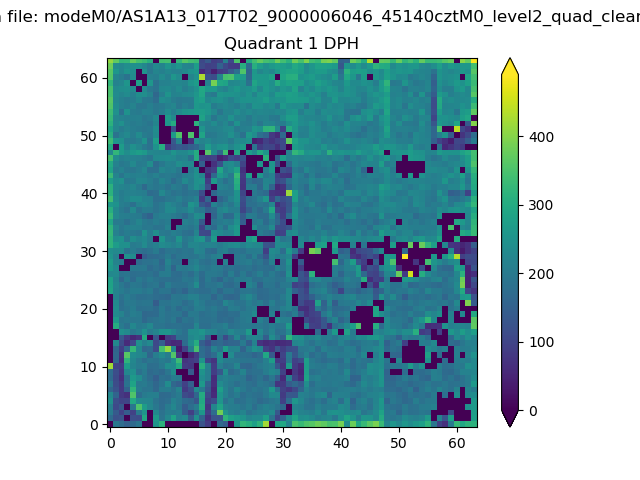 |
Quadrant B |
|---|---|---|---|
| Quadrant D | 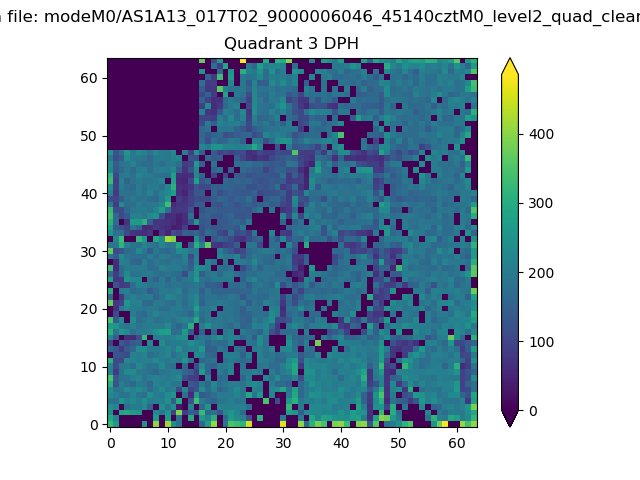 |
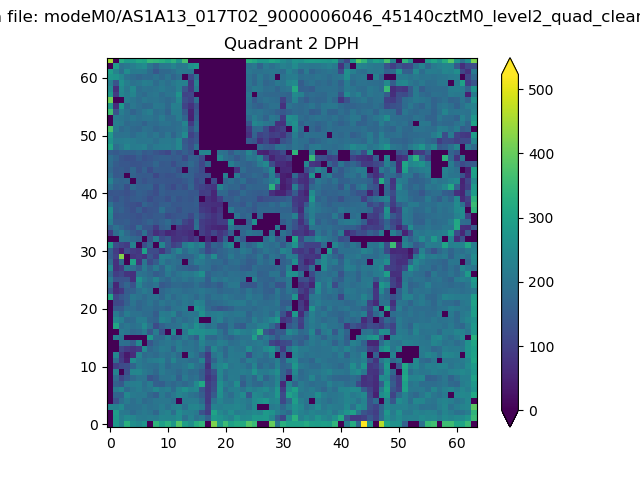 |
Quadrant C |
| Plot type | Count rate plots | Images |
|---|---|---|
| Comparison with Poisson distribution Blue bars denote a histogram of data divided into 1 sec bins. Red curve is a Poisson curve with rate = median count rate of data. |
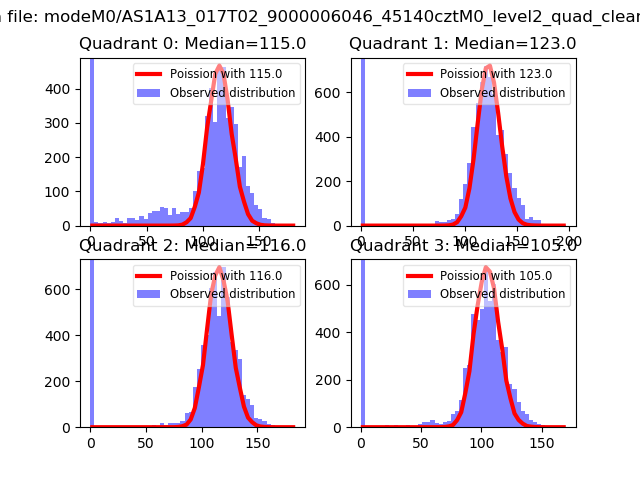 |
 |
| Quadrant-wise count rates Data is divided into 100 sec bins |
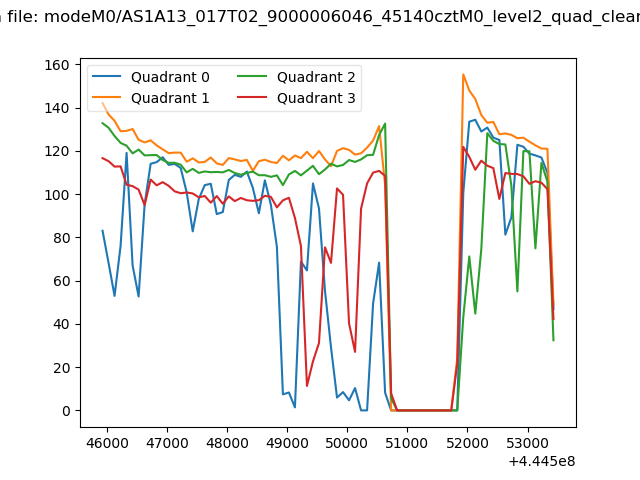 |
|
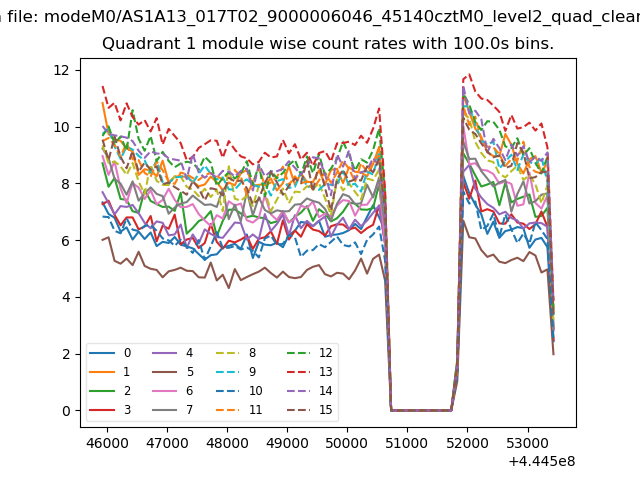
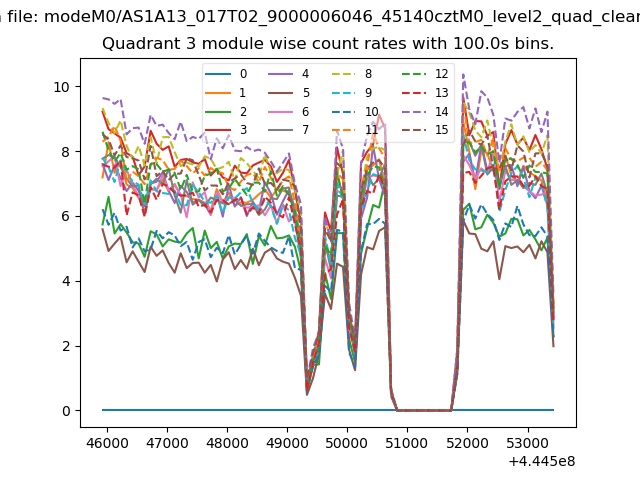
| Module-wise count rates for Quadrant A Data is divided into 100 sec bins |
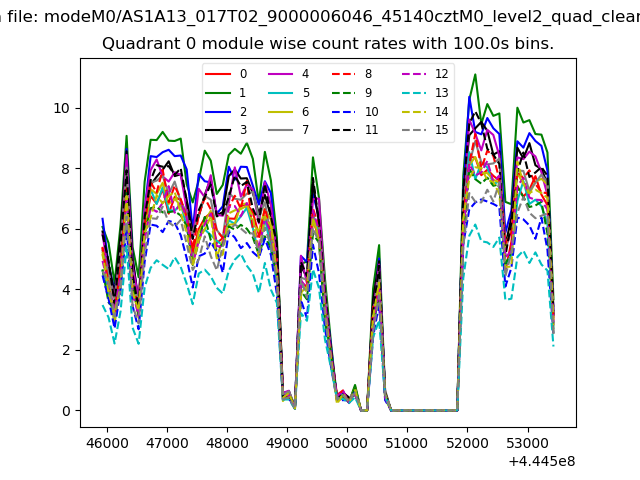 |
 |
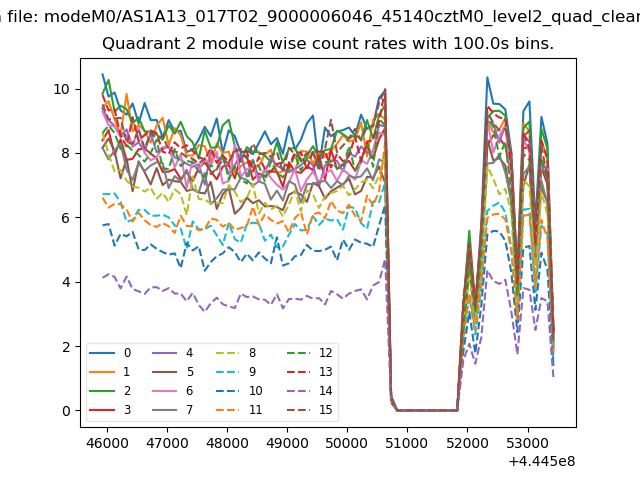
| Module-wise count rates for Quadrant B Data is divided into 100 sec bins |
 |
 |
| Module-wise count rates for Quadrant C Data is divided into 100 sec bins |
 |
 |
| Module-wise count rates for Quadrant D Data is divided into 100 sec bins |
 |
 |
| Parameter | Plot |
|---|---|
| CZT HV Monitor | 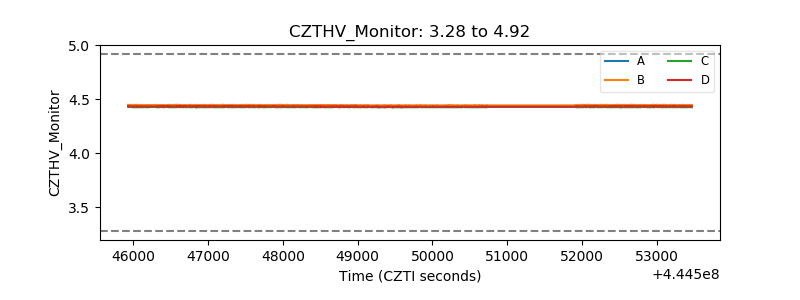 |
| D_VDD | 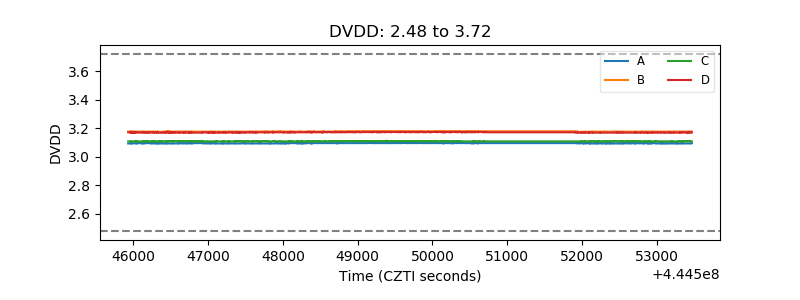 |
| Temperature 1 | 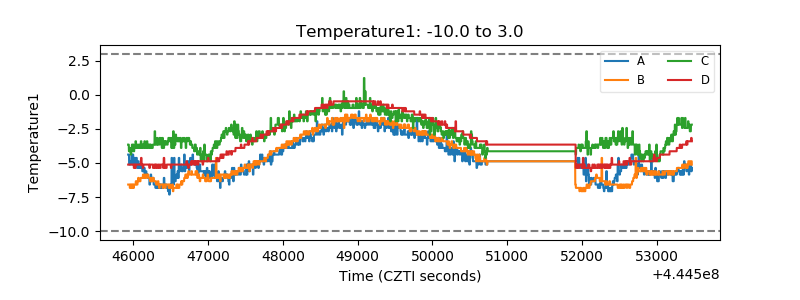 |
| Veto HV Monitor | 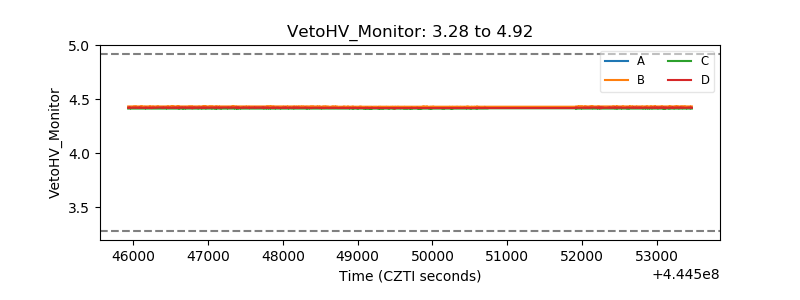 |
| Veto LLD |  |
| Alpha Counter | 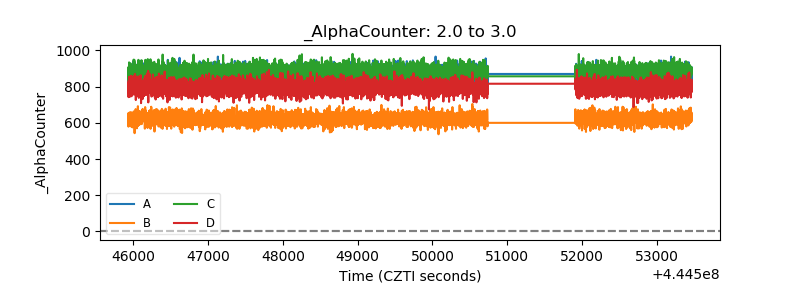 |
| _CPM_Rate | 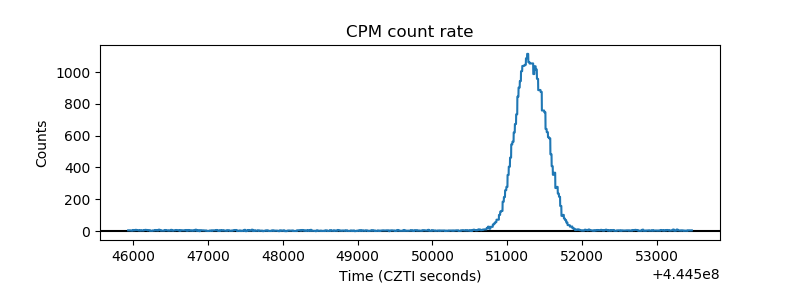 |
| CZT Counter | 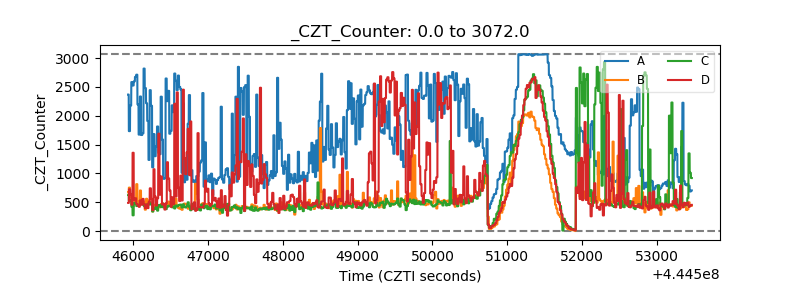 |
| +2.5 Volts monitor | 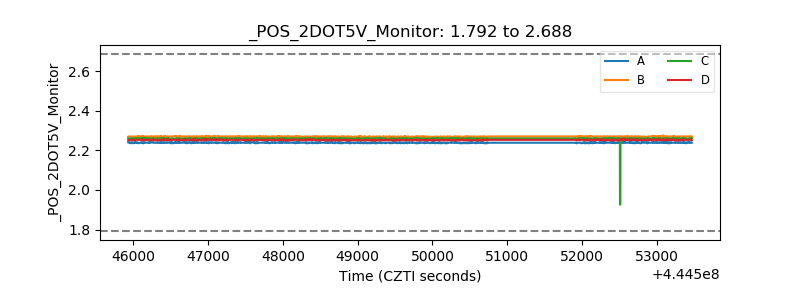 |
| +5 Volts monitor | 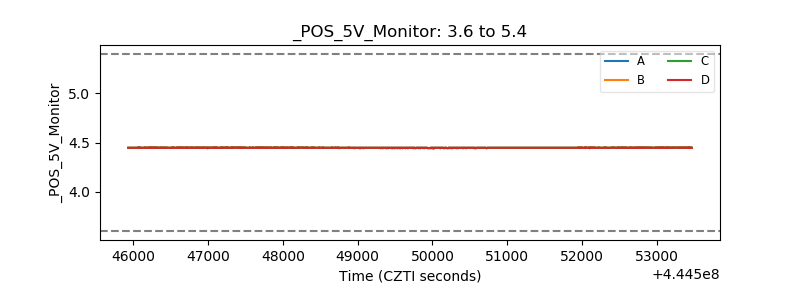 |
| _ROLL_ROT | 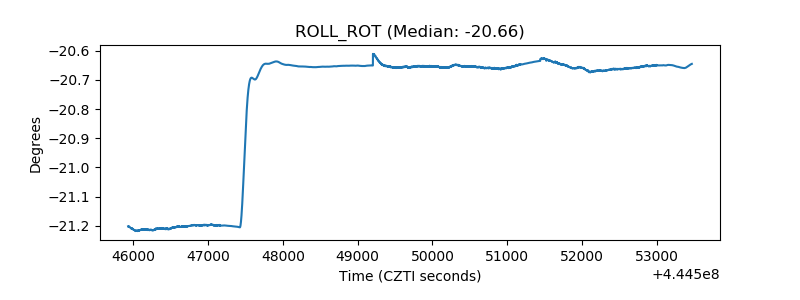 |
| _Roll_DEC | 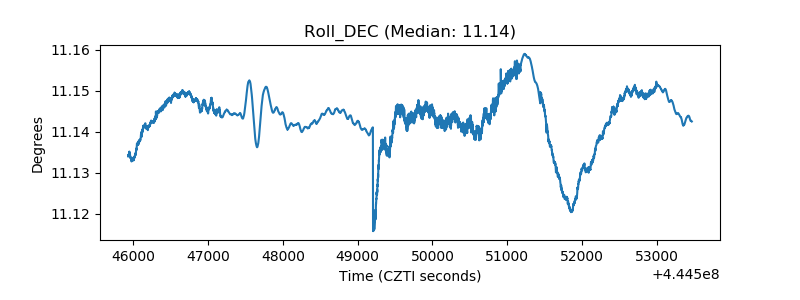 |
| _Roll_RA | 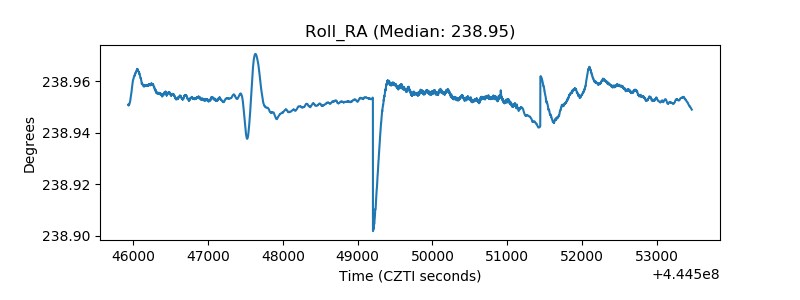 |
| Veto Counter | 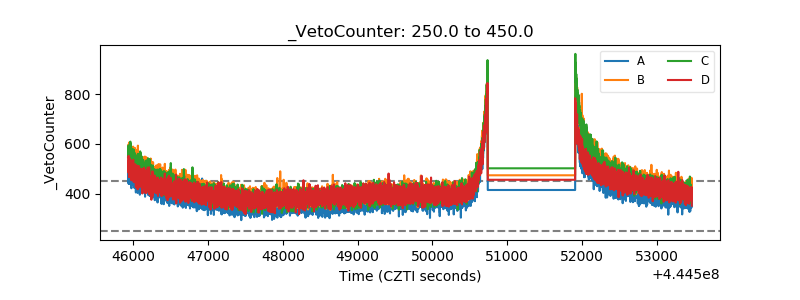 |