| Param | Original file | Final file |
|---|---|---|
| Filename | modeM0/AS1A13_017T02_9000006046_45141cztM0_level2.fits | modeM0/AS1A13_017T02_9000006046_45141cztM0_level2_quad_clean.evt |
| Size (bytes) | 664,735,680 | 105,629,760 |
| Size | 633.9 MB | 100.7 MB |
| Events in quadrant A | 7,486,390 | 698,621 |
| Events in quadrant B | 3,498,013 | 810,973 |
| Events in quadrant C | 6,849,877 | 608,248 |
| Events in quadrant D | 6,261,364 | 620,313 |
| Mode M0 | |||
|---|---|---|---|
| Quadrant | BADHDUFLAG | Total packets | Discarded packets |
| A | 0 | 26818 | 2 |
| B | 0 | 14512 | 2 |
| C | 0 | 24701 | 2 |
| D | 0 | 23113 | 4 |
| Mode M9 | |||
|---|---|---|---|
| Quadrant | BADHDUFLAG | Total packets | Discarded packets |
| A | 0 | 11 | 0 |
| B | 0 | 11 | 0 |
| C | 0 | 11 | 0 |
| D | 0 | 11 | 0 |
| Mode SS | |||
|---|---|---|---|
| Quadrant | BADHDUFLAG | Total packets | Discarded packets |
| A | 0 | 136 | 0 |
| B | 0 | 136 | 0 |
| C | 0 | 136 | 0 |
| D | 0 | 136 | 0 |
| Quadrant | Total seconds | Saturated seconds | Saturation percentage |
|---|---|---|---|
| A | 6594 | 898 | 13.618441% |
| B | 6594 | 104 | 1.577191% |
| C | 6595 | 1511 | 22.911296% |
| D | 6594 | 961 | 14.573855% |
Noise dominated data is calculated using 1-second bins in cleaned event files. If a bin has >2000 counts, and if more than 50% of those come from <1% of pixels, then it is considered to be noise-dominated and hence unusable.
| Quadrant | # 1 sec bins | Bins with >0 counts | Bins with >2000 counts | High rate bins dominated by noise | Noise dominated (total time) | Noise dominated (detector-on time) | Marked lightcurve |
|---|---|---|---|---|---|---|---|
| A | 7739 | 6595 | 571 | 571 | 7.38% | 8.66% | 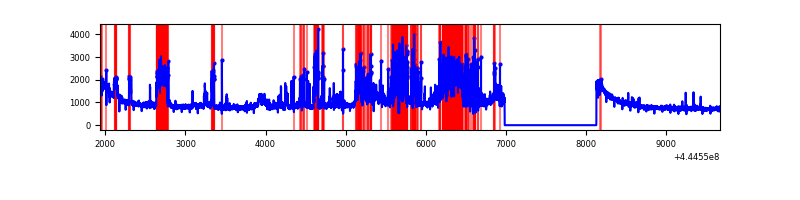 |
| B | 7739 | 6595 | 9 | 9 | 0.12% | 0.14% | 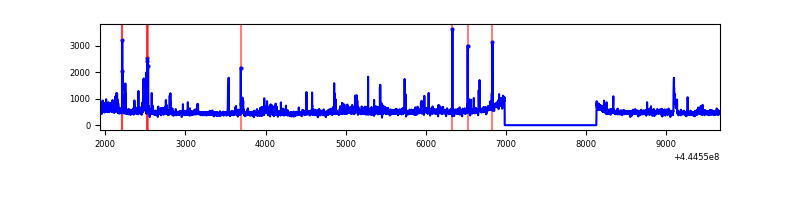 |
| C | 7740 | 6596 | 1383 | 1383 | 17.87% | 20.97% | 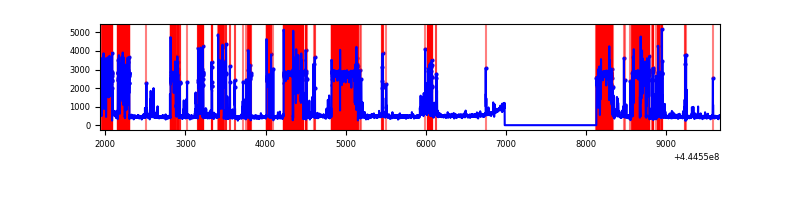 |
| D | 7739 | 6594 | 781 | 781 | 10.09% | 11.84% | 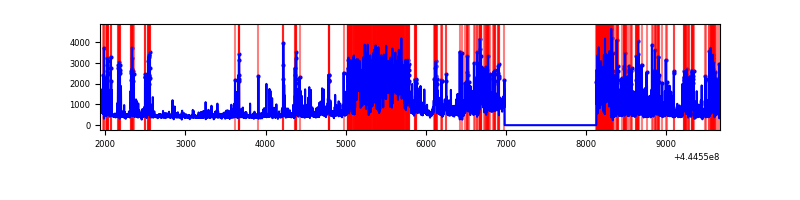 |
Top three noisy pixels from each quadrant. If the there are fewer than three noisy pixels in the level2.evt file, extra rows are filled as -1
| Pixel properties | Quadrant properties | ||||||
|---|---|---|---|---|---|---|---|
| Quadrant | DetID | PixID | Counts | Sigma | Mean | Median | Sigma |
| A | 10 | 83 | 2445450 | 15436.44 | 765 | 750 | 158.4 |
| A | 15 | 223 | 2077153 | 13110.92 | 765 | 750 | 158.4 |
| A | 3 | 137 | 8213 | 47.12 | 765 | 750 | 158.4 |
| B | 4 | 170 | 117493 | 738.03 | 791 | 768 | 158.2 |
| B | 0 | 155 | 59496 | 371.33 | 791 | 768 | 158.2 |
| B | 0 | 183 | 52655 | 328.07 | 791 | 768 | 158.2 |
| C | 12 | 2 | 4149275 | 26441.08 | 662 | 668 | 156.9 |
| C | 11 | 16 | 63787 | 402.29 | 662 | 668 | 156.9 |
| C | 15 | 208 | 21674 | 133.88 | 662 | 668 | 156.9 |
| D | 13 | 249 | 1314593 | 7174.91 | 732 | 712 | 183.1 |
| D | 5 | 222 | 594138 | 3240.61 | 732 | 712 | 183.1 |
| D | 5 | 235 | 463935 | 2529.59 | 732 | 712 | 183.1 |
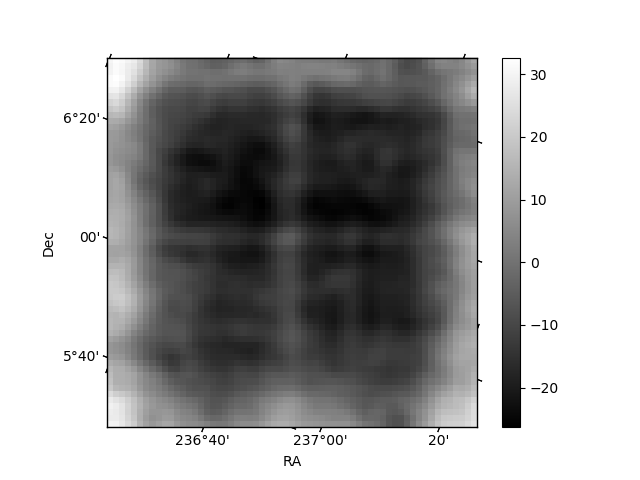
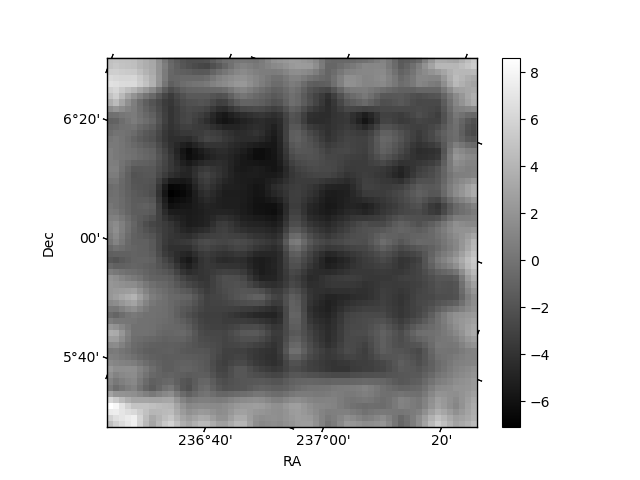
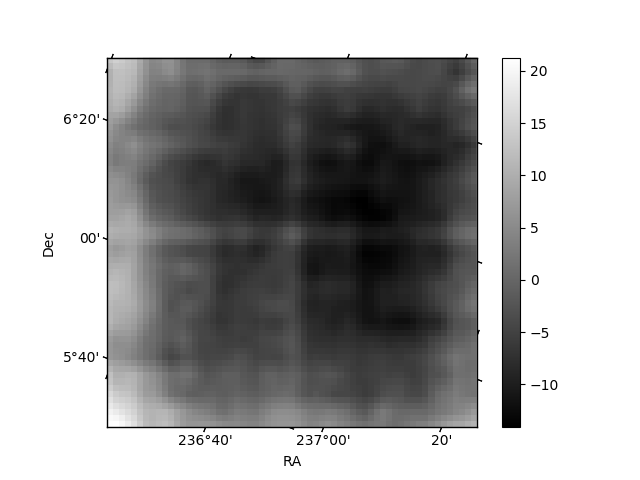
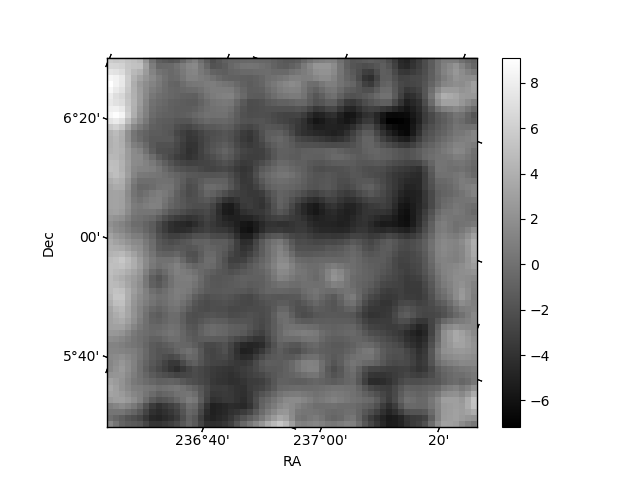
Histogram calculated using DETX and DETY for each event in the final _common_clean file
| Quadrant A | 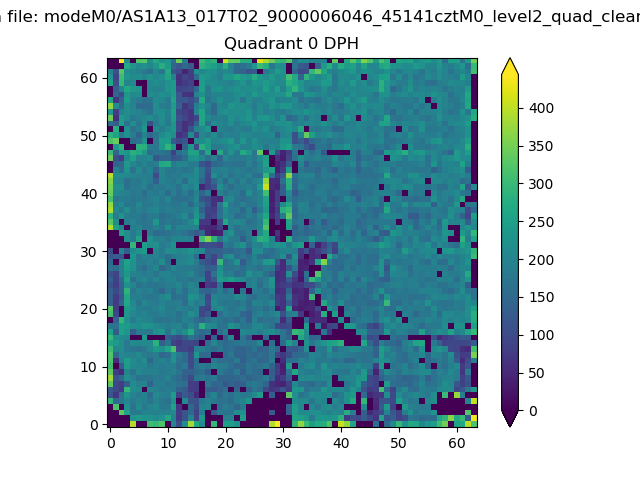 |
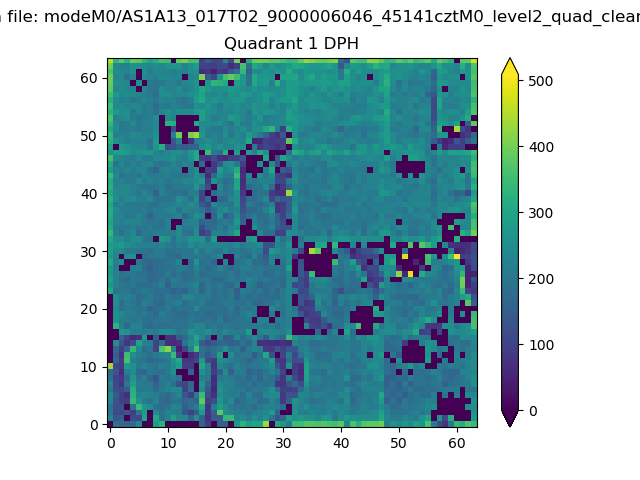 |
Quadrant B |
|---|---|---|---|
| Quadrant D | 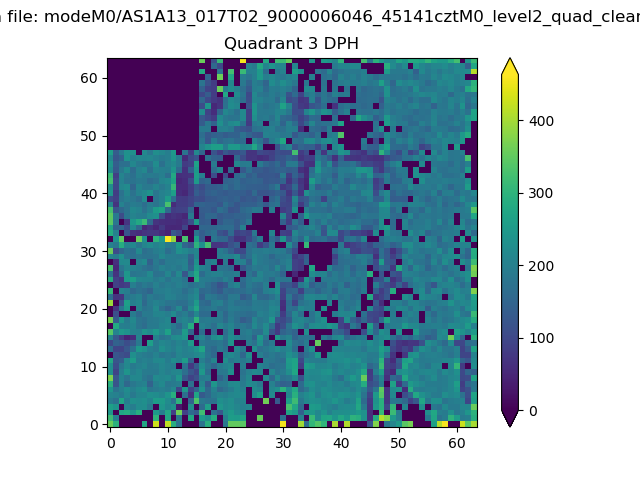 |
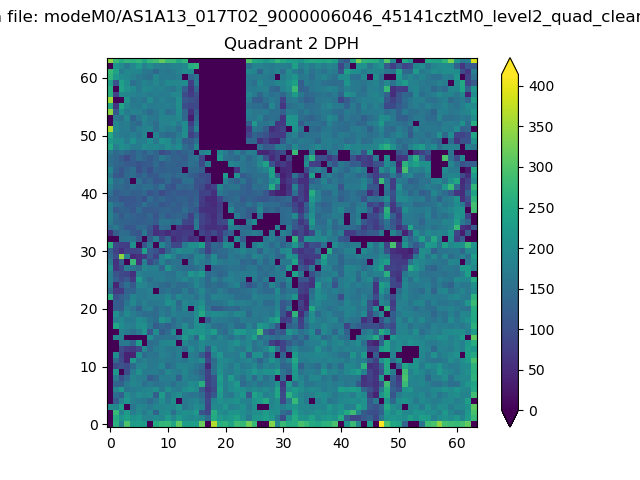 |
Quadrant C |
| Plot type | Count rate plots | Images |
|---|---|---|
| Comparison with Poisson distribution Blue bars denote a histogram of data divided into 1 sec bins. Red curve is a Poisson curve with rate = median count rate of data. |
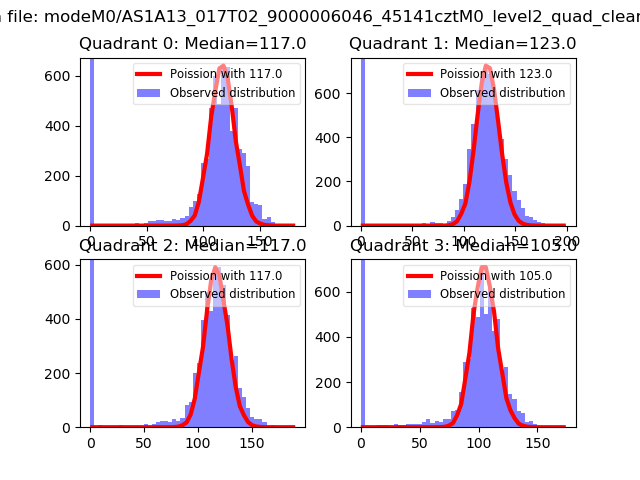 |
 |
| Quadrant-wise count rates Data is divided into 100 sec bins |
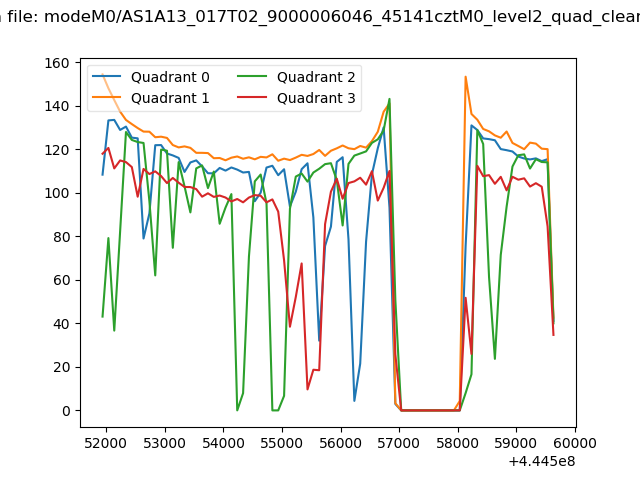 |
|
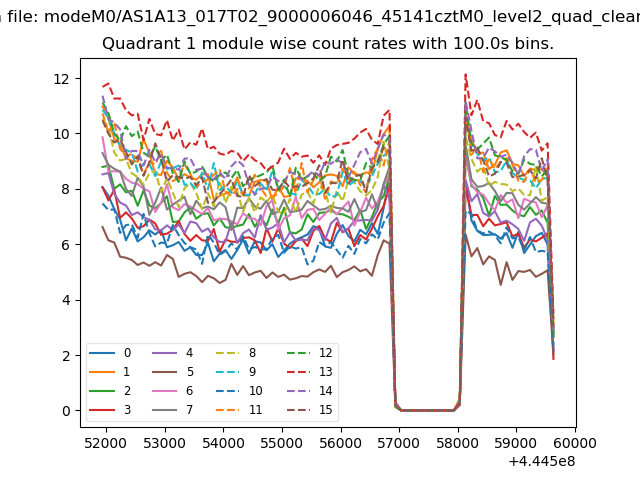
| Module-wise count rates for Quadrant A Data is divided into 100 sec bins |
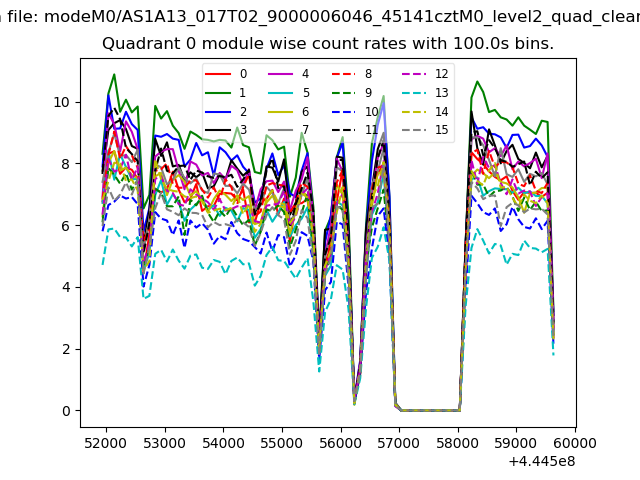 |
 |
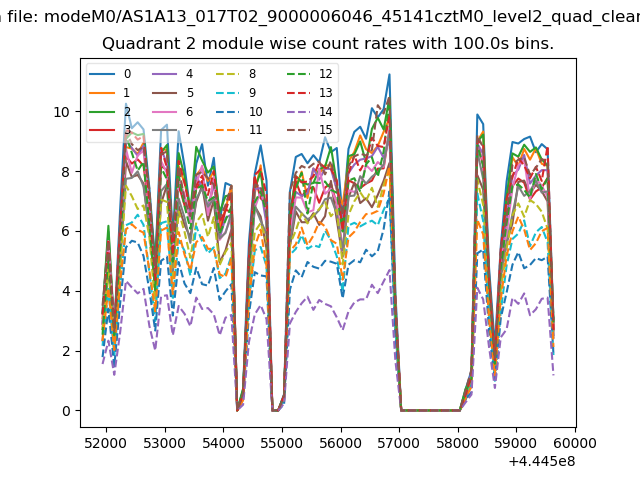
| Module-wise count rates for Quadrant B Data is divided into 100 sec bins |
 |
 |
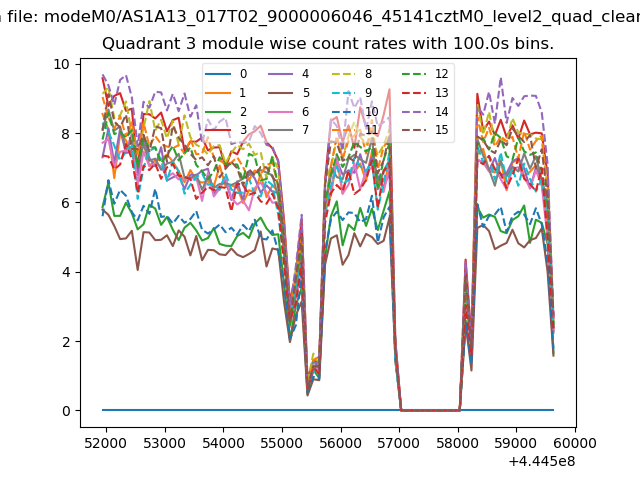
| Module-wise count rates for Quadrant C Data is divided into 100 sec bins |
 |
 |
| Module-wise count rates for Quadrant D Data is divided into 100 sec bins |
 |
 |
| Parameter | Plot |
|---|---|
| CZT HV Monitor | 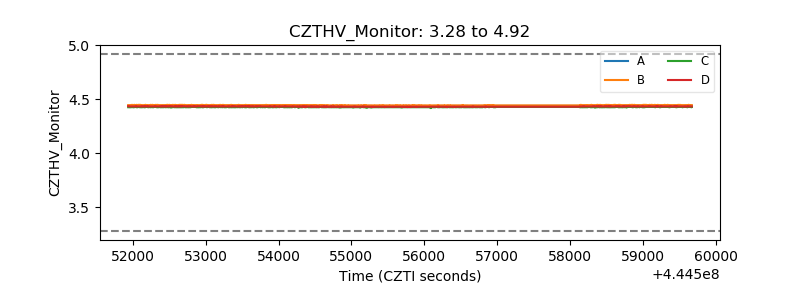 |
| D_VDD | 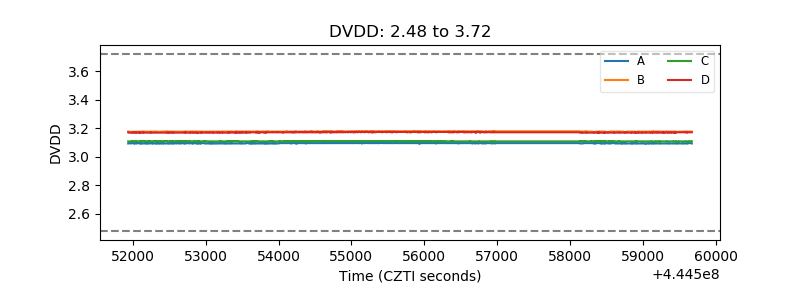 |
| Temperature 1 | 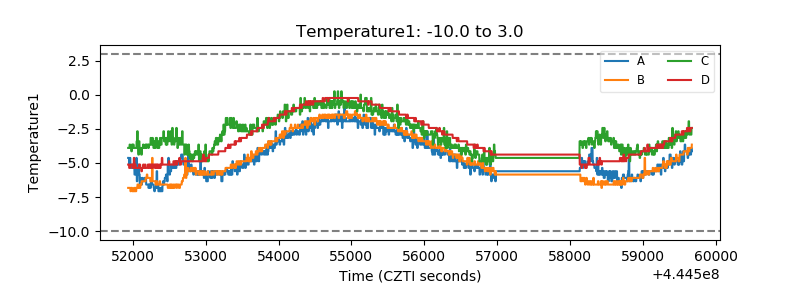 |
| Veto HV Monitor | 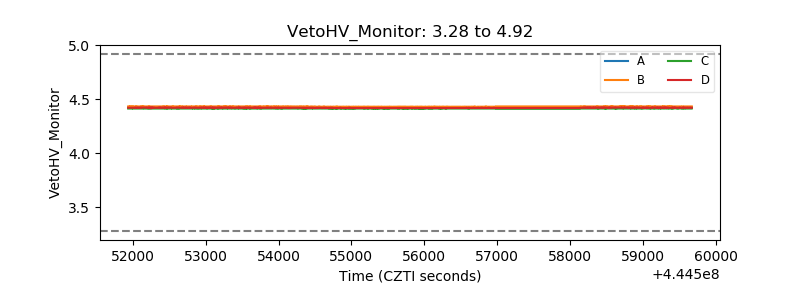 |
| Veto LLD | 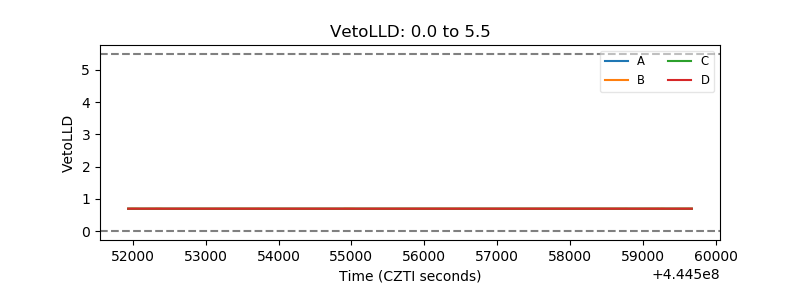 |
| Alpha Counter | 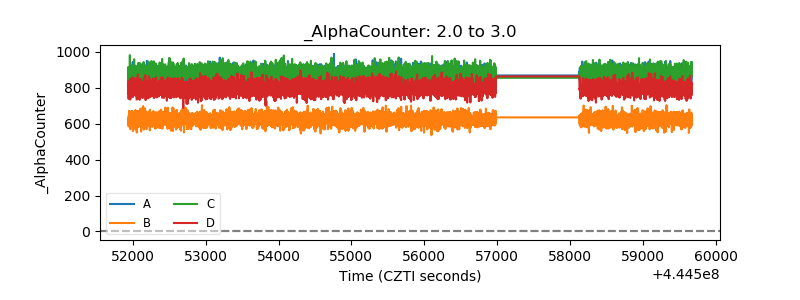 |
| _CPM_Rate | 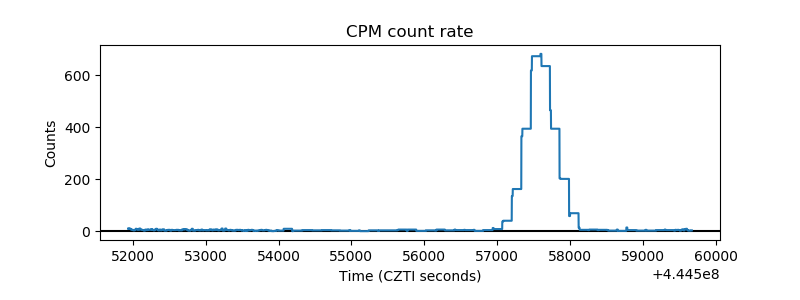 |
| CZT Counter | 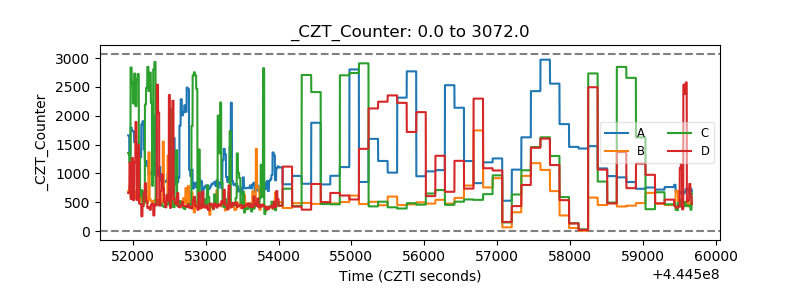 |
| +2.5 Volts monitor | 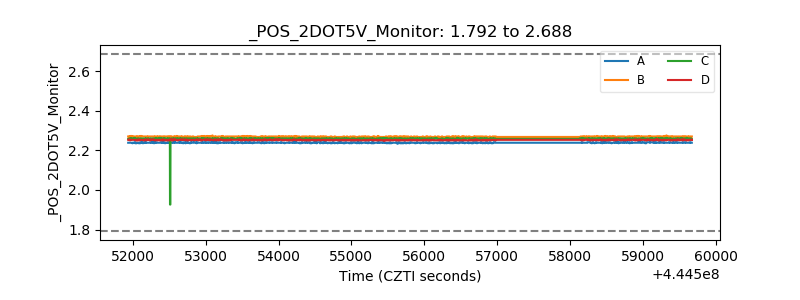 |
| +5 Volts monitor | 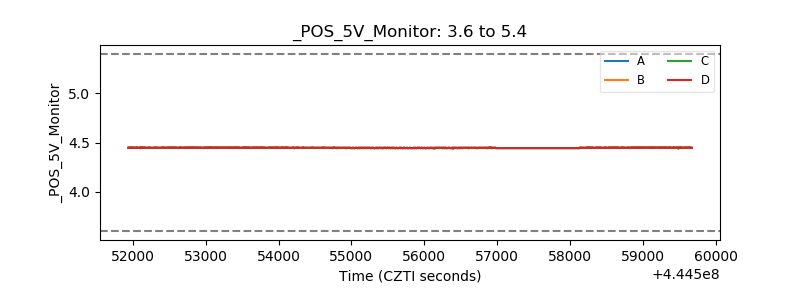 |
| _ROLL_ROT | 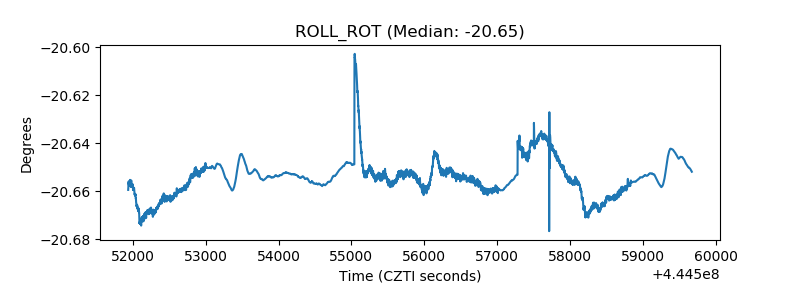 |
| _Roll_DEC | 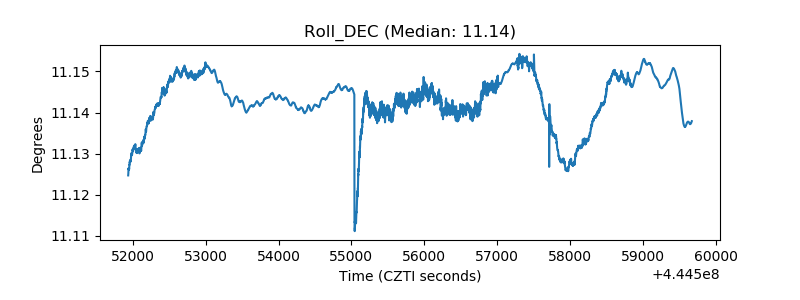 |
| _Roll_RA | 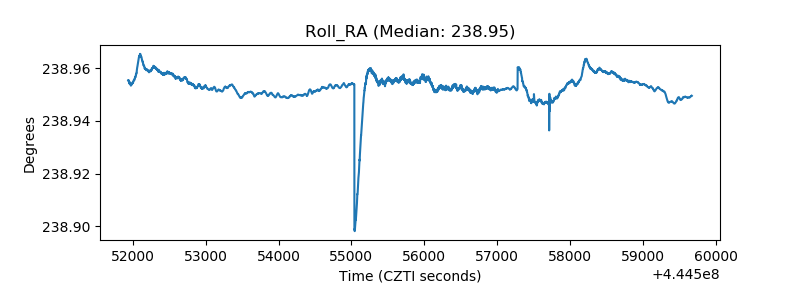 |
| Veto Counter | 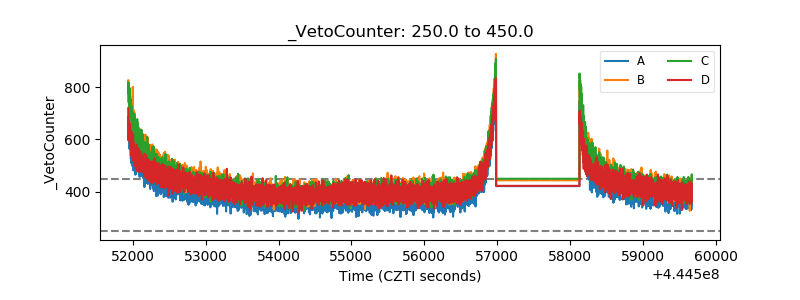 |