| Param | Original file | Final file |
|---|---|---|
| Filename | modeM0/AS1A13_017T02_9000006046_45142cztM0_level2.fits | modeM0/AS1A13_017T02_9000006046_45142cztM0_level2_quad_clean.evt |
| Size (bytes) | 552,660,480 | 107,242,560 |
| Size | 527.1 MB | 102.3 MB |
| Events in quadrant A | 6,008,326 | 729,412 |
| Events in quadrant B | 3,337,092 | 766,085 |
| Events in quadrant C | 3,901,062 | 708,833 |
| Events in quadrant D | 6,706,374 | 588,872 |
| Mode M0 | |||
|---|---|---|---|
| Quadrant | BADHDUFLAG | Total packets | Discarded packets |
| A | 0 | 22395 | 1 |
| B | 0 | 14039 | 2 |
| C | 0 | 15976 | 1 |
| D | 0 | 24347 | 1 |
| Mode M9 | |||
|---|---|---|---|
| Quadrant | BADHDUFLAG | Total packets | Discarded packets |
| A | 0 | 11 | 0 |
| B | 0 | 11 | 0 |
| C | 0 | 11 | 0 |
| D | 0 | 11 | 0 |
| Mode SS | |||
|---|---|---|---|
| Quadrant | BADHDUFLAG | Total packets | Discarded packets |
| A | 0 | 132 | 0 |
| B | 0 | 132 | 0 |
| C | 0 | 132 | 0 |
| D | 0 | 132 | 0 |
| Quadrant | Total seconds | Saturated seconds | Saturation percentage |
|---|---|---|---|
| A | 6509 | 274 | 4.209556% |
| B | 6508 | 148 | 2.274124% |
| C | 6508 | 362 | 5.562385% |
| D | 6508 | 1066 | 16.379840% |
Noise dominated data is calculated using 1-second bins in cleaned event files. If a bin has >2000 counts, and if more than 50% of those come from <1% of pixels, then it is considered to be noise-dominated and hence unusable.
| Quadrant | # 1 sec bins | Bins with >0 counts | Bins with >2000 counts | High rate bins dominated by noise | Noise dominated (total time) | Noise dominated (detector-on time) | Marked lightcurve |
|---|---|---|---|---|---|---|---|
| A | 7564 | 6509 | 72 | 72 | 0.95% | 1.11% | 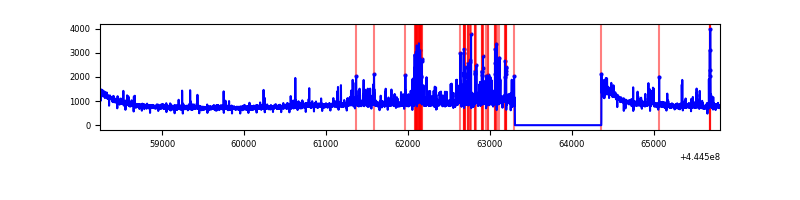 |
| B | 7563 | 6509 | 36 | 36 | 0.48% | 0.55% | 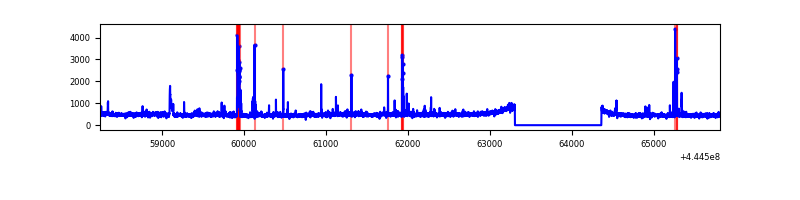 |
| C | 7563 | 6509 | 297 | 297 | 3.93% | 4.56% | 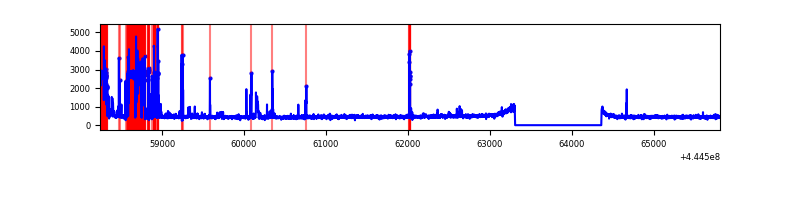 |
| D | 7563 | 6508 | 854 | 854 | 11.29% | 13.12% | 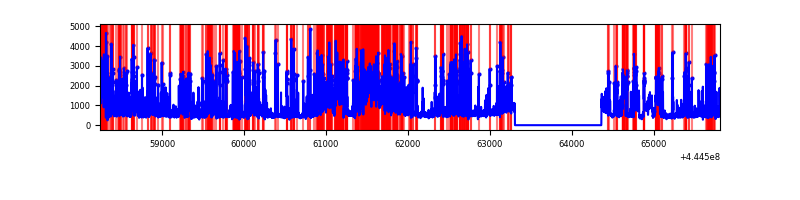 |
Top three noisy pixels from each quadrant. If the there are fewer than three noisy pixels in the level2.evt file, extra rows are filled as -1
| Pixel properties | Quadrant properties | ||||||
|---|---|---|---|---|---|---|---|
| Quadrant | DetID | PixID | Counts | Sigma | Mean | Median | Sigma |
| A | 10 | 83 | 2422633 | 15290.24 | 766 | 752 | 158.4 |
| A | 15 | 223 | 591622 | 3730.38 | 766 | 752 | 158.4 |
| A | 10 | 248 | 15715 | 94.47 | 766 | 752 | 158.4 |
| B | 5 | 32 | 115253 | 752.96 | 767 | 746 | 152.1 |
| B | 4 | 170 | 103107 | 673.1 | 767 | 746 | 152.1 |
| B | 5 | 185 | 21637 | 137.37 | 767 | 746 | 152.1 |
| C | 12 | 2 | 910822 | 5264.86 | 736 | 740 | 172.9 |
| C | 14 | 254 | 56103 | 320.28 | 736 | 740 | 172.9 |
| C | 6 | 247 | 27455 | 154.55 | 736 | 740 | 172.9 |
| D | 13 | 249 | 2143307 | 11745.33 | 714 | 692 | 182.4 |
| D | 13 | 29 | 555304 | 3040.26 | 714 | 692 | 182.4 |
| D | 1 | 52 | 353343 | 1933.15 | 714 | 692 | 182.4 |
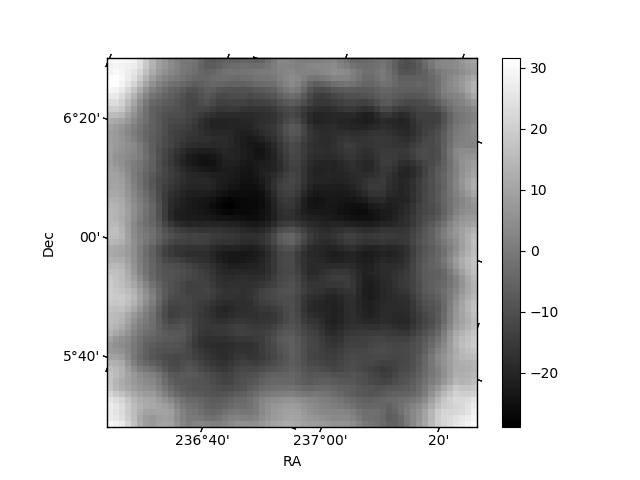
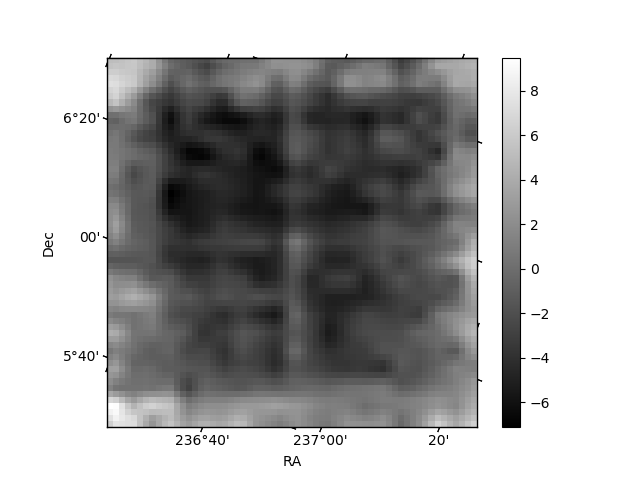
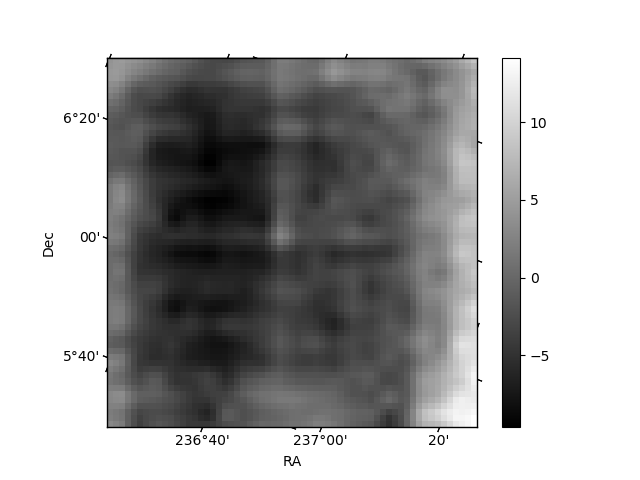
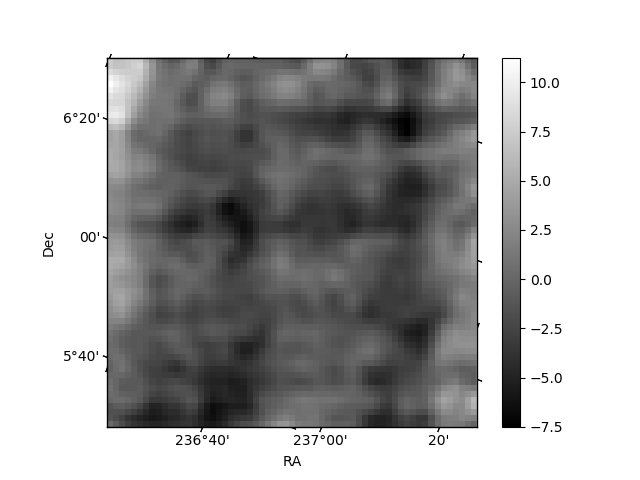
Histogram calculated using DETX and DETY for each event in the final _common_clean file
| Quadrant A | 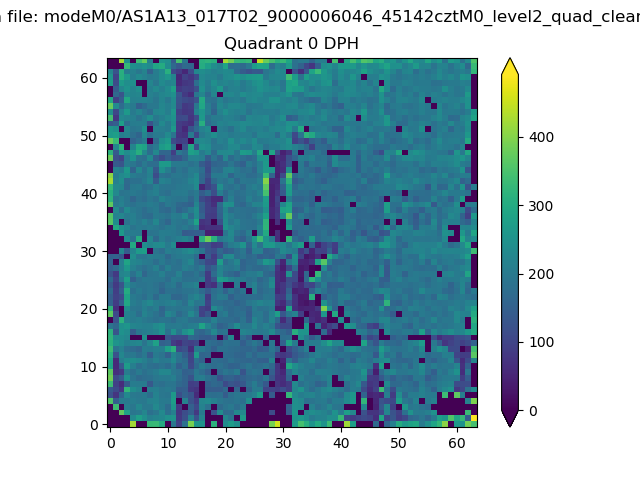 |
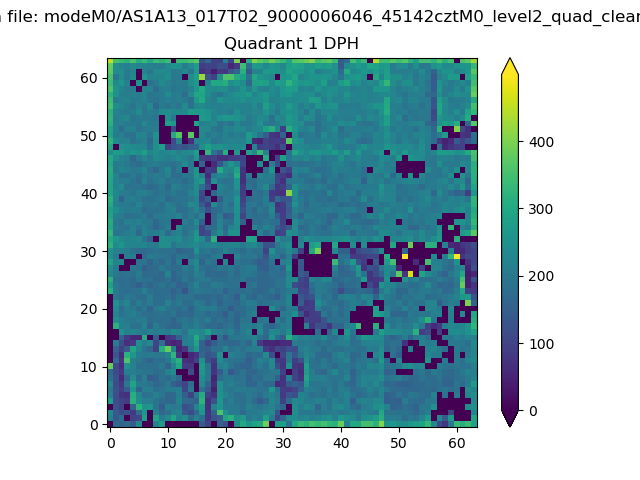 |
Quadrant B |
|---|---|---|---|
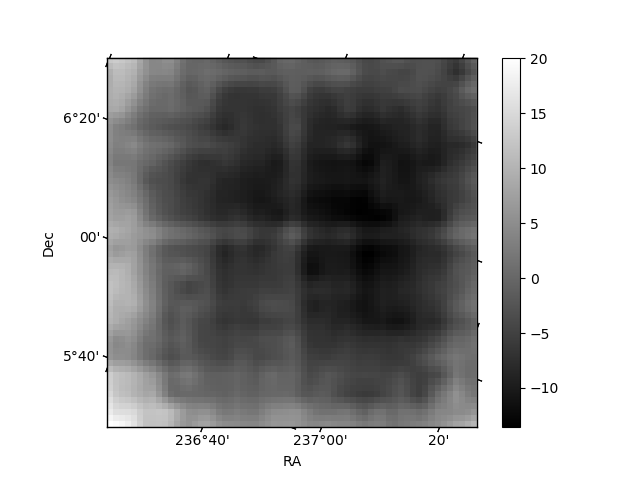
| Quadrant D | 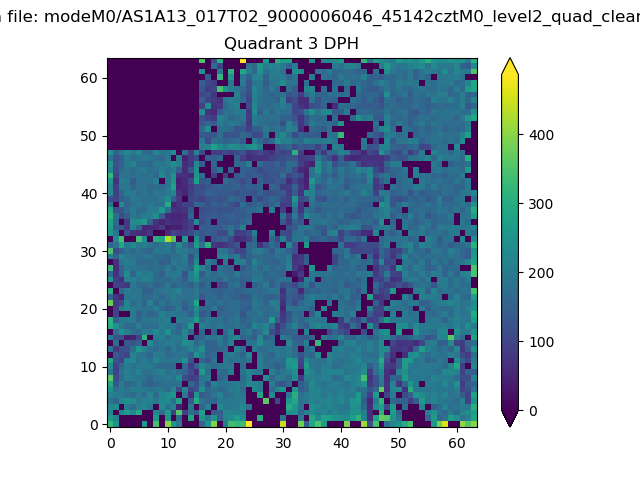 |
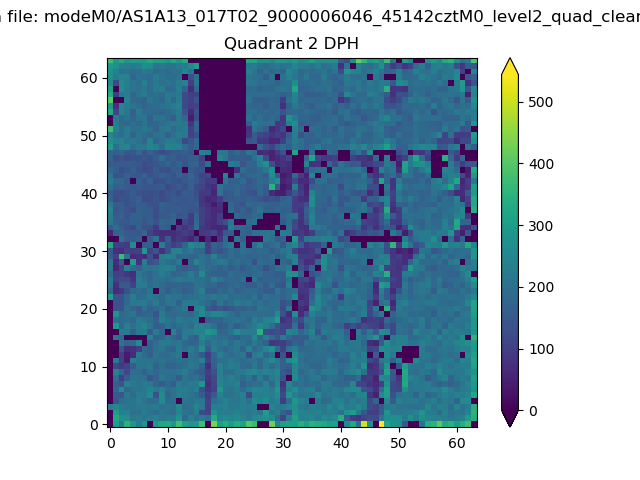 |
Quadrant C |
| Plot type | Count rate plots | Images |
|---|---|---|
| Comparison with Poisson distribution Blue bars denote a histogram of data divided into 1 sec bins. Red curve is a Poisson curve with rate = median count rate of data. |
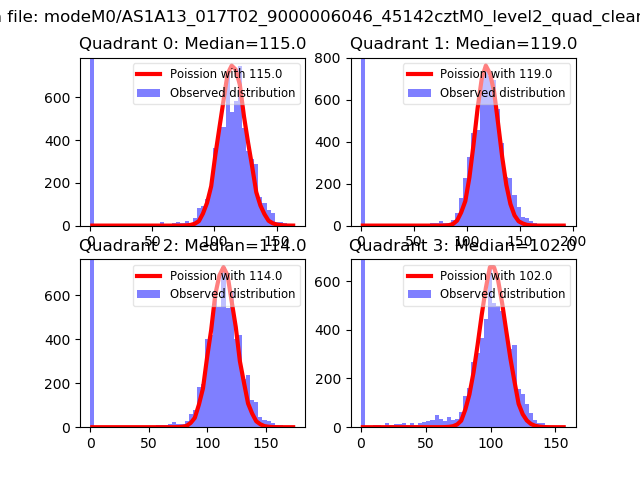 |
 |
| Quadrant-wise count rates Data is divided into 100 sec bins |
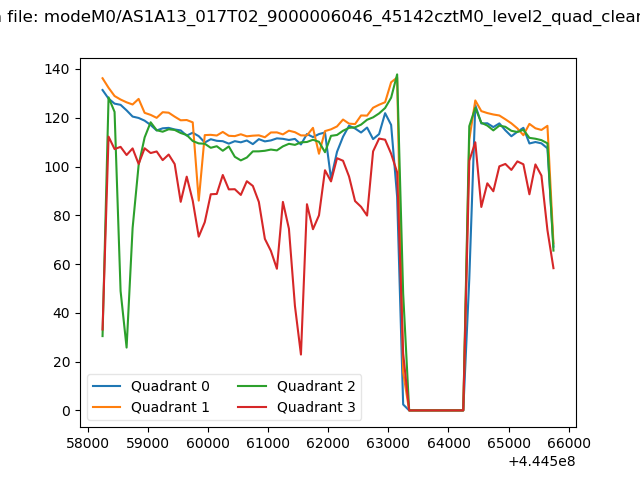 |
|
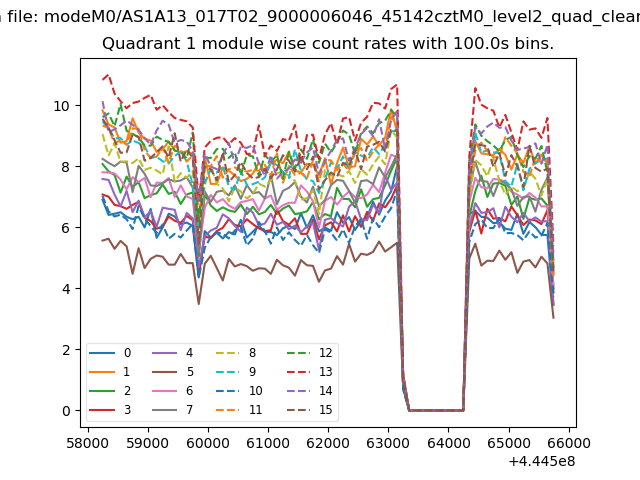
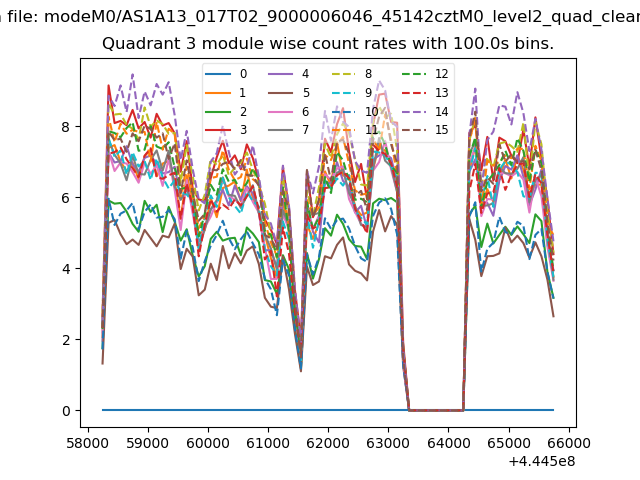
| Module-wise count rates for Quadrant A Data is divided into 100 sec bins |
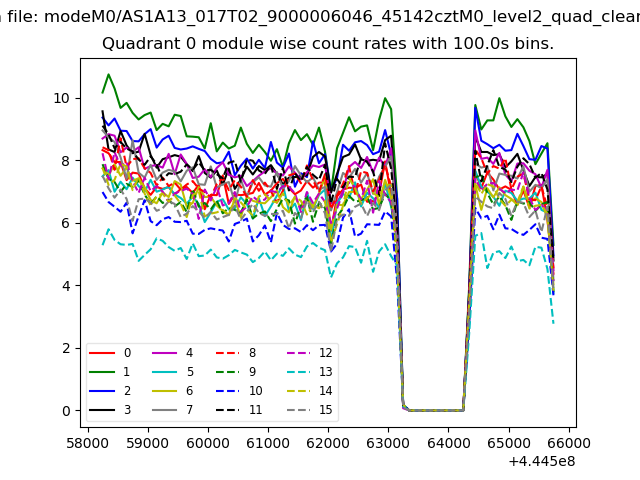 |
 |
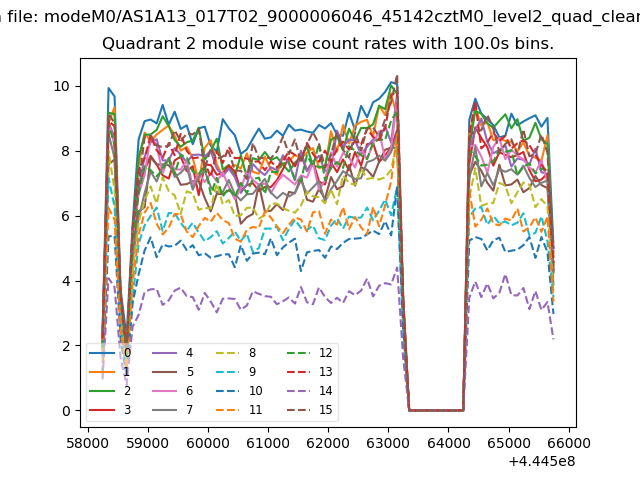
| Module-wise count rates for Quadrant B Data is divided into 100 sec bins |
 |
 |
| Module-wise count rates for Quadrant C Data is divided into 100 sec bins |
 |
 |
| Module-wise count rates for Quadrant D Data is divided into 100 sec bins |
 |
 |
| Parameter | Plot |
|---|---|
| CZT HV Monitor | 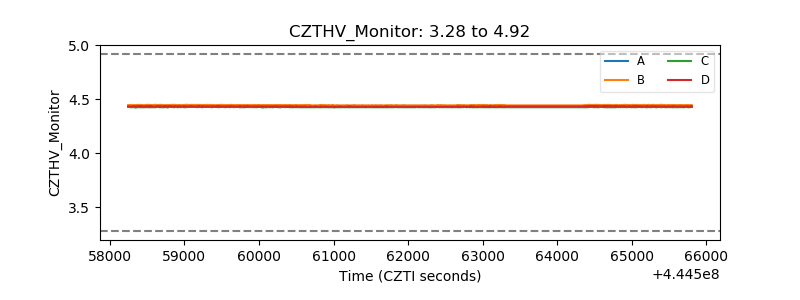 |
| D_VDD | 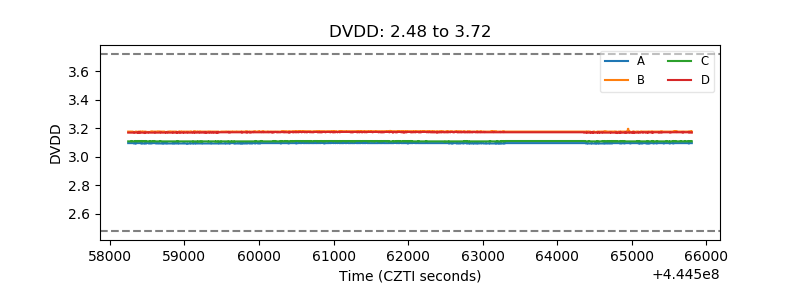 |
| Temperature 1 | 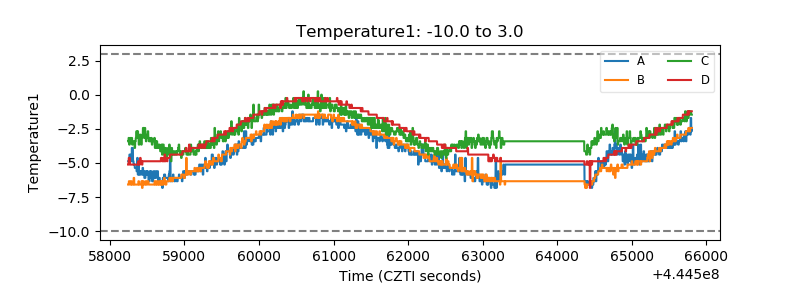 |
| Veto HV Monitor | 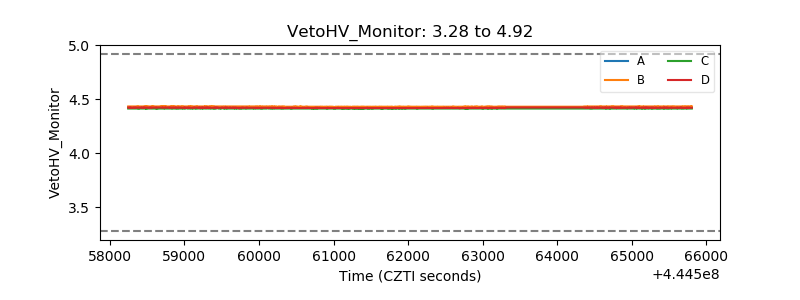 |
| Veto LLD | 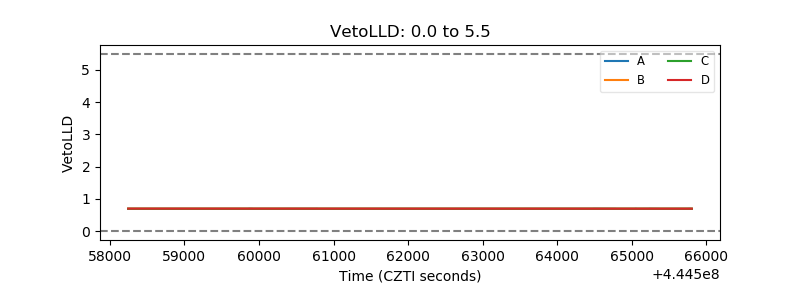 |
| Alpha Counter | 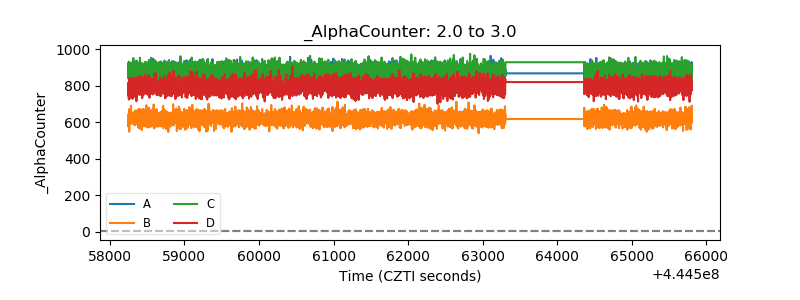 |
| _CPM_Rate | 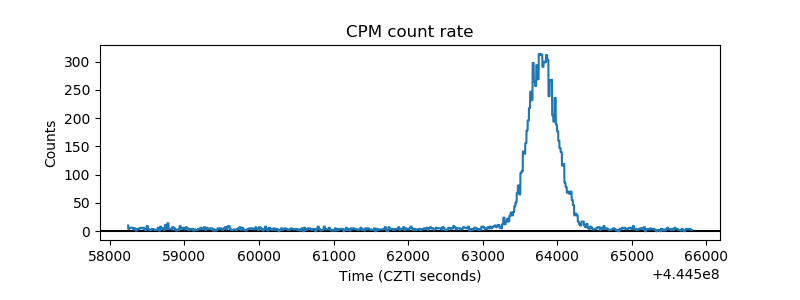 |
| CZT Counter | 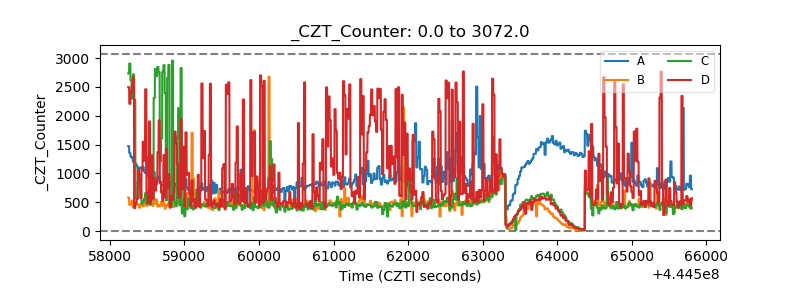 |
| +2.5 Volts monitor | 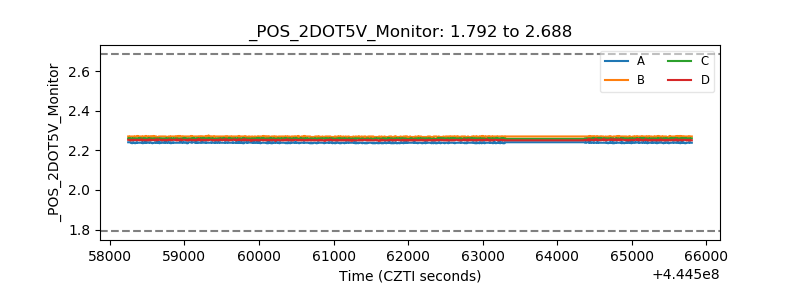 |
| +5 Volts monitor | 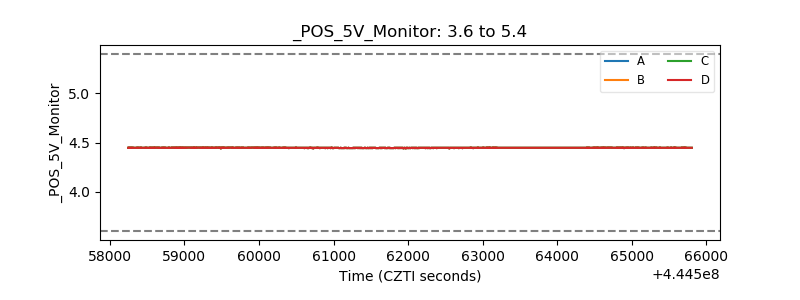 |
| _ROLL_ROT | 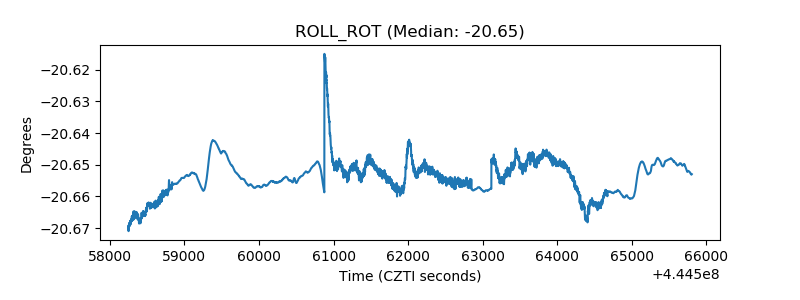 |
| _Roll_DEC | 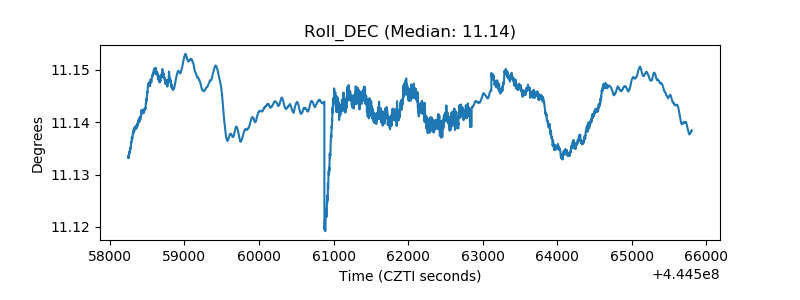 |
| _Roll_RA | 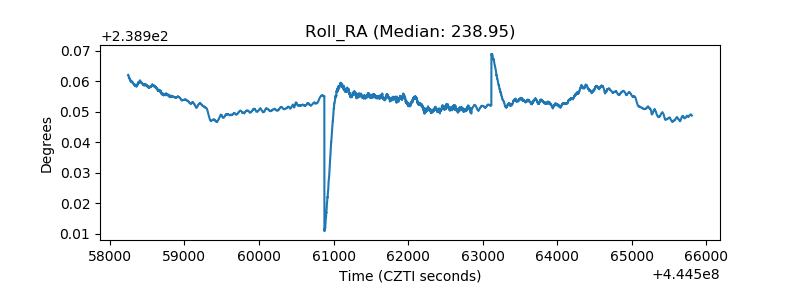 |
| Veto Counter | 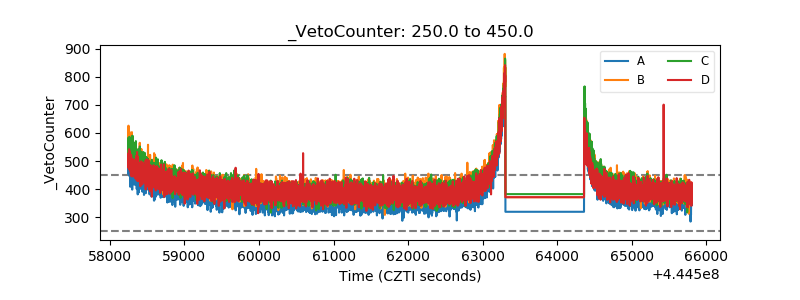 |