| Param | Original file | Final file |
|---|---|---|
| Filename | modeM0/AS1A13_017T02_9000006046_45143cztM0_level2.fits | modeM0/AS1A13_017T02_9000006046_45143cztM0_level2_quad_clean.evt |
| Size (bytes) | 510,140,160 | 104,650,560 |
| Size | 486.5 MB | 99.8 MB |
| Events in quadrant A | 7,611,604 | 638,272 |
| Events in quadrant B | 3,251,843 | 736,829 |
| Events in quadrant C | 3,101,874 | 708,931 |
| Events in quadrant D | 4,415,149 | 632,285 |
| Mode M0 | |||
|---|---|---|---|
| Quadrant | BADHDUFLAG | Total packets | Discarded packets |
| A | 0 | 26814 | 1 |
| B | 0 | 13890 | 1 |
| C | 0 | 13687 | 1 |
| D | 0 | 17426 | 1 |
| Mode M9 | |||
|---|---|---|---|
| Quadrant | BADHDUFLAG | Total packets | Discarded packets |
| A | 0 | 8 | 0 |
| B | 0 | 8 | 0 |
| C | 0 | 8 | 0 |
| D | 0 | 8 | 0 |
| Mode SS | |||
|---|---|---|---|
| Quadrant | BADHDUFLAG | Total packets | Discarded packets |
| A | 0 | 132 | 0 |
| B | 0 | 132 | 0 |
| C | 0 | 132 | 0 |
| D | 0 | 132 | 0 |
| Quadrant | Total seconds | Saturated seconds | Saturation percentage |
|---|---|---|---|
| A | 6485 | 953 | 14.695451% |
| B | 6485 | 98 | 1.511180% |
| C | 6484 | 53 | 0.817397% |
| D | 6484 | 256 | 3.948180% |
Noise dominated data is calculated using 1-second bins in cleaned event files. If a bin has >2000 counts, and if more than 50% of those come from <1% of pixels, then it is considered to be noise-dominated and hence unusable.
| Quadrant | # 1 sec bins | Bins with >0 counts | Bins with >2000 counts | High rate bins dominated by noise | Noise dominated (total time) | Noise dominated (detector-on time) | Marked lightcurve |
|---|---|---|---|---|---|---|---|
| A | 7335 | 6486 | 689 | 689 | 9.39% | 10.62% | 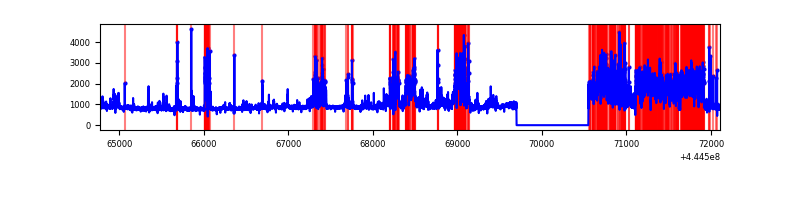 |
| B | 7335 | 6486 | 23 | 23 | 0.31% | 0.35% | 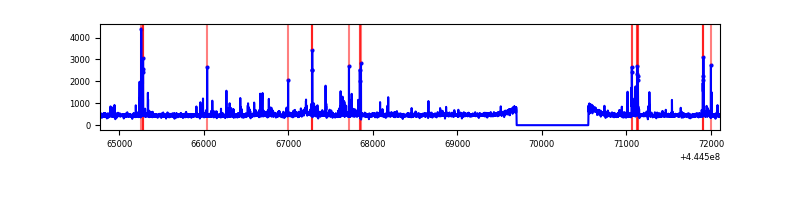 |
| C | 7334 | 6485 | 19 | 19 | 0.26% | 0.29% | 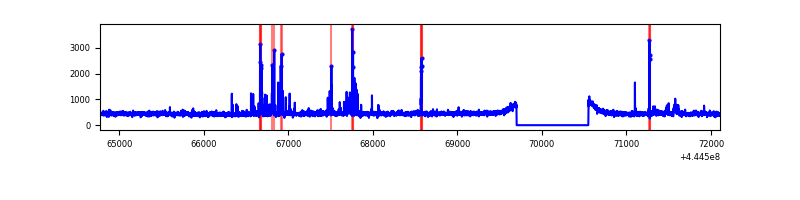 |
| D | 7334 | 6485 | 176 | 176 | 2.40% | 2.71% | 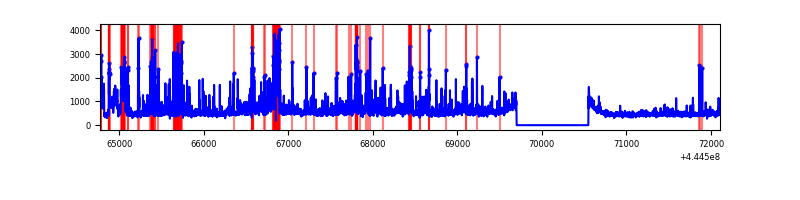 |
Top three noisy pixels from each quadrant. If the there are fewer than three noisy pixels in the level2.evt file, extra rows are filled as -1
| Pixel properties | Quadrant properties | ||||||
|---|---|---|---|---|---|---|---|
| Quadrant | DetID | PixID | Counts | Sigma | Mean | Median | Sigma |
| A | 10 | 83 | 2347365 | 15496.87 | 726 | 713 | 151.4 |
| A | 15 | 223 | 2262445 | 14936.07 | 726 | 713 | 151.4 |
| A | 15 | 174 | 117477 | 771.09 | 726 | 713 | 151.4 |
| B | 4 | 170 | 90329 | 600.15 | 751 | 729 | 149.3 |
| B | 10 | 3 | 63727 | 421.96 | 751 | 729 | 149.3 |
| B | 0 | 183 | 49150 | 324.33 | 751 | 729 | 149.3 |
| C | 14 | 254 | 128687 | 724.43 | 742 | 745 | 176.6 |
| C | 6 | 247 | 34432 | 190.74 | 742 | 745 | 176.6 |
| C | 11 | 16 | 12732 | 67.87 | 742 | 745 | 176.6 |
| D | 13 | 249 | 520496 | 2781.49 | 738 | 713 | 186.9 |
| D | 1 | 52 | 434817 | 2323.0 | 738 | 713 | 186.9 |
| D | 5 | 222 | 212763 | 1134.73 | 738 | 713 | 186.9 |
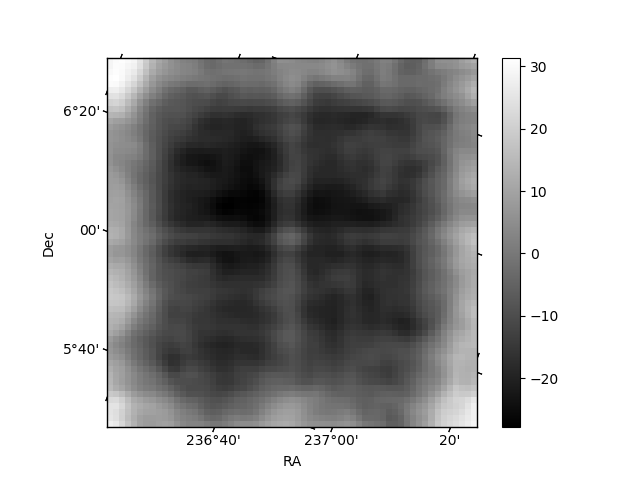
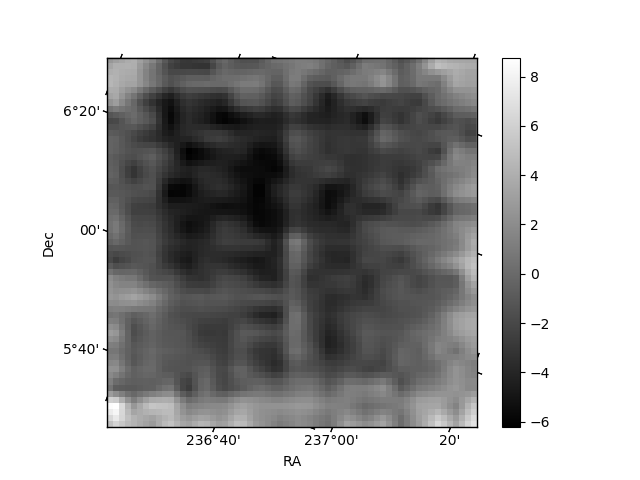
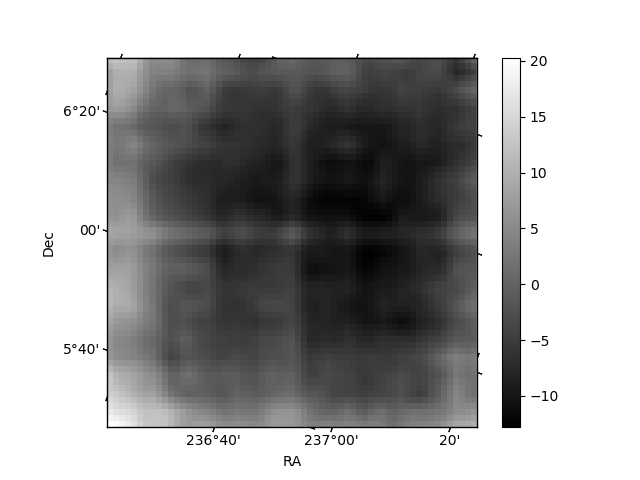
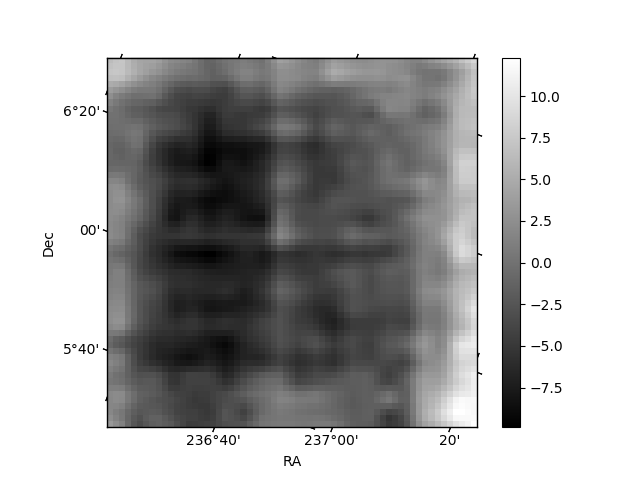
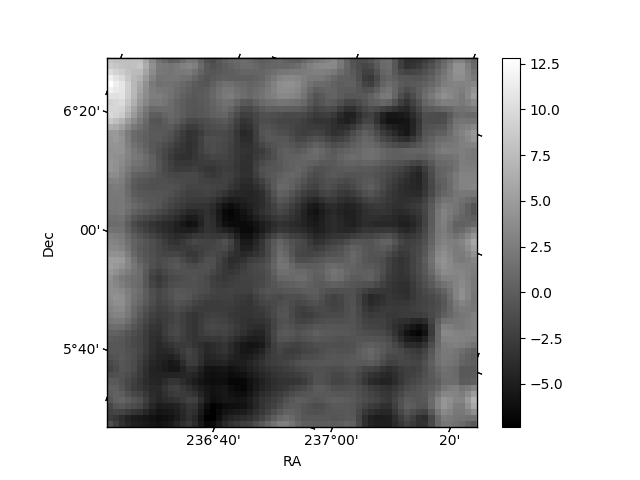
Histogram calculated using DETX and DETY for each event in the final _common_clean file
| Quadrant A | 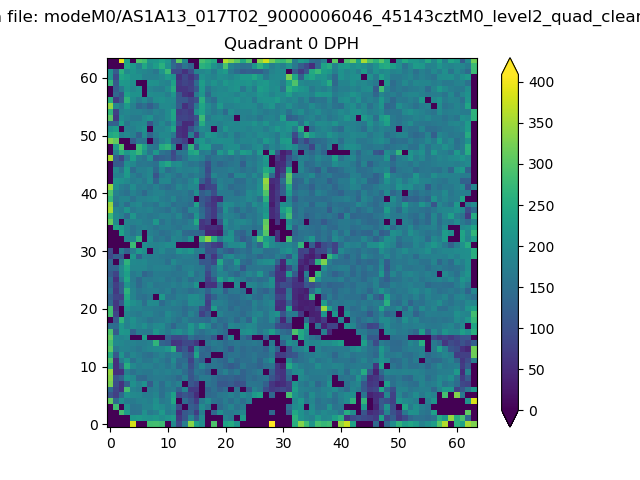 |
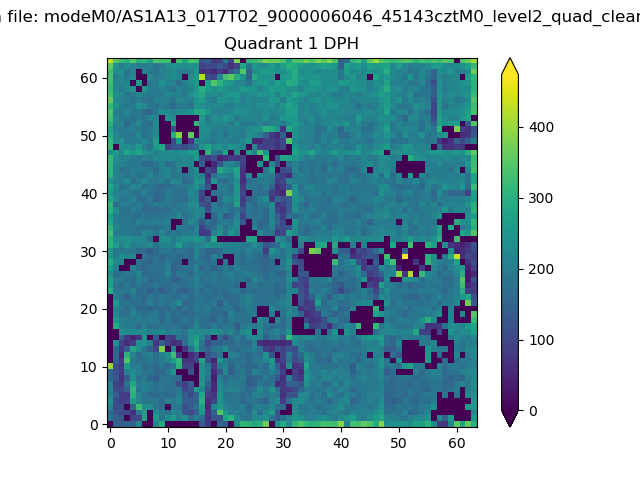 |
Quadrant B |
|---|---|---|---|
| Quadrant D | 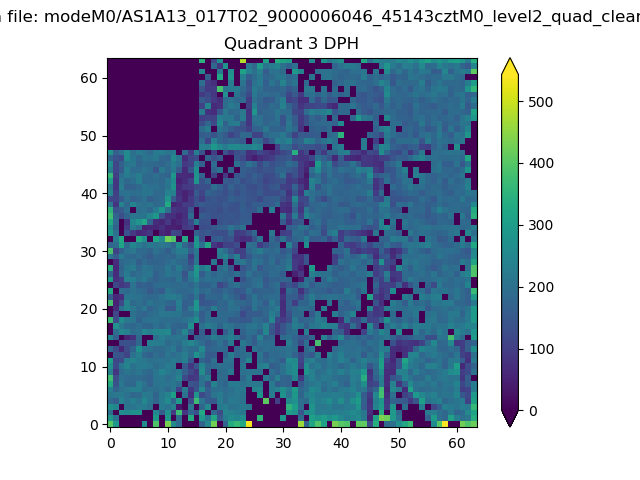 |
 |
Quadrant C |
| Plot type | Count rate plots | Images |
|---|---|---|
| Comparison with Poisson distribution Blue bars denote a histogram of data divided into 1 sec bins. Red curve is a Poisson curve with rate = median count rate of data. |
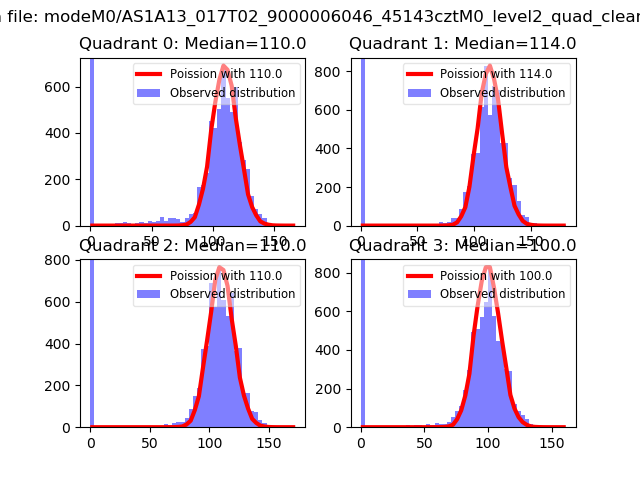 |
 |
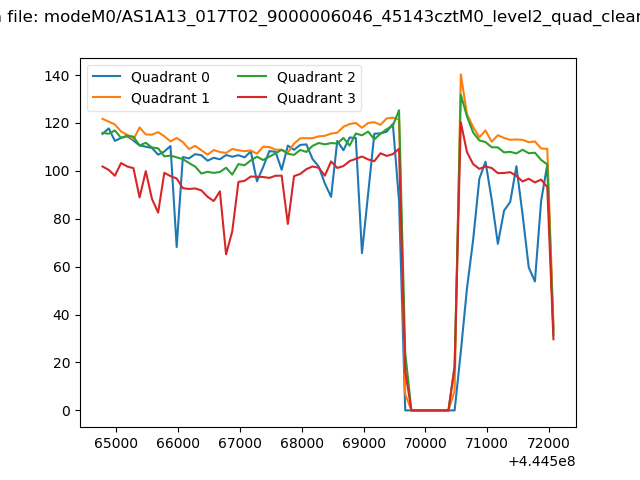
| Quadrant-wise count rates Data is divided into 100 sec bins |
 |
|
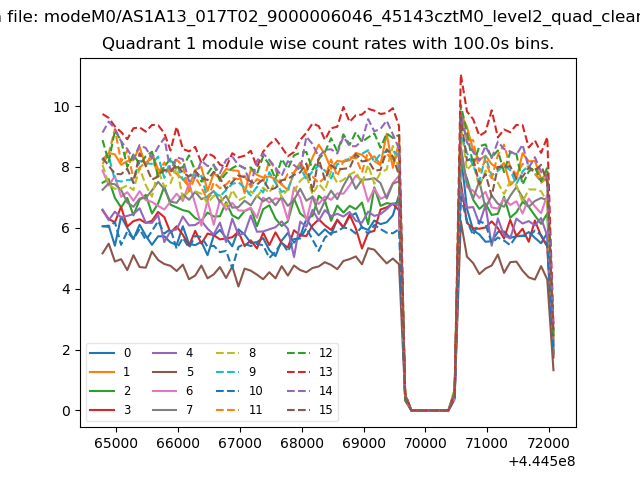
| Module-wise count rates for Quadrant A Data is divided into 100 sec bins |
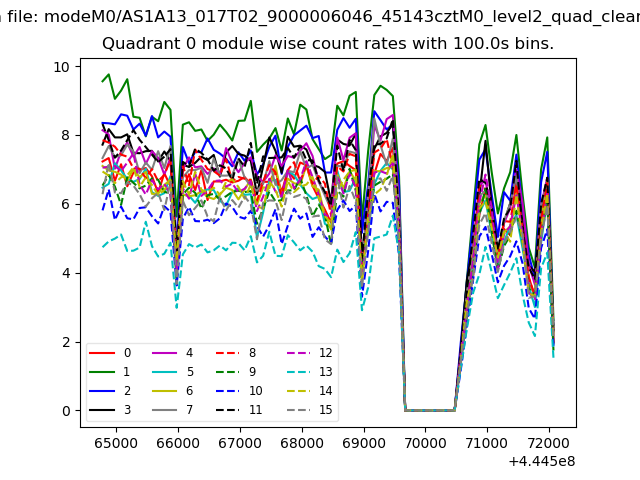 |
 |
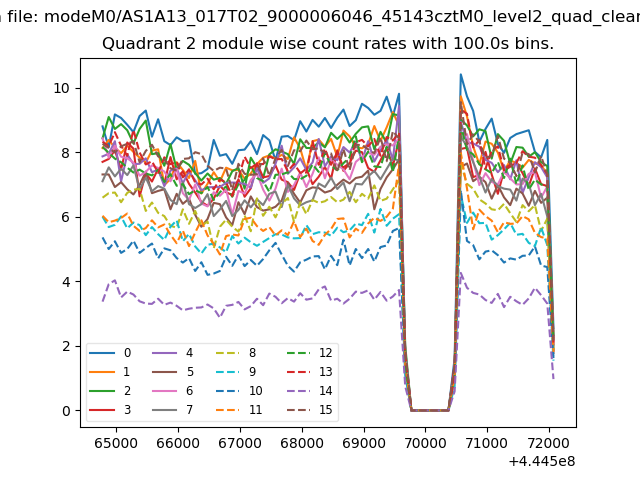
| Module-wise count rates for Quadrant B Data is divided into 100 sec bins |
 |
 |
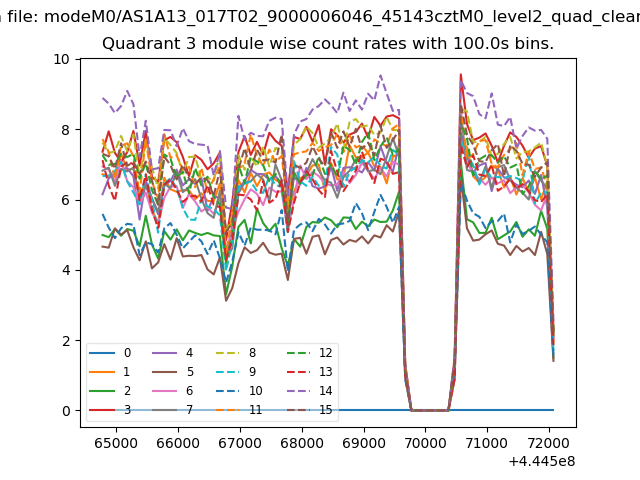
| Module-wise count rates for Quadrant C Data is divided into 100 sec bins |
 |
 |
| Module-wise count rates for Quadrant D Data is divided into 100 sec bins |
 |
 |
| Parameter | Plot |
|---|---|
| CZT HV Monitor | 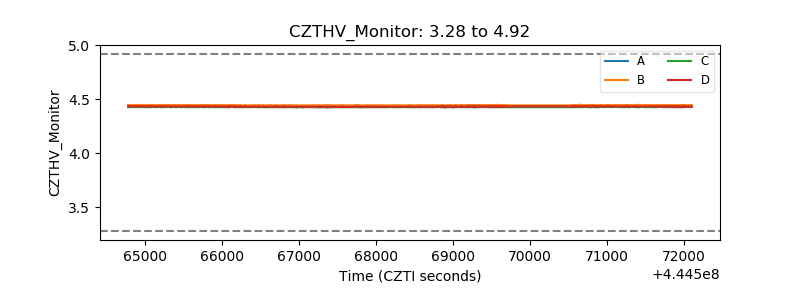 |
| D_VDD | 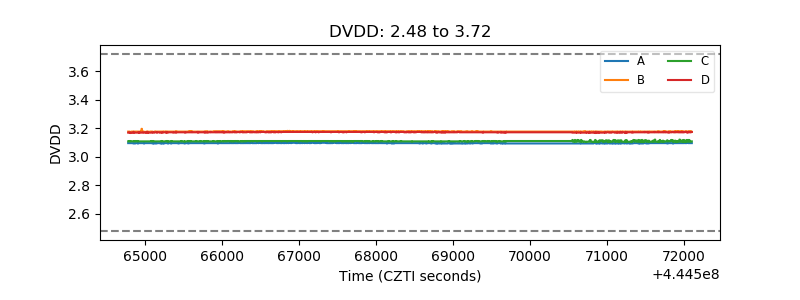 |
| Temperature 1 | 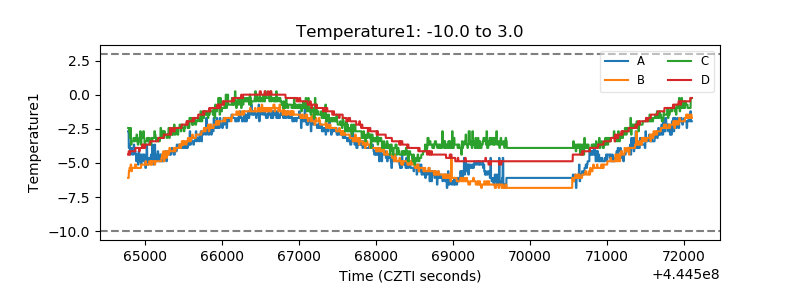 |
| Veto HV Monitor | 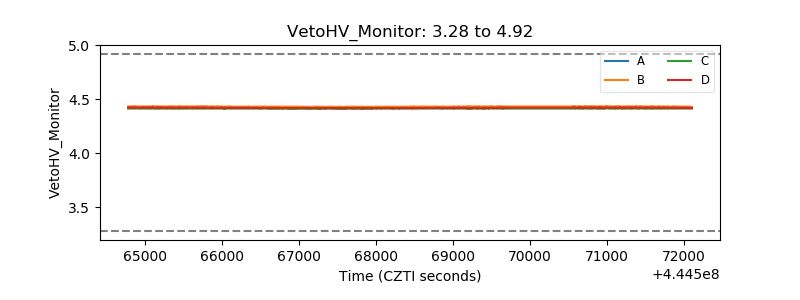 |
| Veto LLD | 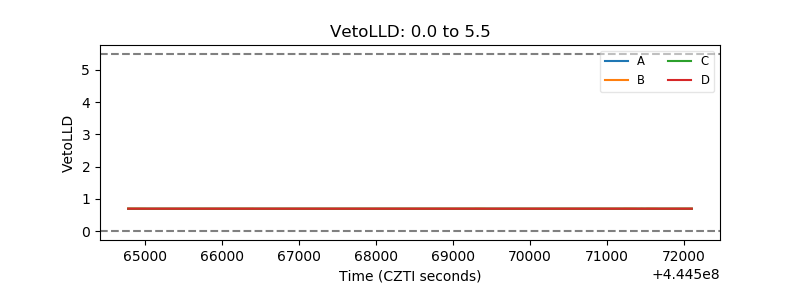 |
| Alpha Counter | 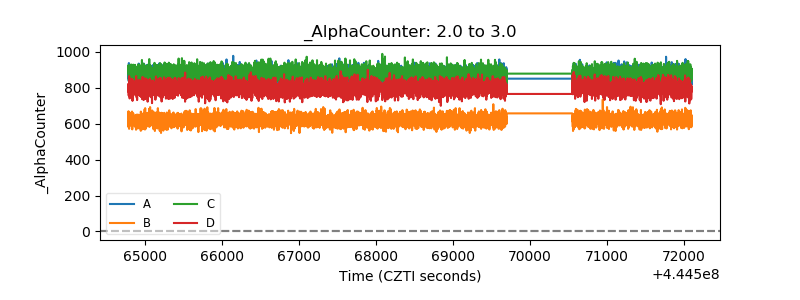 |
| _CPM_Rate | 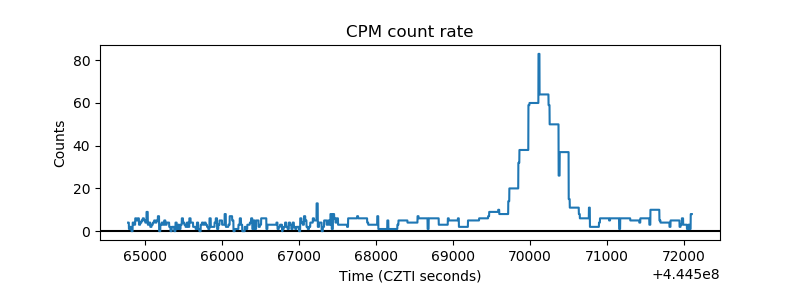 |
| CZT Counter | 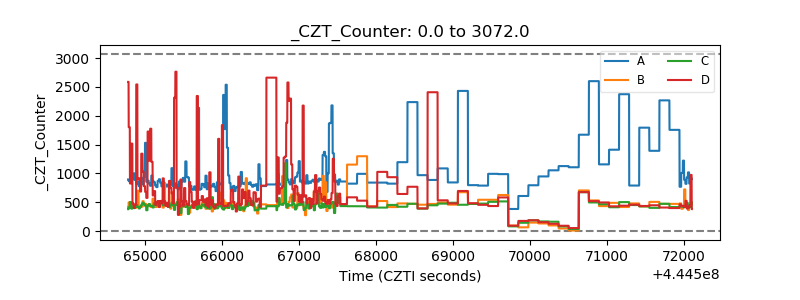 |
| +2.5 Volts monitor | 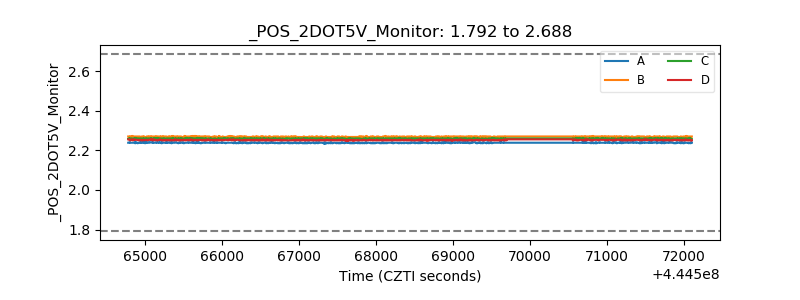 |
| +5 Volts monitor | 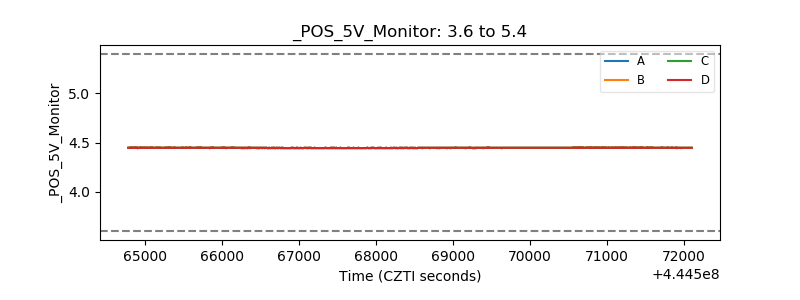 |
| _ROLL_ROT | 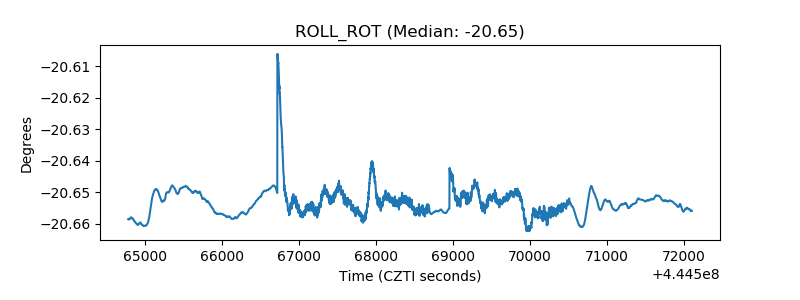 |
| _Roll_DEC | 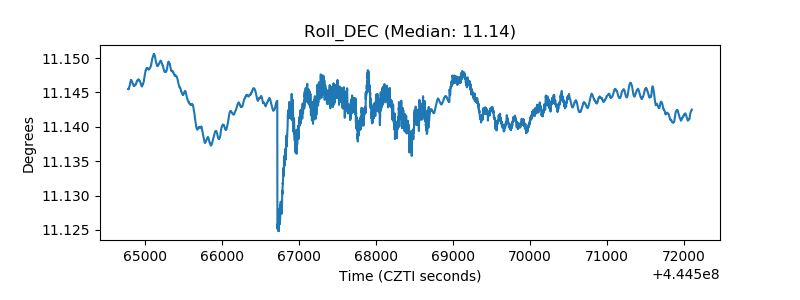 |
| _Roll_RA | 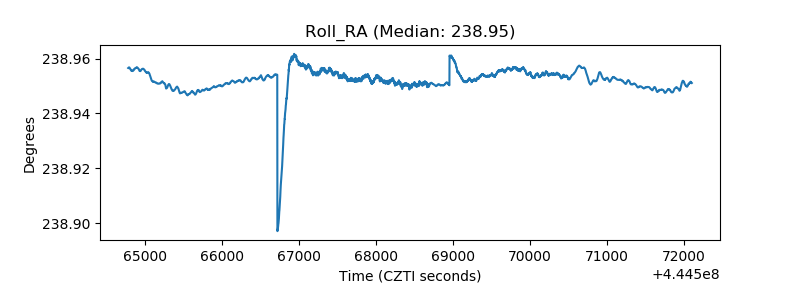 |
| Veto Counter | 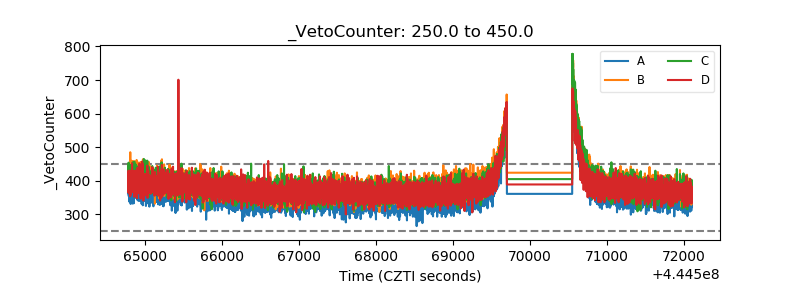 |