| Param | Original file | Final file |
|---|---|---|
| Filename | modeM0/AS1A13_017T02_9000006046_45144cztM0_level2.fits | modeM0/AS1A13_017T02_9000006046_45144cztM0_level2_quad_clean.evt |
| Size (bytes) | 748,448,640 | 105,194,880 |
| Size | 713.8 MB | 100.3 MB |
| Events in quadrant A | 14,811,267 | 356,879 |
| Events in quadrant B | 3,878,447 | 818,608 |
| Events in quadrant C | 3,660,460 | 784,377 |
| Events in quadrant D | 4,773,551 | 703,649 |
| Mode M0 | |||
|---|---|---|---|
| Quadrant | BADHDUFLAG | Total packets | Discarded packets |
| A | 0 | 49142 | 11 |
| B | 0 | 16484 | 6 |
| C | 0 | 16135 | 3 |
| D | 0 | 19206 | 3 |
| Mode M9 | |||
|---|---|---|---|
| Quadrant | BADHDUFLAG | Total packets | Discarded packets |
| A | 0 | 2 | 0 |
| B | 0 | 2 | 0 |
| C | 0 | 2 | 0 |
| D | 0 | 2 | 0 |
| Mode SS | |||
|---|---|---|---|
| Quadrant | BADHDUFLAG | Total packets | Discarded packets |
| A | 0 | 154 | 0 |
| B | 0 | 154 | 0 |
| C | 0 | 154 | 0 |
| D | 0 | 154 | 0 |
| Quadrant | Total seconds | Saturated seconds | Saturation percentage |
|---|---|---|---|
| A | 7487 | 4535 | 60.571658% |
| B | 7485 | 296 | 3.954576% |
| C | 7487 | 255 | 3.405904% |
| D | 7488 | 385 | 5.141560% |
Noise dominated data is calculated using 1-second bins in cleaned event files. If a bin has >2000 counts, and if more than 50% of those come from <1% of pixels, then it is considered to be noise-dominated and hence unusable.
| Quadrant | # 1 sec bins | Bins with >0 counts | Bins with >2000 counts | High rate bins dominated by noise | Noise dominated (total time) | Noise dominated (detector-on time) | Marked lightcurve |
|---|---|---|---|---|---|---|---|
| A | 7767 | 7487 | 3873 | 3873 | 49.86% | 51.73% |  |
| B | 7767 | 7488 | 29 | 29 | 0.37% | 0.39% | 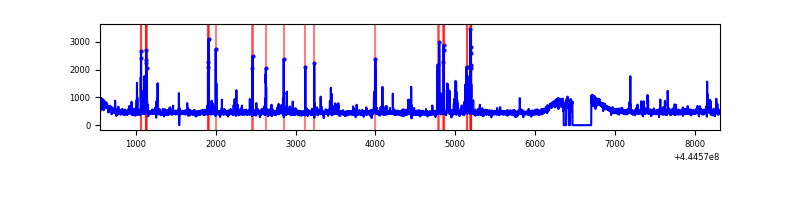 |
| C | 7767 | 7489 | 24 | 24 | 0.31% | 0.32% | 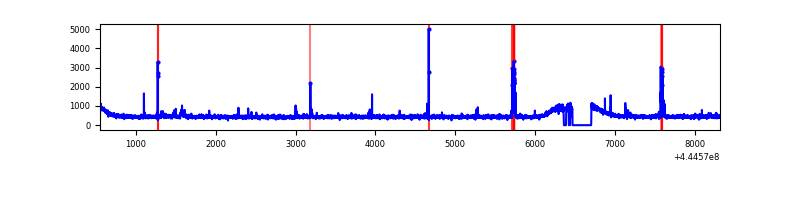 |
| D | 7768 | 7491 | 141 | 141 | 1.82% | 1.88% | 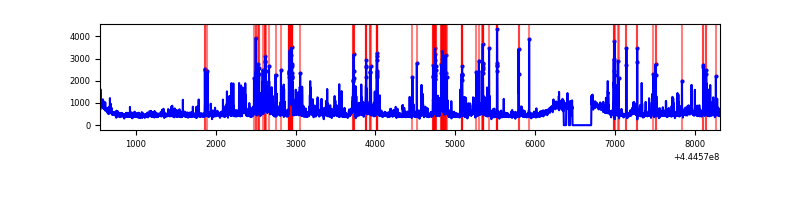 |
Top three noisy pixels from each quadrant. If the there are fewer than three noisy pixels in the level2.evt file, extra rows are filled as -1
| Pixel properties | Quadrant properties | ||||||
|---|---|---|---|---|---|---|---|
| Quadrant | DetID | PixID | Counts | Sigma | Mean | Median | Sigma |
| A | 15 | 223 | 10287697 | 79091.45 | 622 | 608 | 130.1 |
| A | 10 | 83 | 2012192 | 15465.9 | 622 | 608 | 130.1 |
| A | 15 | 174 | 41993 | 318.19 | 622 | 608 | 130.1 |
| B | 10 | 3 | 161245 | 893.14 | 889 | 860 | 179.6 |
| B | 4 | 170 | 93340 | 514.99 | 889 | 860 | 179.6 |
| B | 0 | 183 | 26119 | 140.66 | 889 | 860 | 179.6 |
| C | 3 | 233 | 69385 | 324.05 | 887 | 892 | 211.4 |
| C | 2 | 14 | 54354 | 252.94 | 887 | 892 | 211.4 |
| C | 6 | 247 | 44773 | 207.61 | 887 | 892 | 211.4 |
| D | 1 | 52 | 364282 | 1630.47 | 884 | 854 | 222.9 |
| D | 13 | 249 | 330583 | 1479.29 | 884 | 854 | 222.9 |
| D | 2 | 249 | 173542 | 774.74 | 884 | 854 | 222.9 |
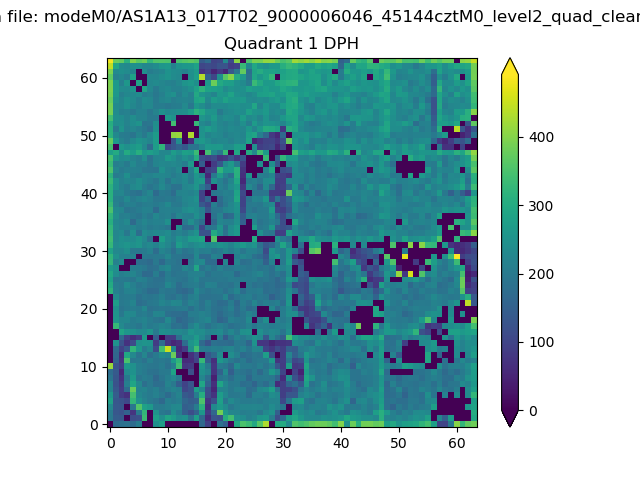
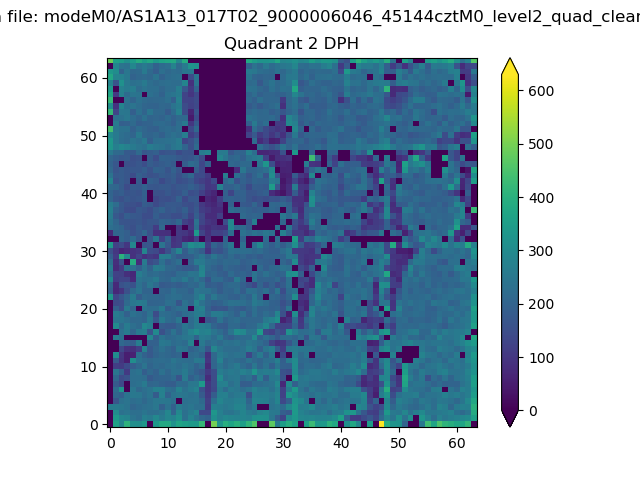
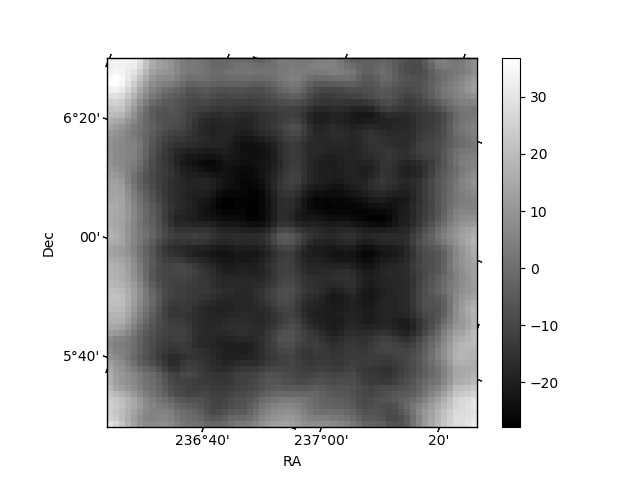
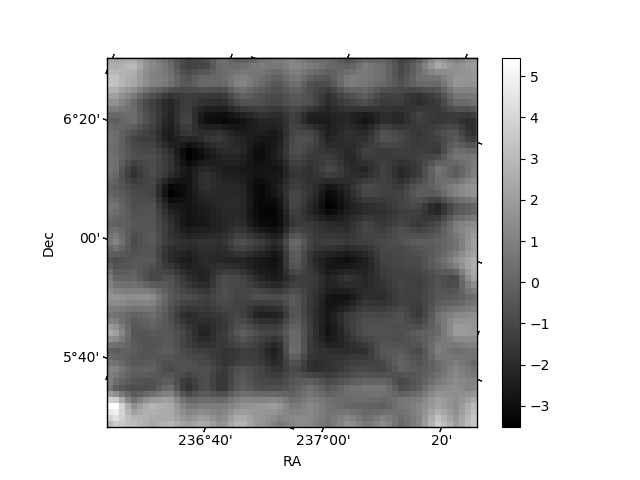
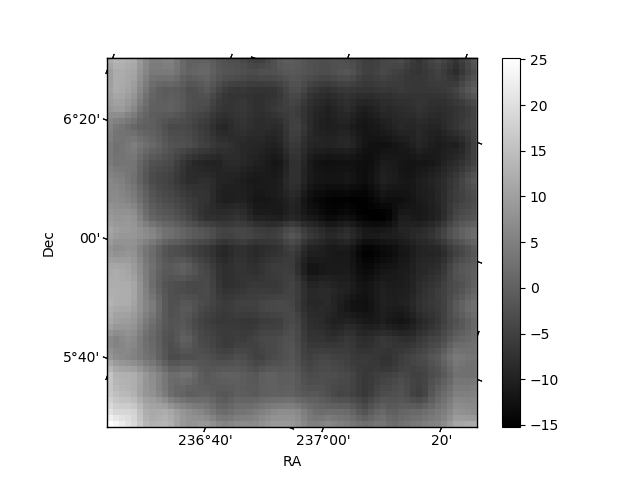
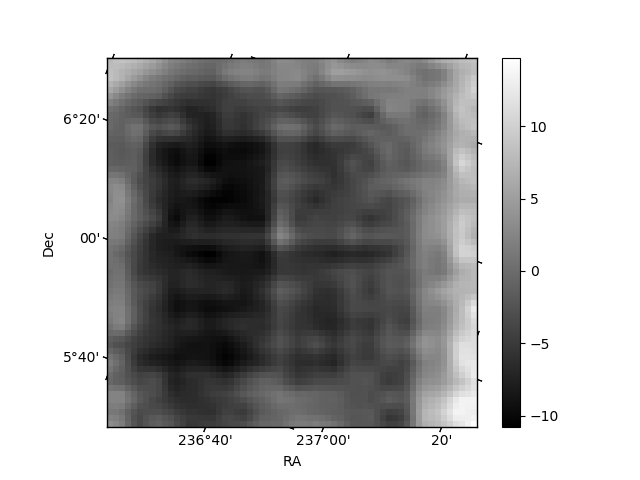
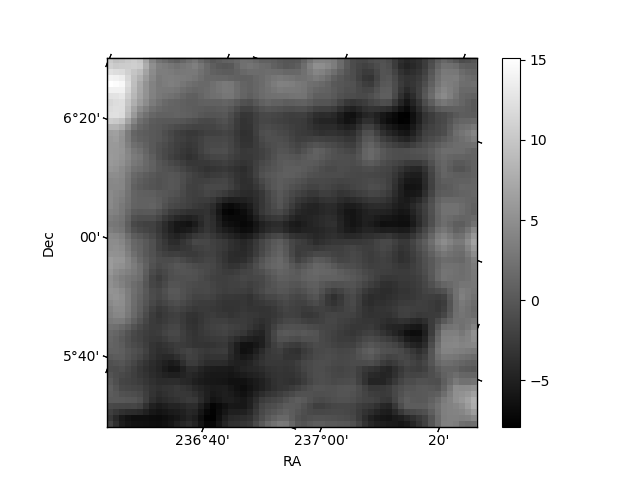
Histogram calculated using DETX and DETY for each event in the final _common_clean file
| Quadrant A | 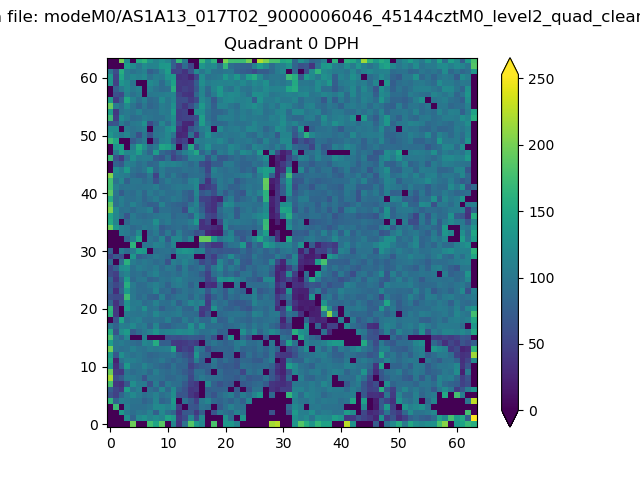 |
 |
Quadrant B |
|---|---|---|---|
| Quadrant D | 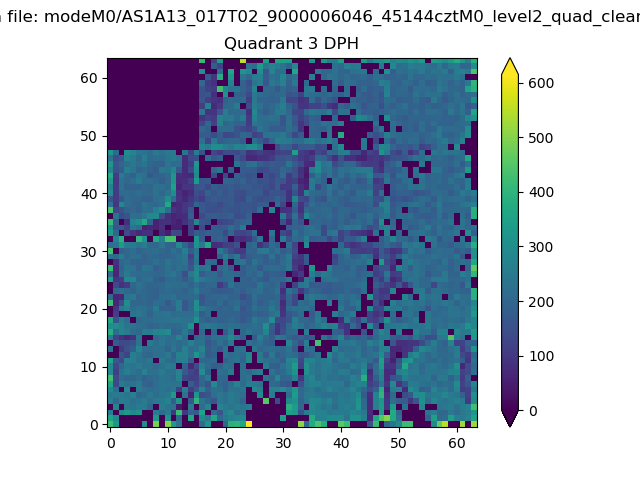 |
 |
Quadrant C |
| Plot type | Count rate plots | Images |
|---|---|---|
| Comparison with Poisson distribution Blue bars denote a histogram of data divided into 1 sec bins. Red curve is a Poisson curve with rate = median count rate of data. |
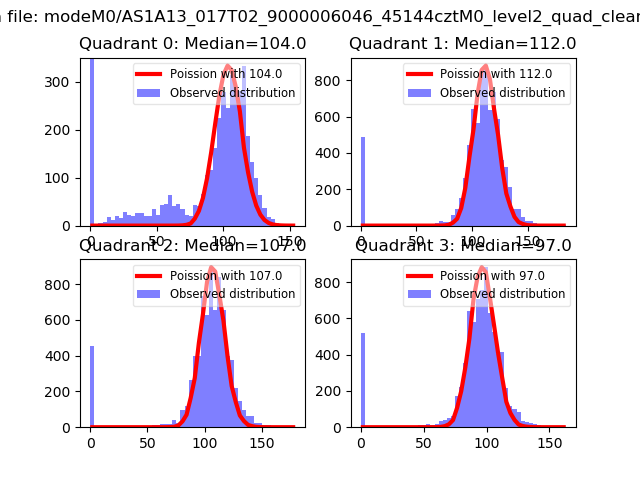 |
 |
| Quadrant-wise count rates Data is divided into 100 sec bins |
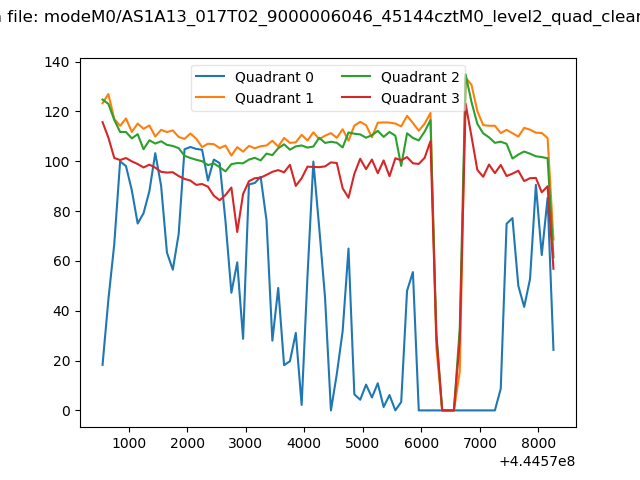 |
|
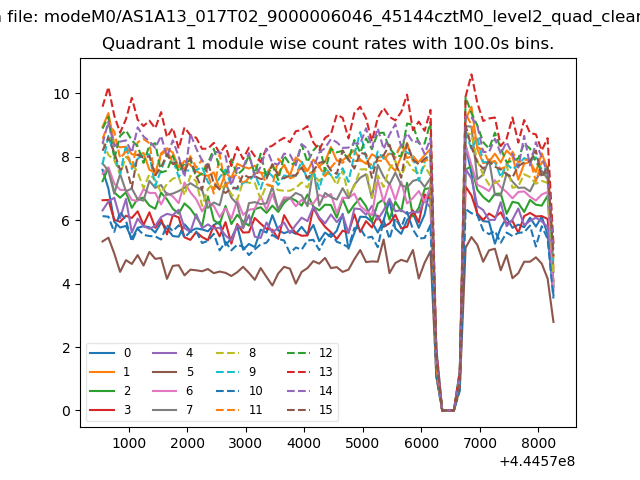
| Module-wise count rates for Quadrant A Data is divided into 100 sec bins |
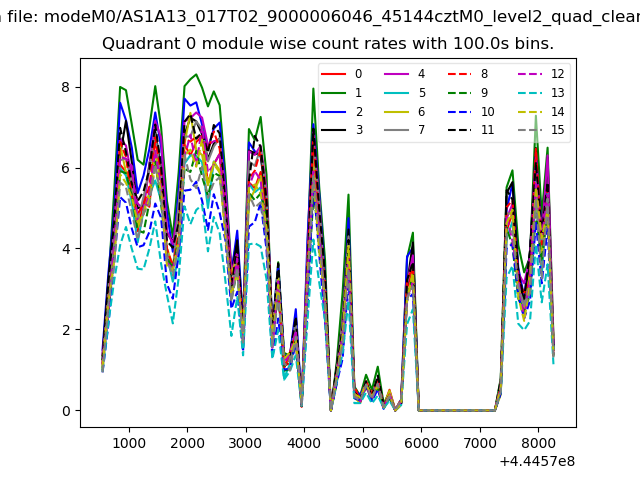 |
 |
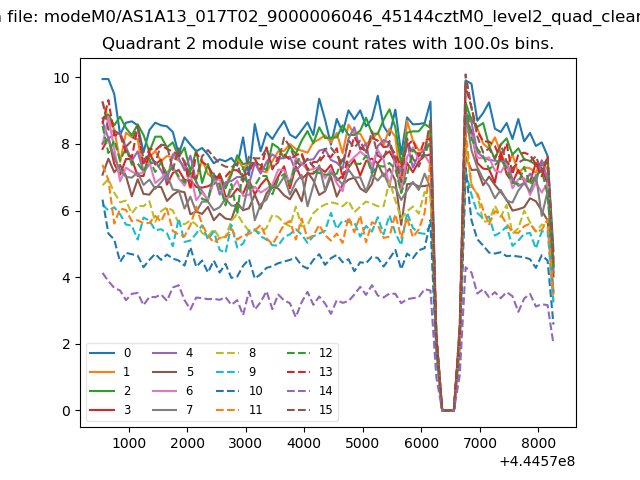
| Module-wise count rates for Quadrant B Data is divided into 100 sec bins |
 |
 |
| Module-wise count rates for Quadrant C Data is divided into 100 sec bins |
 |
 |
| Module-wise count rates for Quadrant D Data is divided into 100 sec bins |
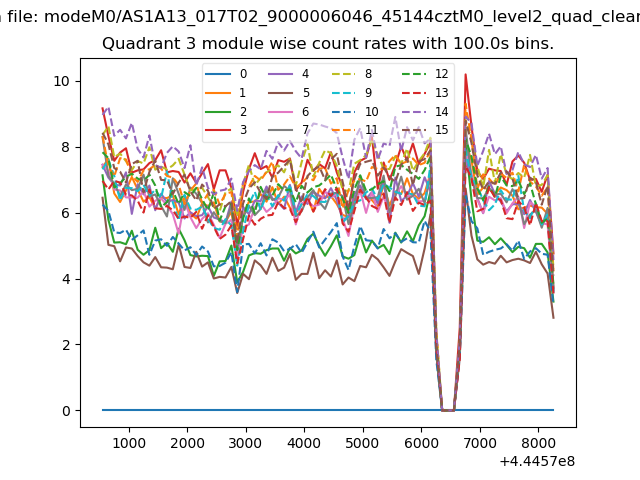 |
 |
| Parameter | Plot |
|---|---|
| CZT HV Monitor | 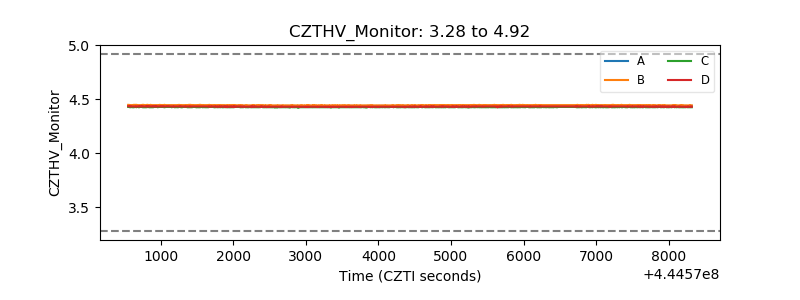 |
| D_VDD | 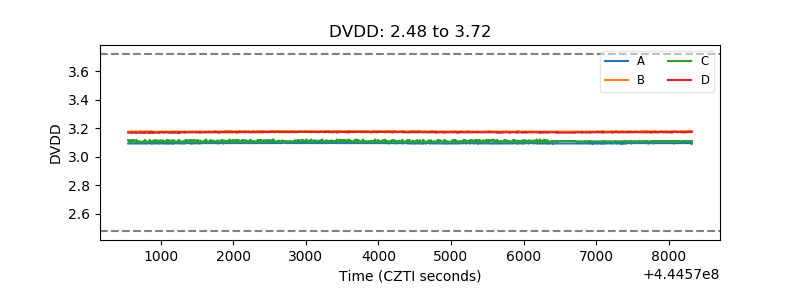 |
| Temperature 1 | 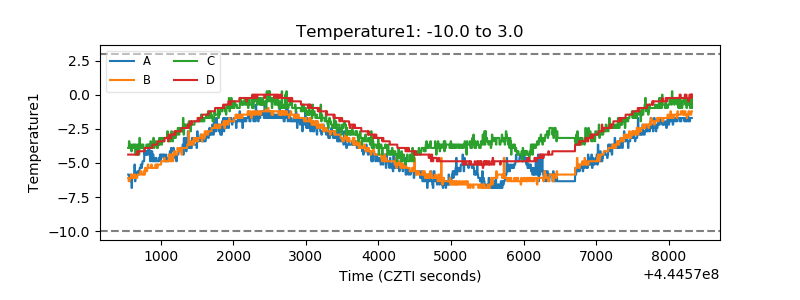 |
| Veto HV Monitor |  |
| Veto LLD | 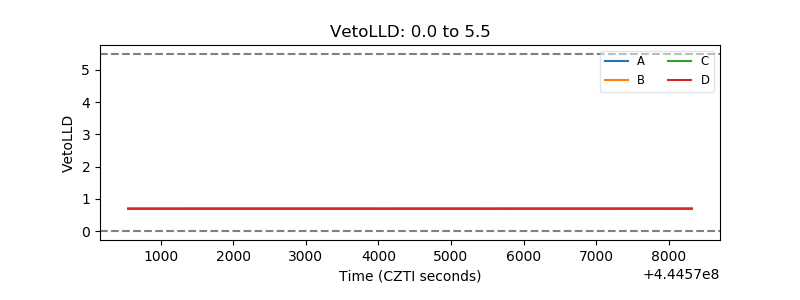 |
| Alpha Counter | 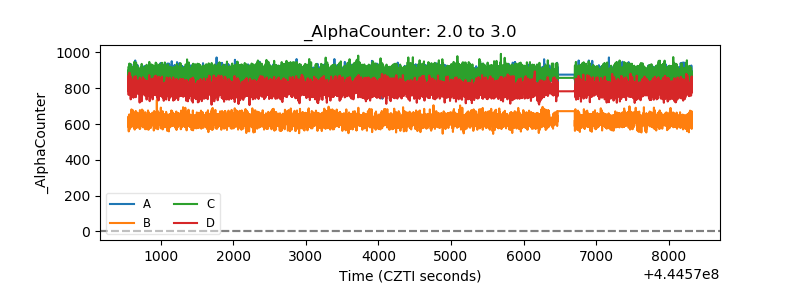 |
| _CPM_Rate | 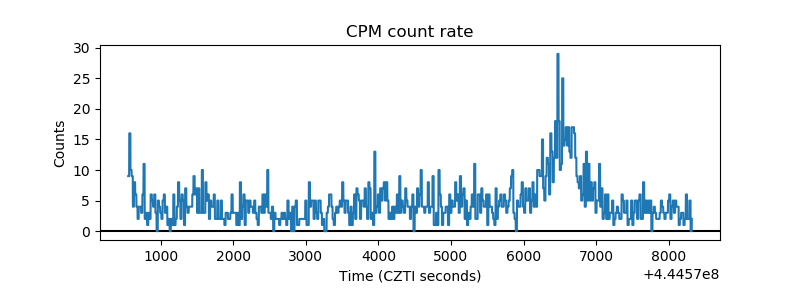 |
| CZT Counter | 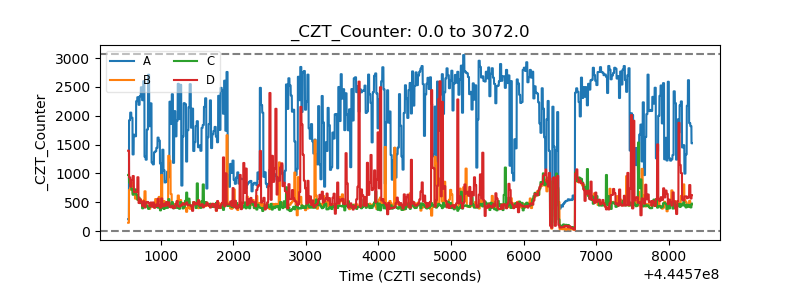 |
| +2.5 Volts monitor | 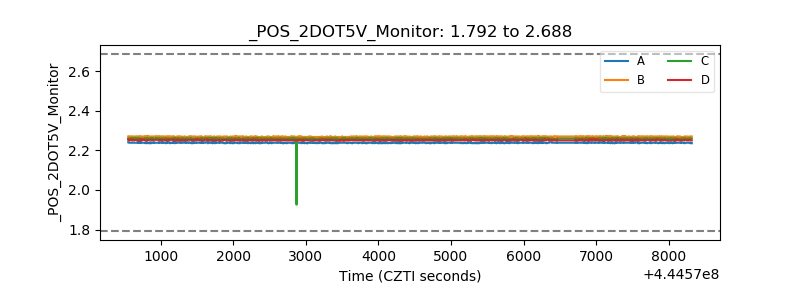 |
| +5 Volts monitor | 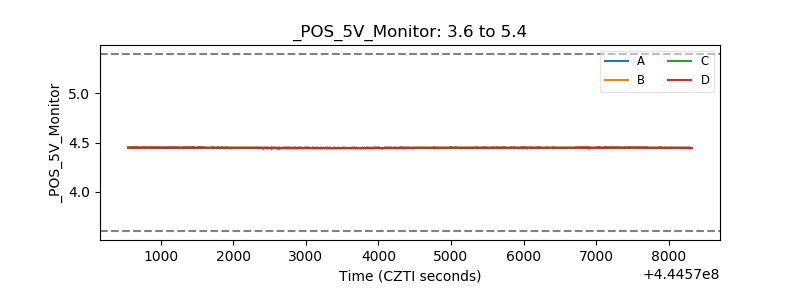 |
| _ROLL_ROT | 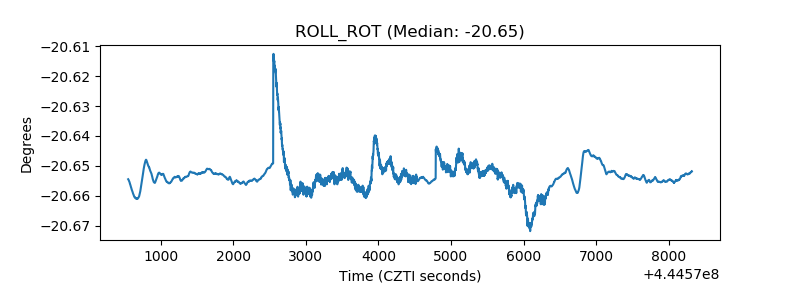 |
| _Roll_DEC | 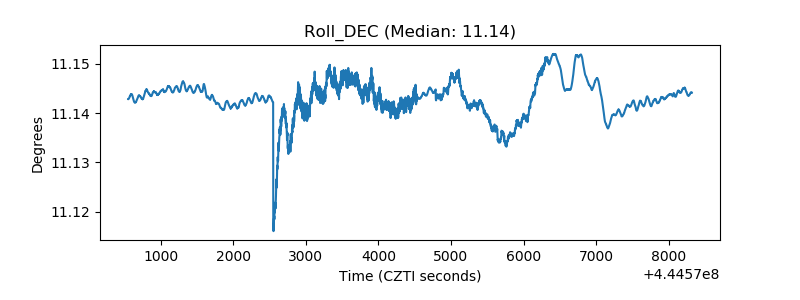 |
| _Roll_RA | 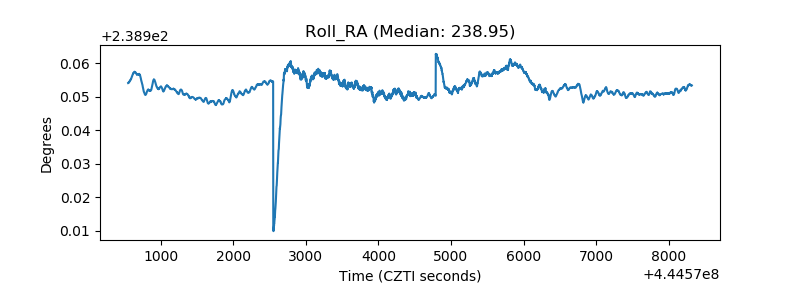 |
| Veto Counter | 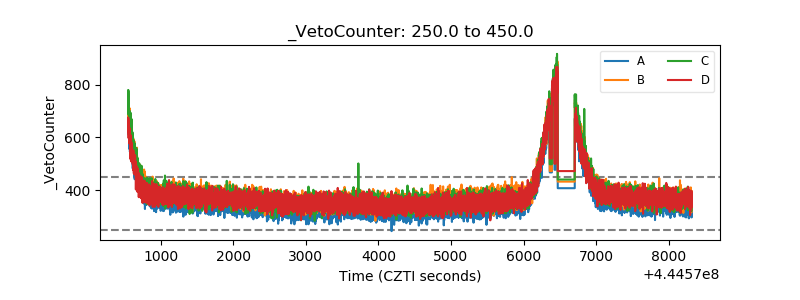 |