| Param | Original file | Final file |
|---|---|---|
| Filename | modeM0/AS1A13_017T02_9000006046_45145cztM0_level2.fits | modeM0/AS1A13_017T02_9000006046_45145cztM0_level2_quad_clean.evt |
| Size (bytes) | 383,359,680 | 59,708,160 |
| Size | 365.6 MB | 56.9 MB |
| Events in quadrant A | 7,450,691 | 257,925 |
| Events in quadrant B | 2,150,006 | 443,722 |
| Events in quadrant C | 1,801,281 | 428,006 |
| Events in quadrant D | 2,468,367 | 388,611 |
| Mode M0 | |||
|---|---|---|---|
| Quadrant | BADHDUFLAG | Total packets | Discarded packets |
| A | 0 | 25057 | 70 |
| B | 0 | 9165 | 9 |
| C | 0 | 8376 | 5 |
| D | 0 | 10151 | 12 |
| Mode SS | |||
|---|---|---|---|
| Quadrant | BADHDUFLAG | Total packets | Discarded packets |
| A | 0 | 82 | 0 |
| B | 0 | 82 | 0 |
| C | 0 | 82 | 0 |
| D | 0 | 82 | 0 |
| Quadrant | Total seconds | Saturated seconds | Saturation percentage |
|---|---|---|---|
| A | 4105 | 1909 | 46.504263% |
| B | 4110 | 27 | 0.656934% |
| C | 4111 | 6 | 0.145950% |
| D | 4108 | 56 | 1.363194% |
Noise dominated data is calculated using 1-second bins in cleaned event files. If a bin has >2000 counts, and if more than 50% of those come from <1% of pixels, then it is considered to be noise-dominated and hence unusable.
| Quadrant | # 1 sec bins | Bins with >0 counts | Bins with >2000 counts | High rate bins dominated by noise | Noise dominated (total time) | Noise dominated (detector-on time) | Marked lightcurve |
|---|---|---|---|---|---|---|---|
| A | 4106 | 4105 | 1636 | 1636 | 39.84% | 39.85% | 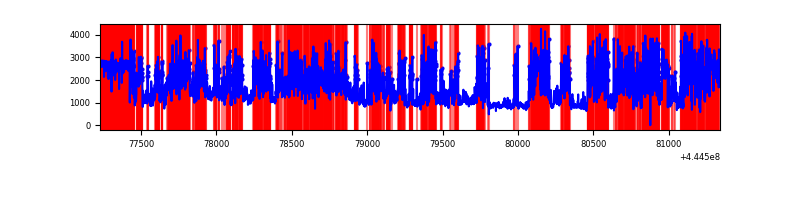 |
| B | 4112 | 4111 | 10 | 10 | 0.24% | 0.24% | 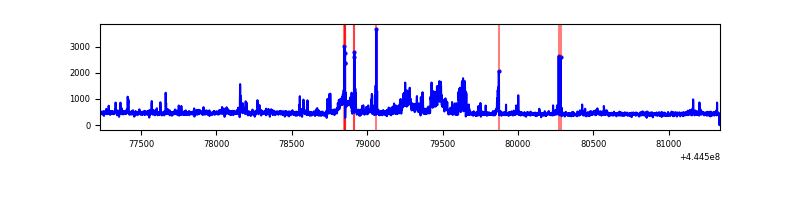 |
| C | 4113 | 4112 | 5 | 5 | 0.12% | 0.12% | 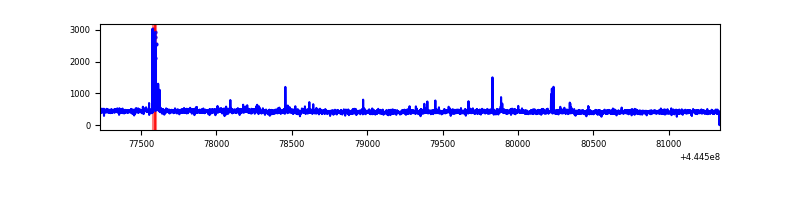 |
| D | 4111 | 4109 | 53 | 53 | 1.29% | 1.29% | 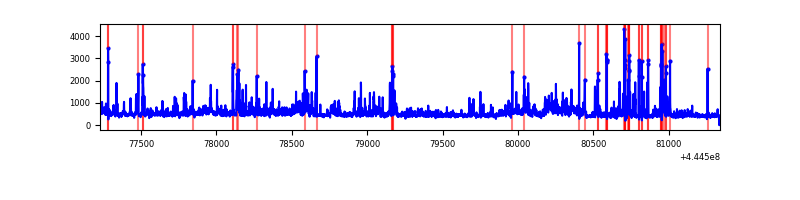 |
Top three noisy pixels from each quadrant. If the there are fewer than three noisy pixels in the level2.evt file, extra rows are filled as -1
| Pixel properties | Quadrant properties | ||||||
|---|---|---|---|---|---|---|---|
| Quadrant | DetID | PixID | Counts | Sigma | Mean | Median | Sigma |
| A | 15 | 223 | 4741288 | 60396.86 | 370 | 363 | 78.5 |
| A | 10 | 83 | 1231405 | 15682.82 | 370 | 363 | 78.5 |
| A | 13 | 248 | 21686 | 271.64 | 370 | 363 | 78.5 |
| B | 5 | 255 | 149720 | 1655.15 | 450 | 436 | 90.2 |
| B | 4 | 170 | 75252 | 829.5 | 450 | 436 | 90.2 |
| B | 0 | 183 | 40503 | 444.23 | 450 | 436 | 90.2 |
| C | 2 | 14 | 46396 | 435.07 | 444 | 446 | 105.6 |
| C | 3 | 233 | 7079 | 62.8 | 444 | 446 | 105.6 |
| C | 12 | 250 | 6587 | 58.14 | 444 | 446 | 105.6 |
| D | 13 | 249 | 233376 | 2062.35 | 440 | 426 | 113.0 |
| D | 1 | 52 | 168075 | 1484.23 | 440 | 426 | 113.0 |
| D | 1 | 47 | 97286 | 857.52 | 440 | 426 | 113.0 |
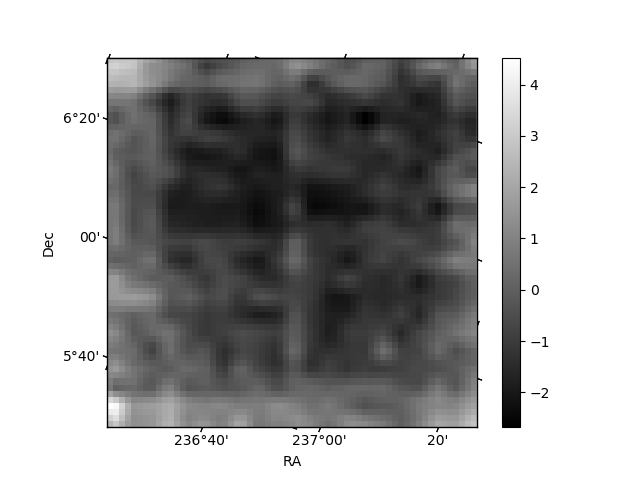
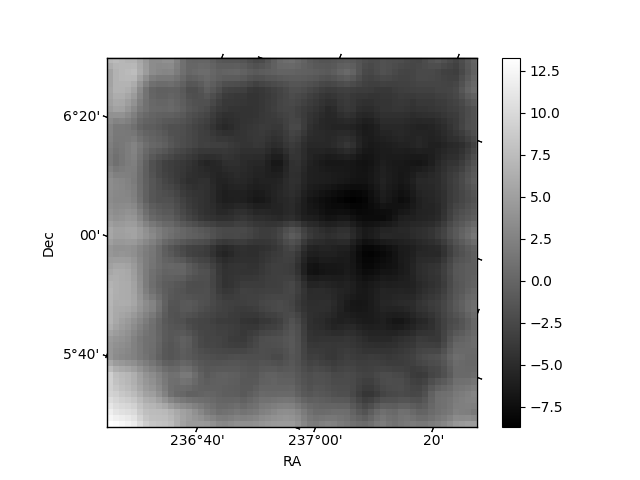
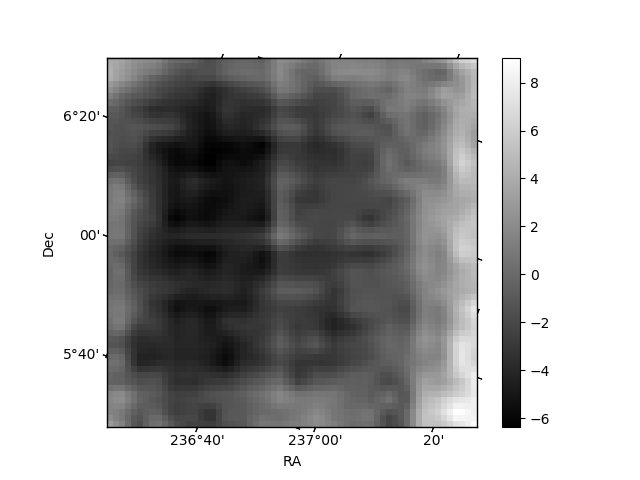
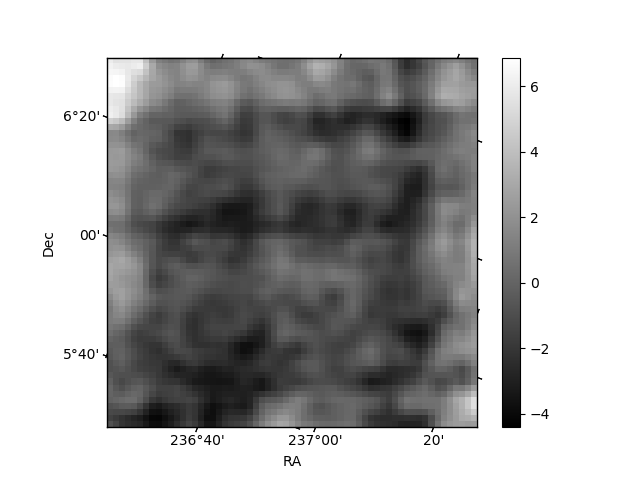
Histogram calculated using DETX and DETY for each event in the final _common_clean file
| Quadrant A | 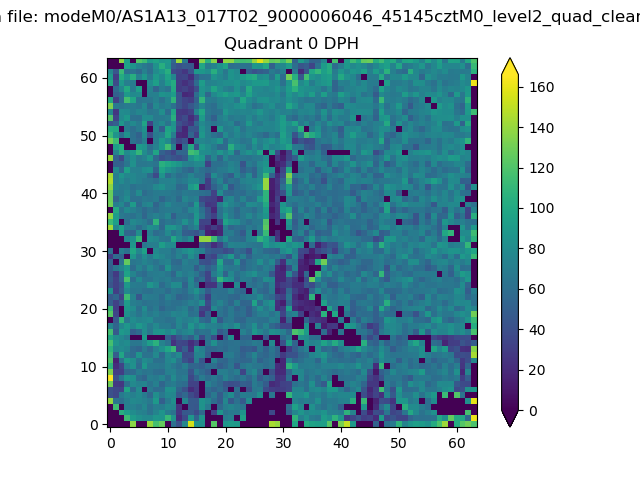 |
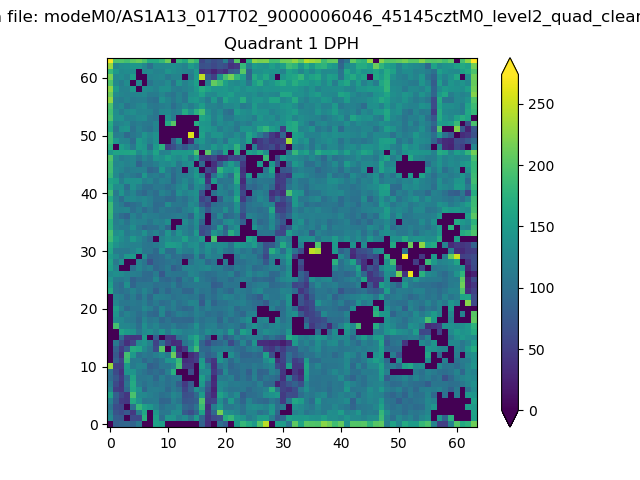 |
Quadrant B |
|---|---|---|---|
| Quadrant D | 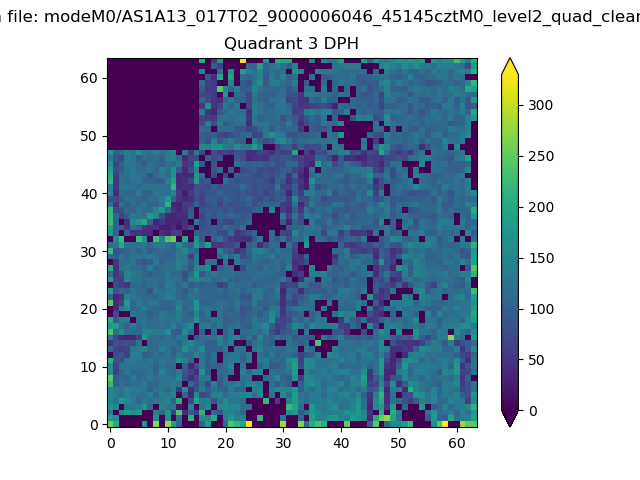 |
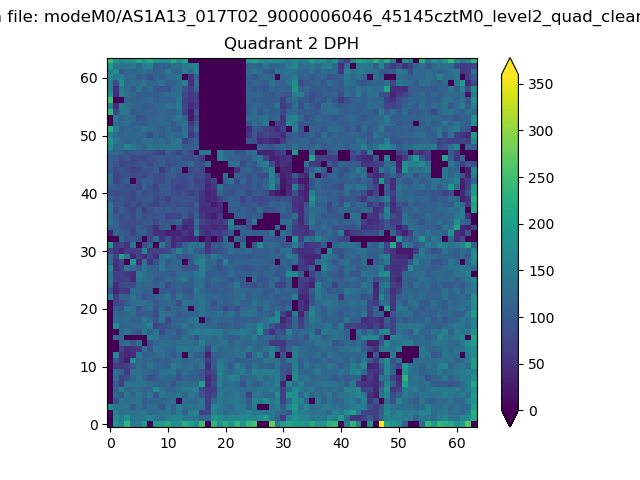 |
Quadrant C |
| Plot type | Count rate plots | Images |
|---|---|---|
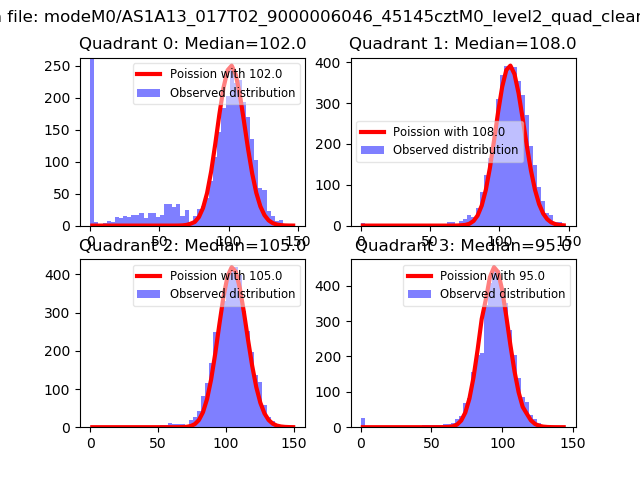
| Comparison with Poisson distribution Blue bars denote a histogram of data divided into 1 sec bins. Red curve is a Poisson curve with rate = median count rate of data. |
 |
 |
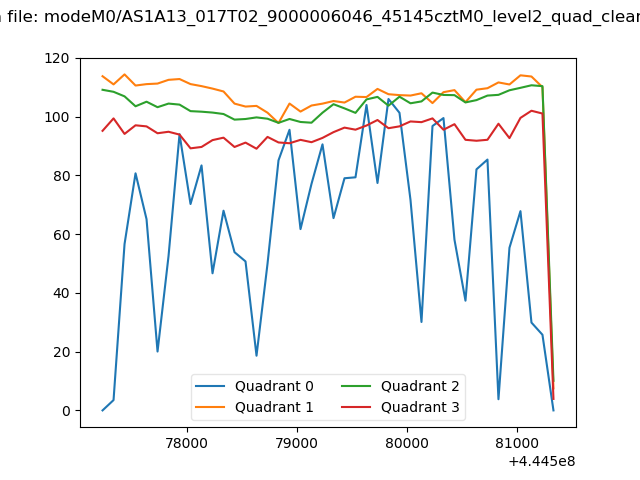
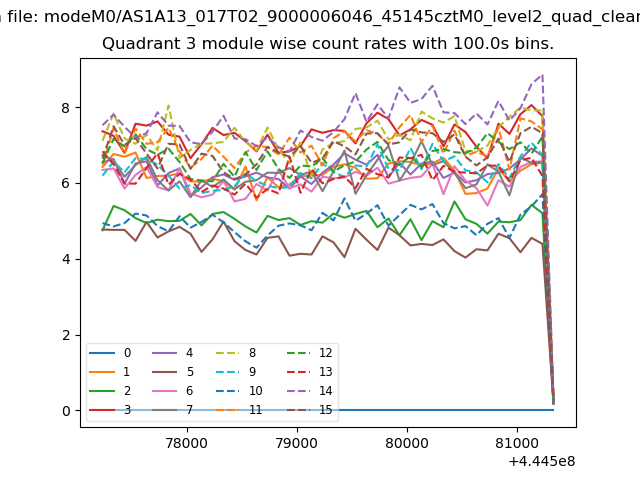
| Quadrant-wise count rates Data is divided into 100 sec bins |
 |
|
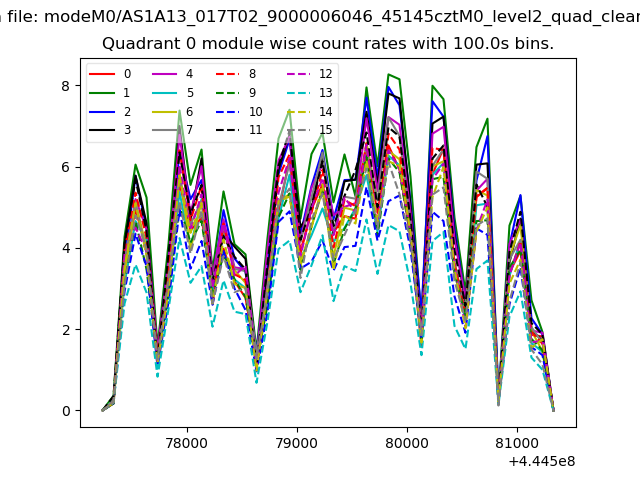
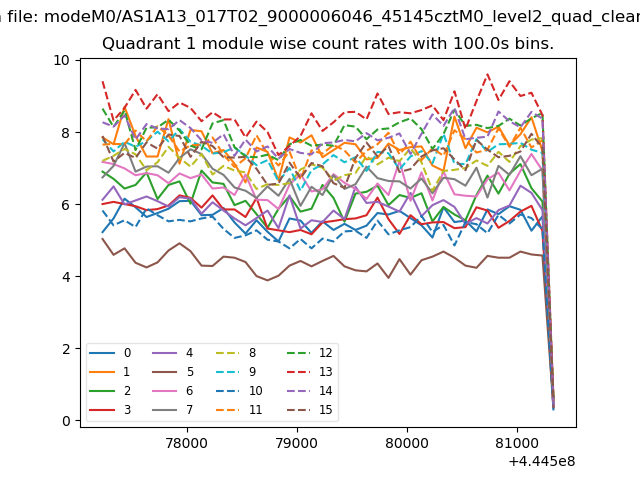
| Module-wise count rates for Quadrant A Data is divided into 100 sec bins |
 |
 |
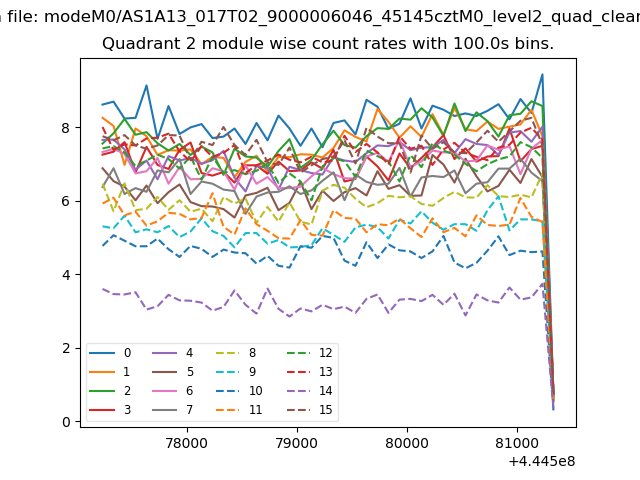
| Module-wise count rates for Quadrant B Data is divided into 100 sec bins |
 |
 |
| Module-wise count rates for Quadrant C Data is divided into 100 sec bins |
 |
 |
| Module-wise count rates for Quadrant D Data is divided into 100 sec bins |
 |
 |
| Parameter | Plot |
|---|---|
| CZT HV Monitor | 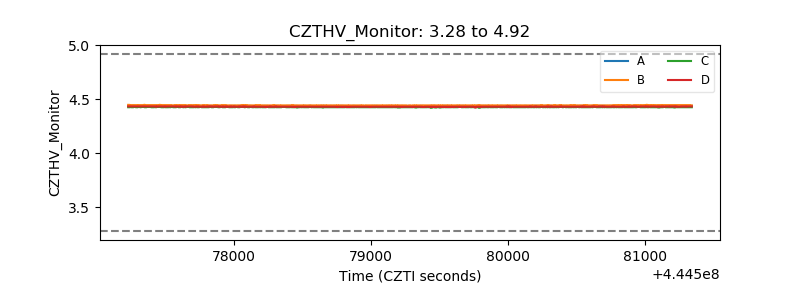 |
| D_VDD | 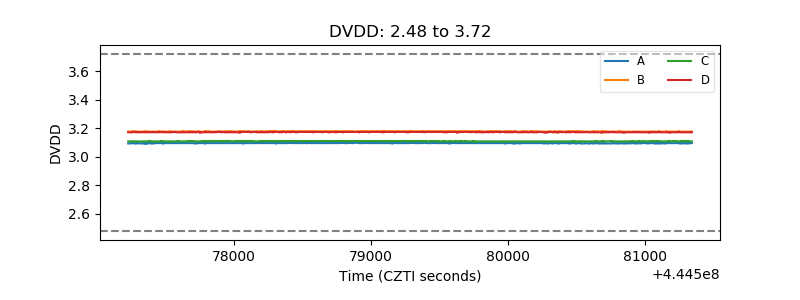 |
| Temperature 1 | 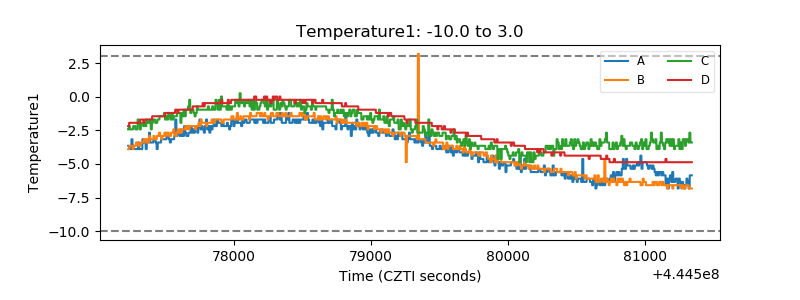 |
| Veto HV Monitor | 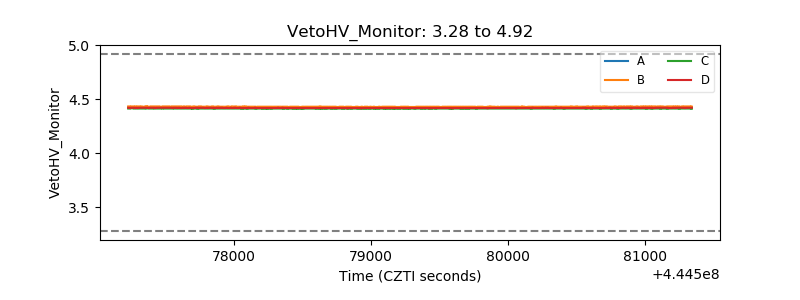 |
| Veto LLD | 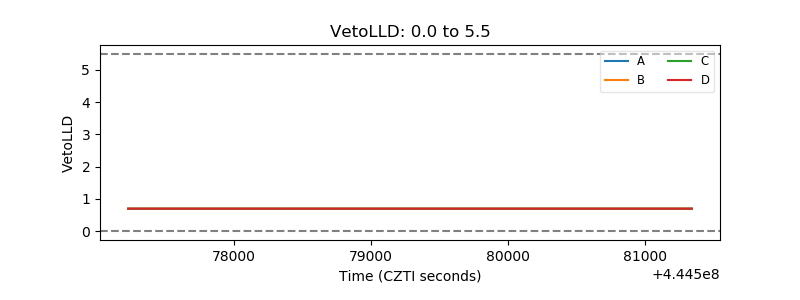 |
| Alpha Counter | 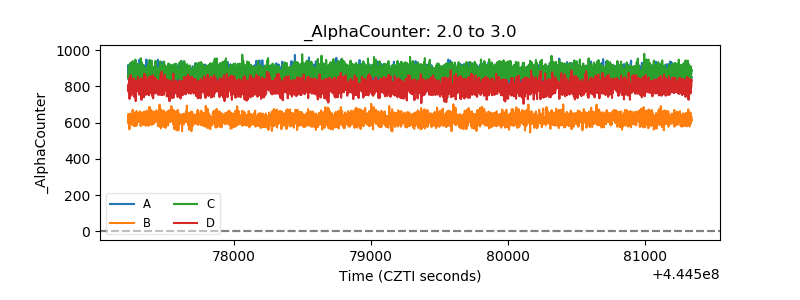 |
| _CPM_Rate | 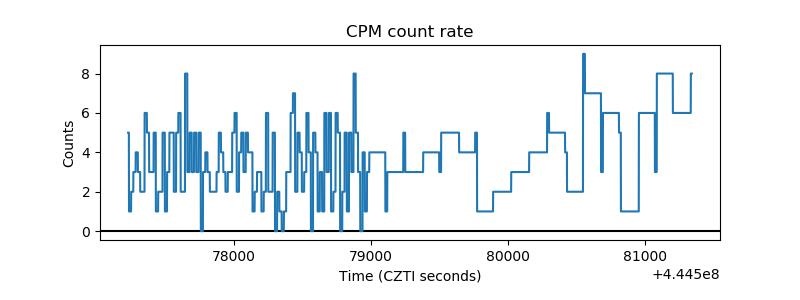 |
| CZT Counter | 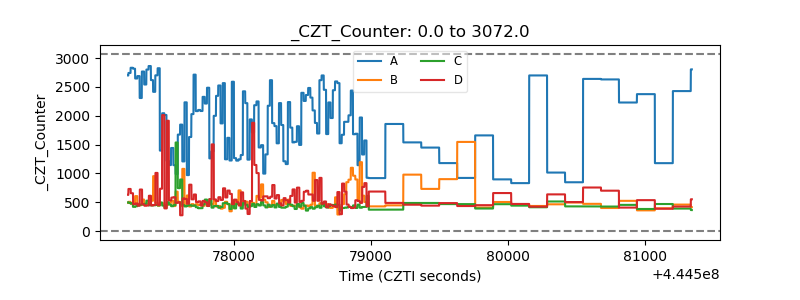 |
| +2.5 Volts monitor | 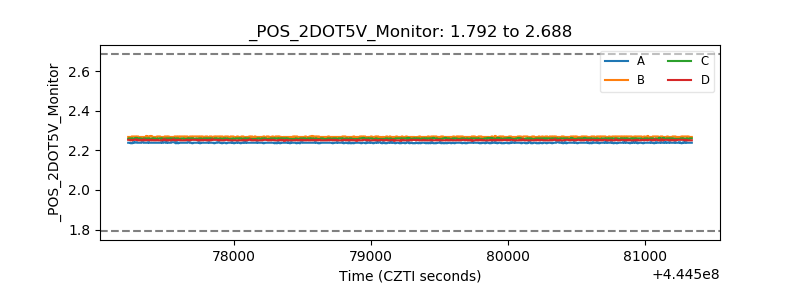 |
| +5 Volts monitor | 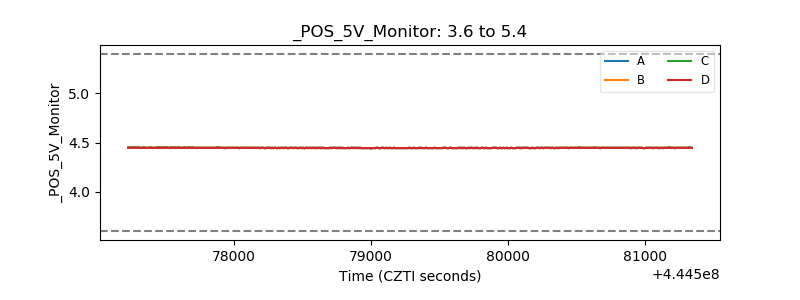 |
| _ROLL_ROT | 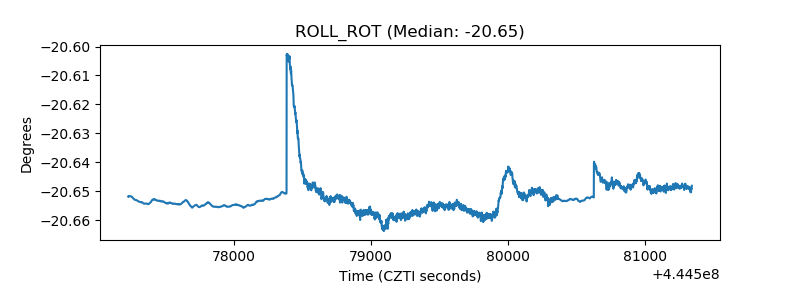 |
| _Roll_DEC | 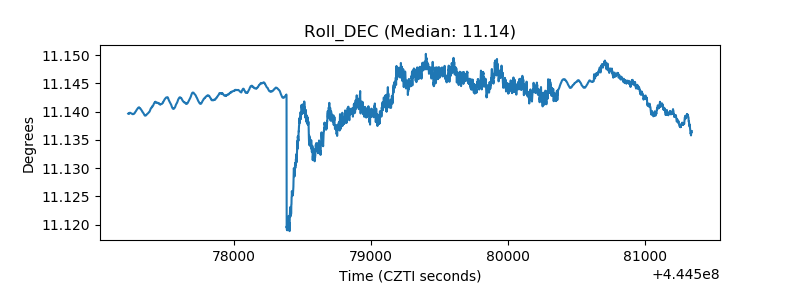 |
| _Roll_RA | 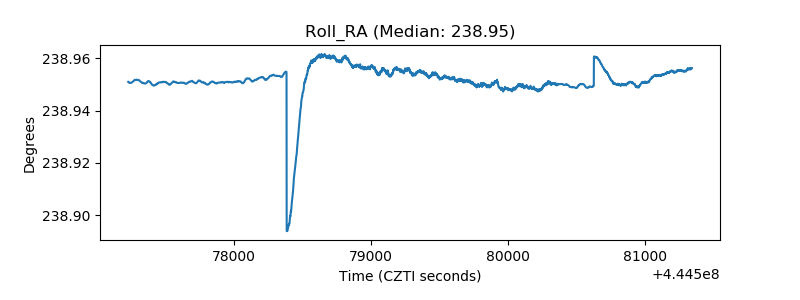 |
| Veto Counter | 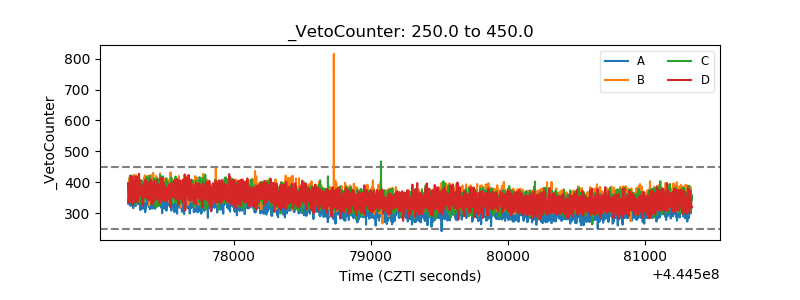 |