| Param | Original file | Final file |
|---|---|---|
| Filename | modeM0/AS1A13_049T04_9000006048_45151cztM0_level2.fits | modeM0/AS1A13_049T04_9000006048_45151cztM0_level2_quad_clean.evt |
| Size (bytes) | 2,551,014,720 | 392,820,480 |
| Size | 2.4 GB | 374.6 MB |
| Events in quadrant A | 40,103,681 | 1,819,231 |
| Events in quadrant B | 14,188,061 | 2,945,468 |
| Events in quadrant C | 12,682,962 | 2,853,510 |
| Events in quadrant D | 25,343,407 | 2,392,240 |
| Mode M9 | |||
|---|---|---|---|
| Quadrant | BADHDUFLAG | Total packets | Discarded packets |
| A | 0 | 26 | 0 |
| B | 0 | 26 | 0 |
| C | 0 | 26 | 0 |
| D | 0 | 26 | 0 |
| Mode M0 | |||
|---|---|---|---|
| Quadrant | BADHDUFLAG | Total packets | Discarded packets |
| A | 0 | 138734 | 9 |
| B | 0 | 61178 | 4 |
| C | 0 | 57611 | 4 |
| D | 0 | 94330 | 19 |
| Mode SS | |||
|---|---|---|---|
| Quadrant | BADHDUFLAG | Total packets | Discarded packets |
| A | 0 | 556 | 0 |
| B | 0 | 556 | 0 |
| C | 0 | 556 | 0 |
| D | 0 | 556 | 0 |
| Quadrant | Total seconds | Saturated seconds | Saturation percentage |
|---|---|---|---|
| A | 27362 | 9908 | 36.210803% |
| B | 27364 | 604 | 2.207280% |
| C | 27365 | 246 | 0.898959% |
| D | 27362 | 2952 | 10.788685% |
Noise dominated data is calculated using 1-second bins in cleaned event files. If a bin has >2000 counts, and if more than 50% of those come from <1% of pixels, then it is considered to be noise-dominated and hence unusable.
| Quadrant | # 1 sec bins | Bins with >0 counts | Bins with >2000 counts | High rate bins dominated by noise | Noise dominated (total time) | Noise dominated (detector-on time) | Marked lightcurve |
|---|---|---|---|---|---|---|---|
| A | 29824 | 27368 | 7103 | 7103 | 23.82% | 25.95% | 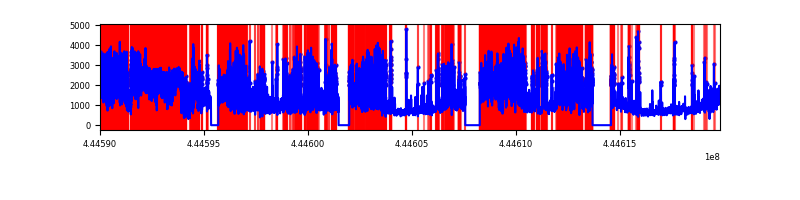 |
| B | 29824 | 27368 | 287 | 287 | 0.96% | 1.05% | 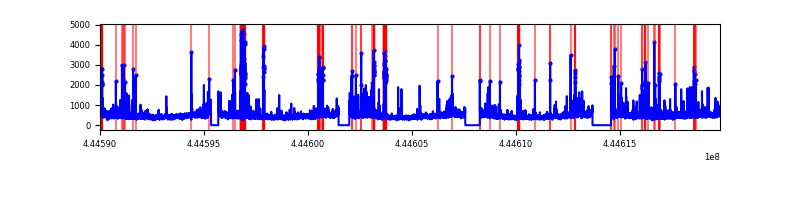 |
| C | 29825 | 27369 | 108 | 108 | 0.36% | 0.39% | 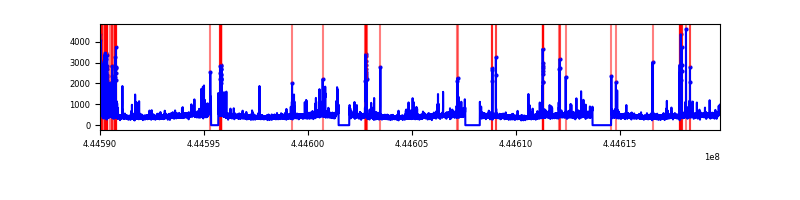 |
| D | 29825 | 27365 | 2419 | 2419 | 8.11% | 8.84% | 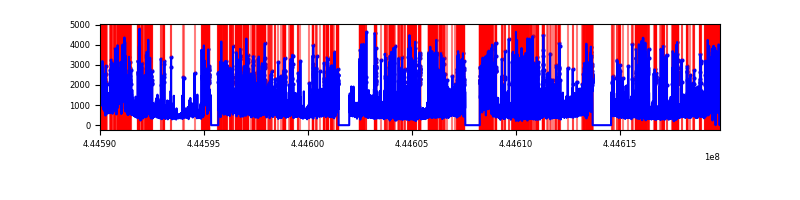 |
Top three noisy pixels from each quadrant. If the there are fewer than three noisy pixels in the level2.evt file, extra rows are filled as -1
| Pixel properties | Quadrant properties | ||||||
|---|---|---|---|---|---|---|---|
| Quadrant | DetID | PixID | Counts | Sigma | Mean | Median | Sigma |
| A | 15 | 223 | 21837511 | 42483.22 | 2490 | 2432 | 514.0 |
| A | 10 | 83 | 8169256 | 15889.71 | 2490 | 2432 | 514.0 |
| A | 15 | 174 | 171456 | 328.86 | 2490 | 2432 | 514.0 |
| B | 4 | 170 | 666630 | 1128.76 | 3017 | 2919 | 588.0 |
| B | 5 | 32 | 359407 | 606.27 | 3017 | 2919 | 588.0 |
| B | 5 | 172 | 308302 | 519.36 | 3017 | 2919 | 588.0 |
| C | 14 | 254 | 327844 | 466.52 | 2984 | 3005 | 696.3 |
| C | 12 | 2 | 205597 | 290.96 | 2984 | 3005 | 696.3 |
| C | 15 | 208 | 201843 | 285.56 | 2984 | 3005 | 696.3 |
| D | 13 | 249 | 4209462 | 5855.78 | 2851 | 2767 | 718.4 |
| D | 11 | 241 | 3601789 | 5009.89 | 2851 | 2767 | 718.4 |
| D | 5 | 235 | 1866879 | 2594.87 | 2851 | 2767 | 718.4 |
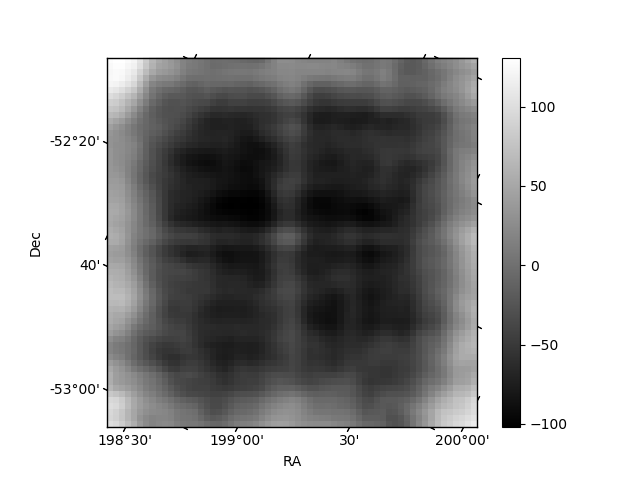
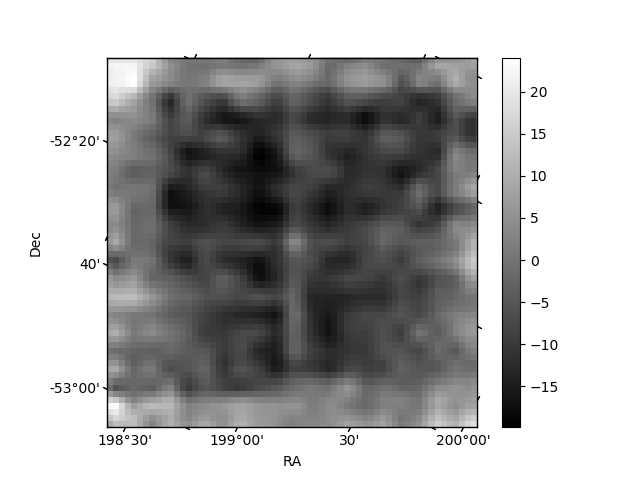
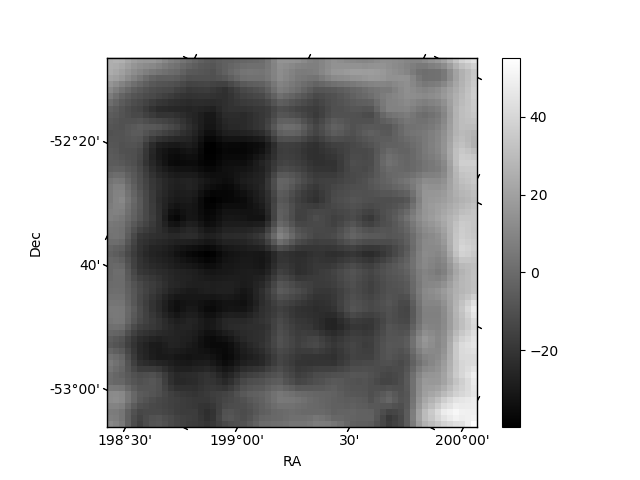
Histogram calculated using DETX and DETY for each event in the final _common_clean file
| Quadrant A | 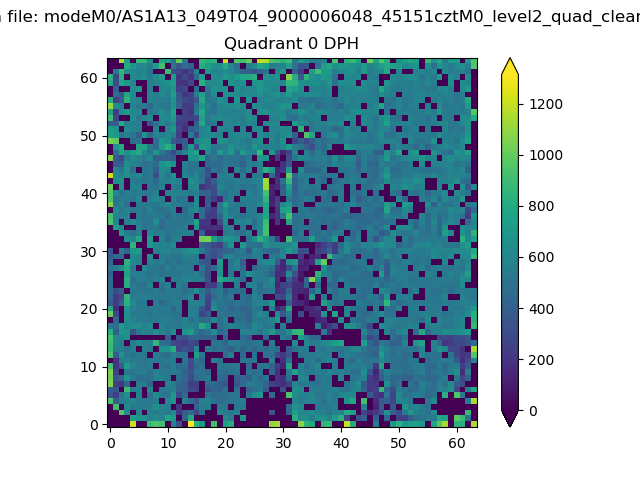 |
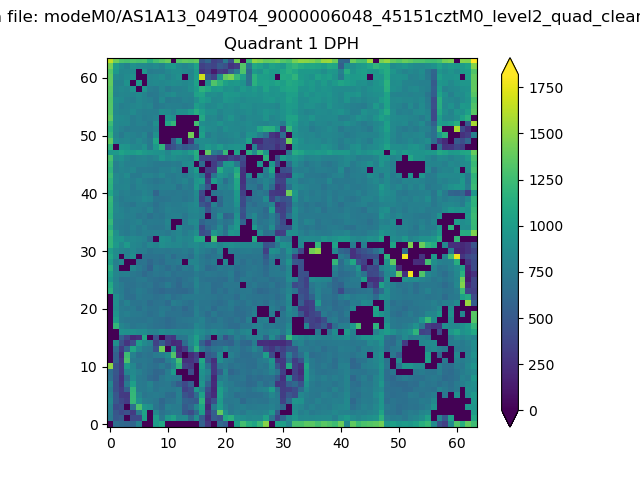 |
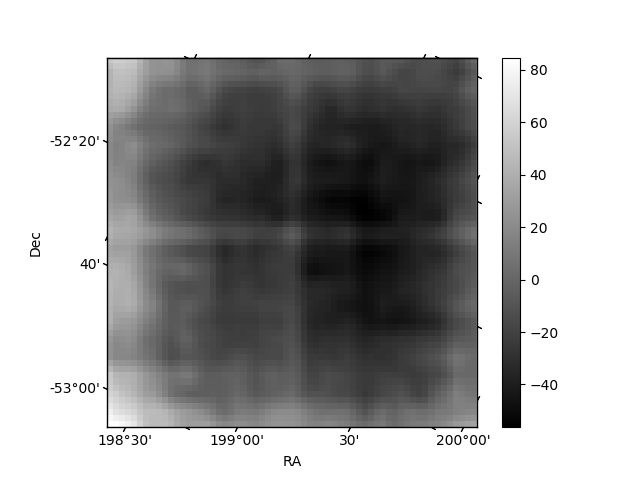
Quadrant B |
|---|---|---|---|
| Quadrant D | 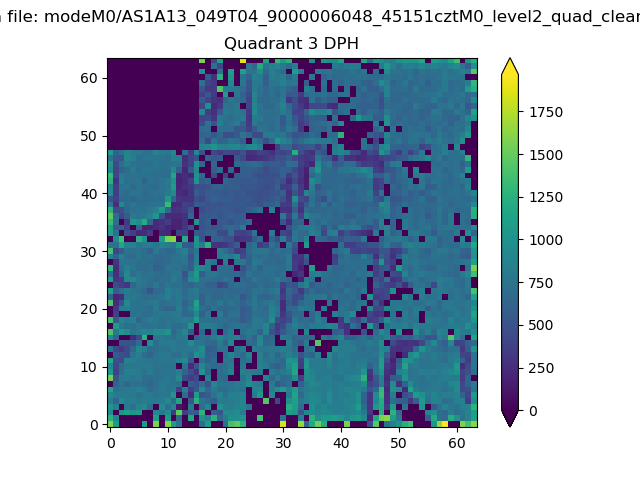 |
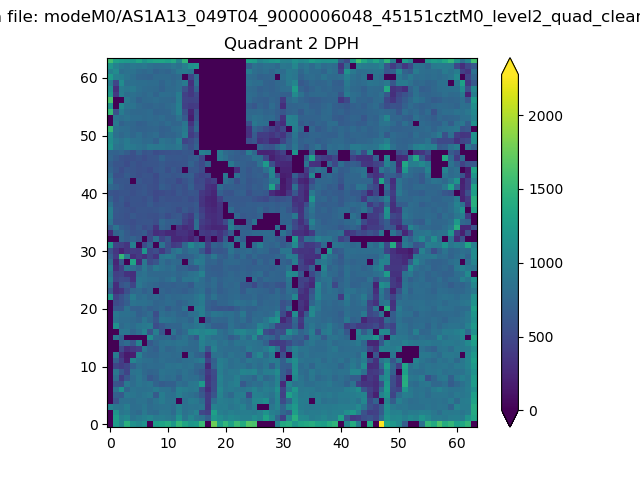 |
Quadrant C |
| Plot type | Count rate plots | Images |
|---|---|---|
| Comparison with Poisson distribution Blue bars denote a histogram of data divided into 1 sec bins. Red curve is a Poisson curve with rate = median count rate of data. |
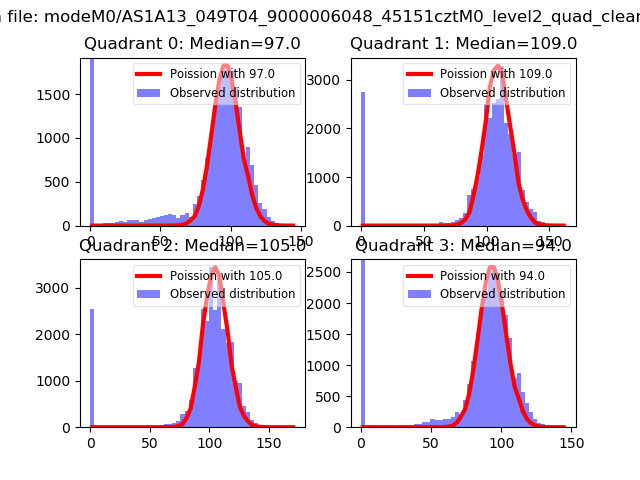 |
 |
| Quadrant-wise count rates Data is divided into 100 sec bins |
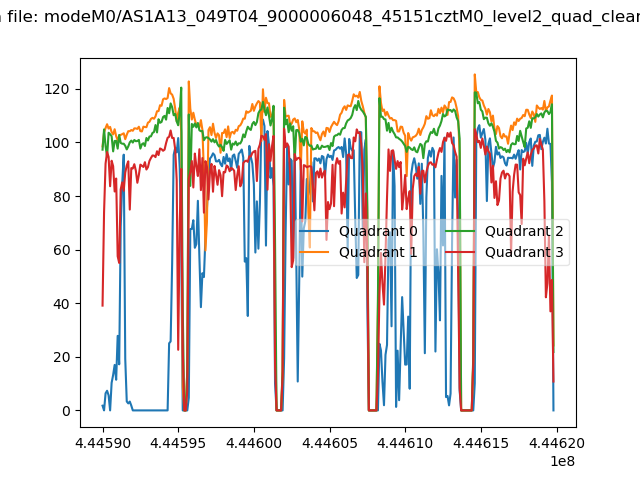 |
|
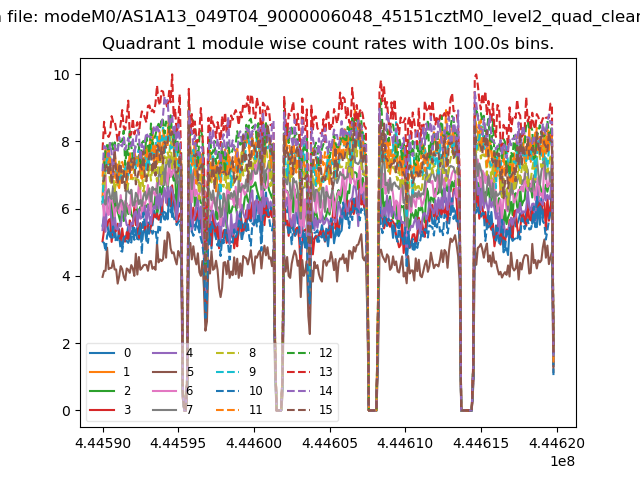
| Module-wise count rates for Quadrant A Data is divided into 100 sec bins |
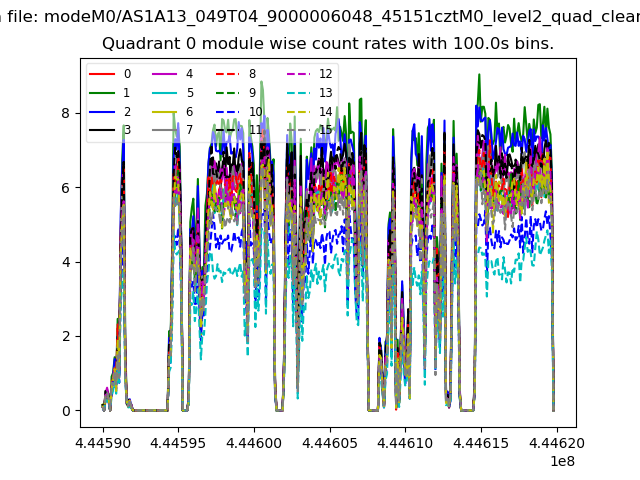 |
 |
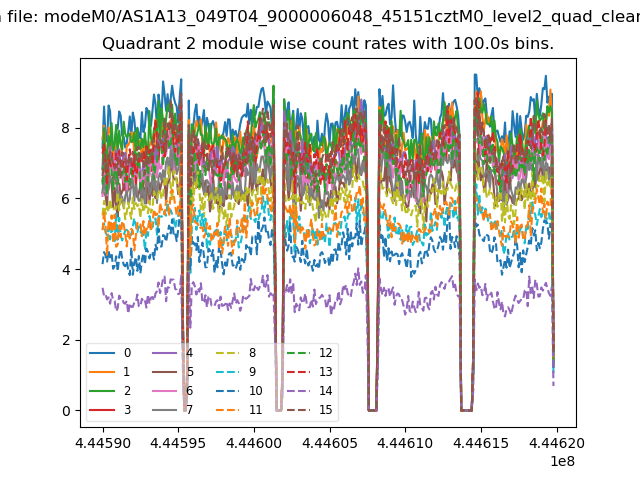
| Module-wise count rates for Quadrant B Data is divided into 100 sec bins |
 |
 |
| Module-wise count rates for Quadrant C Data is divided into 100 sec bins |
 |
 |
| Module-wise count rates for Quadrant D Data is divided into 100 sec bins |
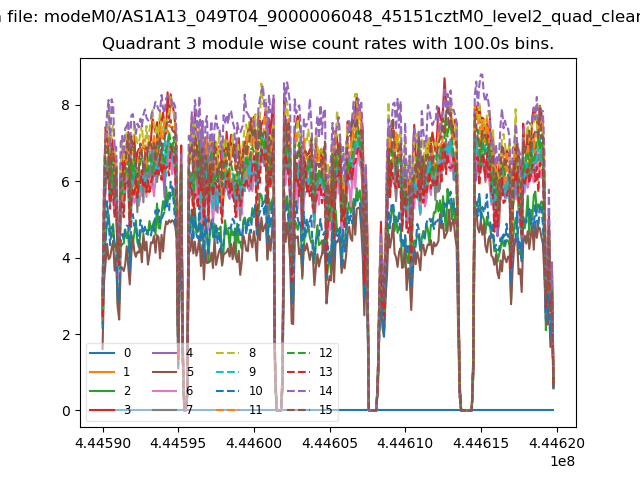 |
 |
| Parameter | Plot |
|---|---|
| CZT HV Monitor | 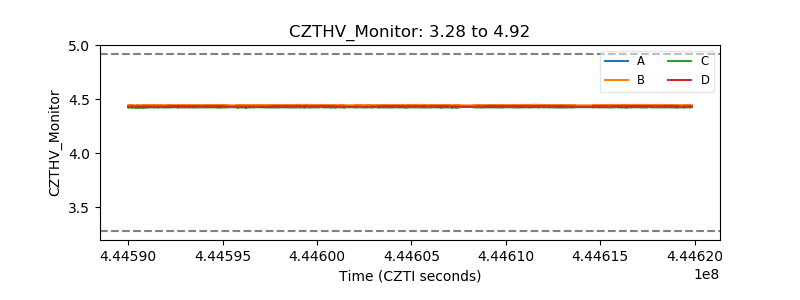 |
| D_VDD | 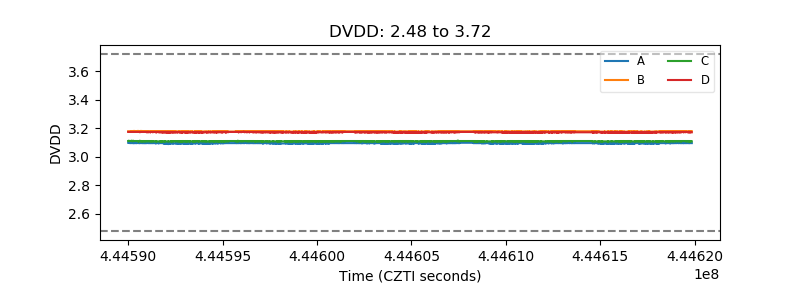 |
| Temperature 1 | 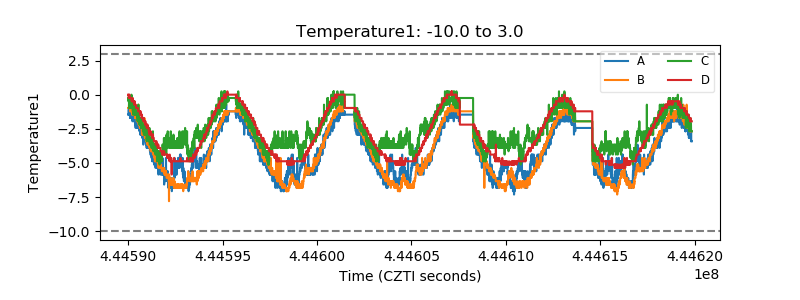 |
| Veto HV Monitor | 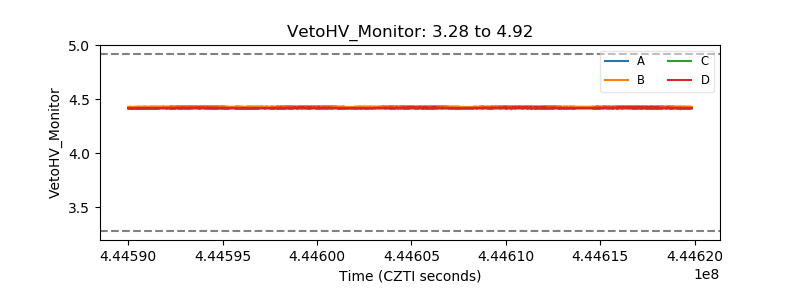 |
| Veto LLD | 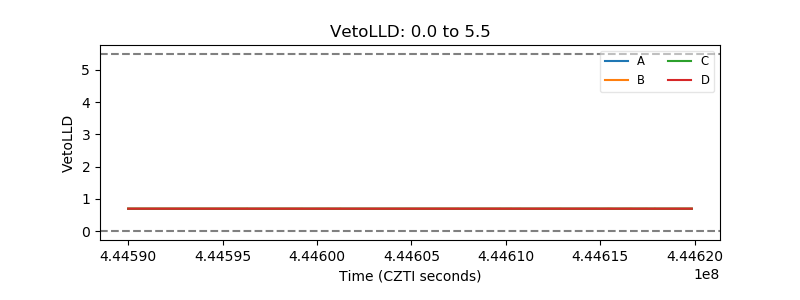 |
| Alpha Counter | 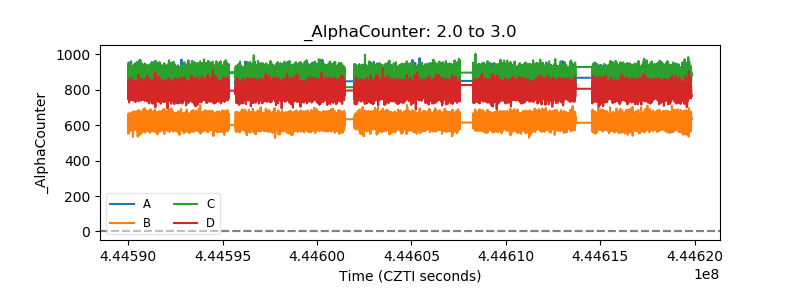 |
| _CPM_Rate | 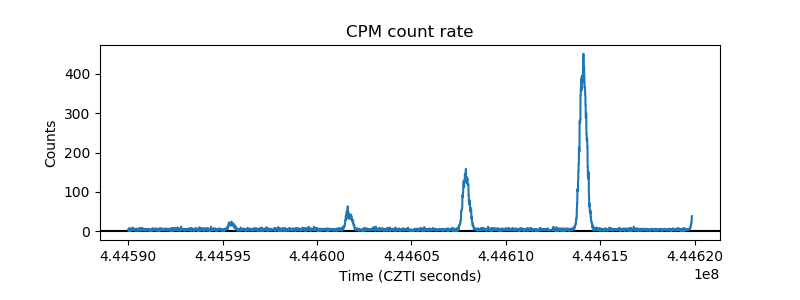 |
| CZT Counter | 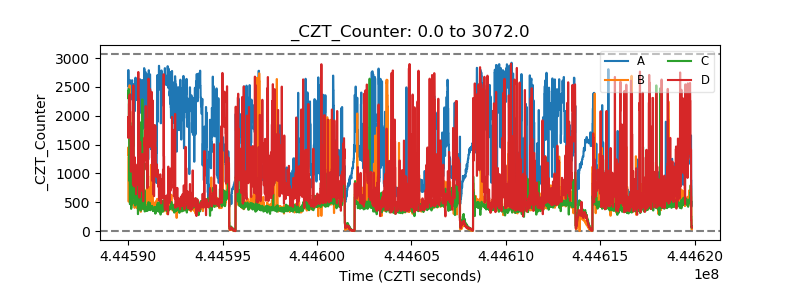 |
| +2.5 Volts monitor | 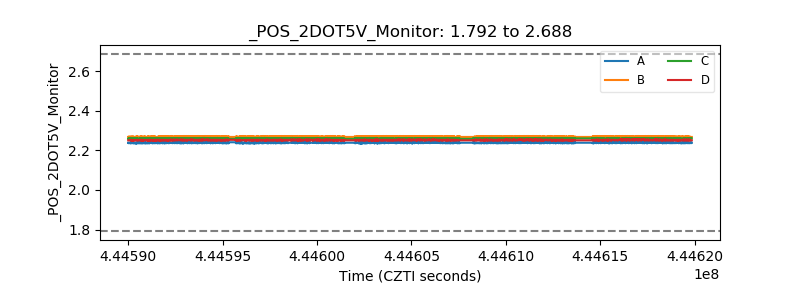 |
| +5 Volts monitor | 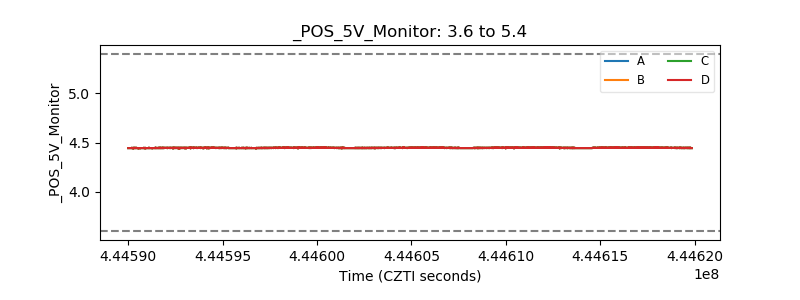 |
| _ROLL_ROT | 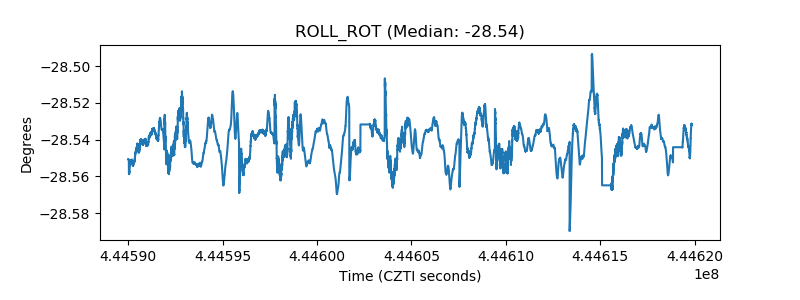 |
| _Roll_DEC | 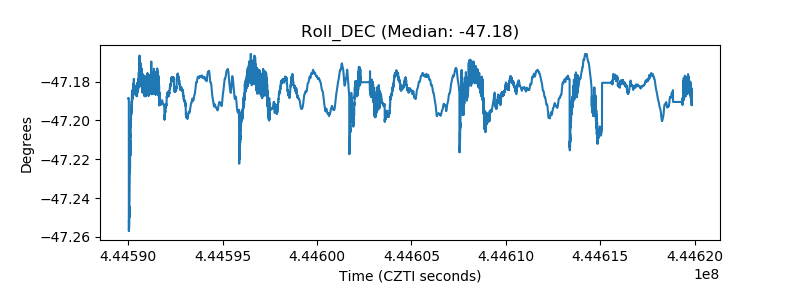 |
| _Roll_RA | 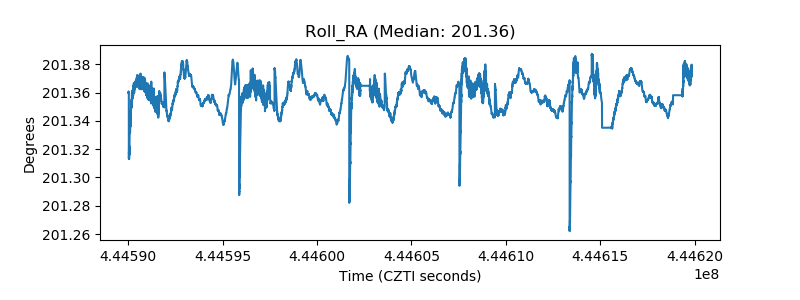 |
| Veto Counter | 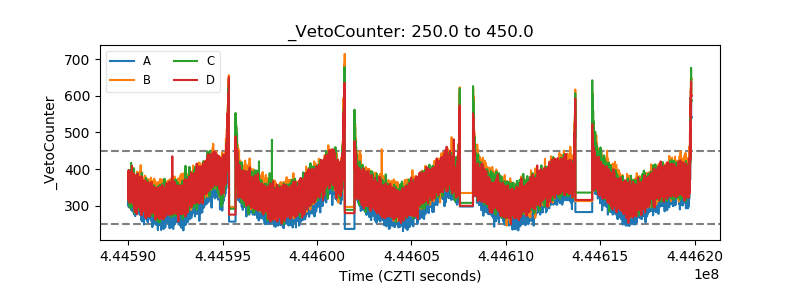 |