| Param | Original file | Final file |
|---|---|---|
| Filename | modeM0/AS1A13_049T04_9000006048_45153cztM0_level2.fits | modeM0/AS1A13_049T04_9000006048_45153cztM0_level2_quad_clean.evt |
| Size (bytes) | 749,226,240 | 102,565,440 |
| Size | 714.5 MB | 97.8 MB |
| Events in quadrant A | 14,082,797 | 326,584 |
| Events in quadrant B | 3,963,507 | 825,245 |
| Events in quadrant C | 3,233,465 | 798,851 |
| Events in quadrant D | 5,907,764 | 664,821 |
| Mode M9 | |||
|---|---|---|---|
| Quadrant | BADHDUFLAG | Total packets | Discarded packets |
| A | 0 | 22 | 0 |
| B | 0 | 22 | 0 |
| C | 0 | 22 | 0 |
| D | 0 | 22 | 0 |
| Mode M0 | |||
|---|---|---|---|
| Quadrant | BADHDUFLAG | Total packets | Discarded packets |
| A | 0 | 46636 | 2 |
| B | 0 | 16411 | 2 |
| C | 0 | 14408 | 2 |
| D | 0 | 22322 | 2 |
| Mode SS | |||
|---|---|---|---|
| Quadrant | BADHDUFLAG | Total packets | Discarded packets |
| A | 0 | 142 | 0 |
| B | 0 | 144 | 0 |
| C | 0 | 144 | 0 |
| D | 0 | 144 | 0 |
| Quadrant | Total seconds | Saturated seconds | Saturation percentage |
|---|---|---|---|
| A | 7040 | 4339 | 61.633523% |
| B | 7040 | 131 | 1.860795% |
| C | 7041 | 21 | 0.298253% |
| D | 7041 | 710 | 10.083795% |
Noise dominated data is calculated using 1-second bins in cleaned event files. If a bin has >2000 counts, and if more than 50% of those come from <1% of pixels, then it is considered to be noise-dominated and hence unusable.
| Quadrant | # 1 sec bins | Bins with >0 counts | Bins with >2000 counts | High rate bins dominated by noise | Noise dominated (total time) | Noise dominated (detector-on time) | Marked lightcurve |
|---|---|---|---|---|---|---|---|
| A | 9179 | 7040 | 4024 | 4024 | 43.84% | 57.16% | 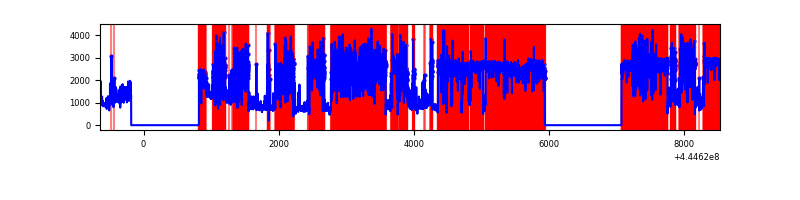 |
| B | 9180 | 7042 | 79 | 79 | 0.86% | 1.12% | 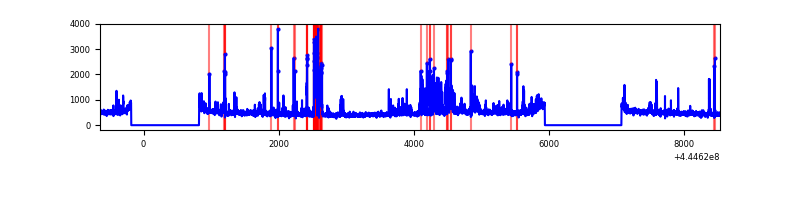 |
| C | 9181 | 7043 | 0 | 0 | 0.00% | 0.00% | 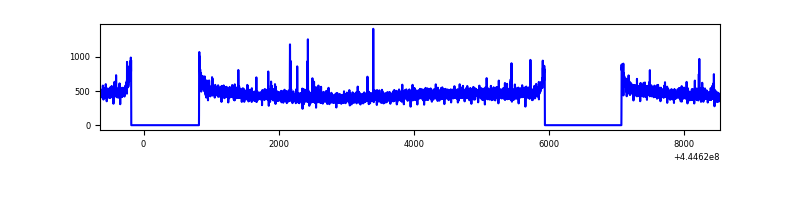 |
| D | 9181 | 7043 | 566 | 566 | 6.16% | 8.04% | 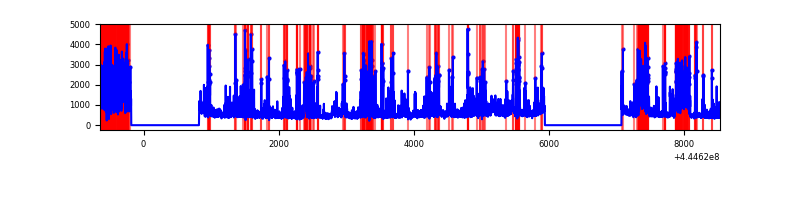 |
Top three noisy pixels from each quadrant. If the there are fewer than three noisy pixels in the level2.evt file, extra rows are filled as -1
| Pixel properties | Quadrant properties | ||||||
|---|---|---|---|---|---|---|---|
| Quadrant | DetID | PixID | Counts | Sigma | Mean | Median | Sigma |
| A | 15 | 223 | 10235191 | 99121.22 | 496 | 485 | 103.3 |
| A | 10 | 83 | 1687790 | 16341.23 | 496 | 485 | 103.3 |
| A | 12 | 227 | 123802 | 1194.3 | 496 | 485 | 103.3 |
| B | 4 | 170 | 475423 | 3001.48 | 816 | 791 | 158.1 |
| B | 5 | 185 | 113598 | 713.37 | 816 | 791 | 158.1 |
| B | 5 | 172 | 57348 | 357.66 | 816 | 791 | 158.1 |
| C | 3 | 233 | 21393 | 107.36 | 816 | 821 | 191.6 |
| C | 12 | 2 | 12977 | 63.44 | 816 | 821 | 191.6 |
| C | 1 | 3 | 6223 | 28.19 | 816 | 821 | 191.6 |
| D | 13 | 249 | 1042865 | 5339.43 | 769 | 745 | 195.2 |
| D | 5 | 235 | 523234 | 2677.04 | 769 | 745 | 195.2 |
| D | 2 | 249 | 375876 | 1922.03 | 769 | 745 | 195.2 |
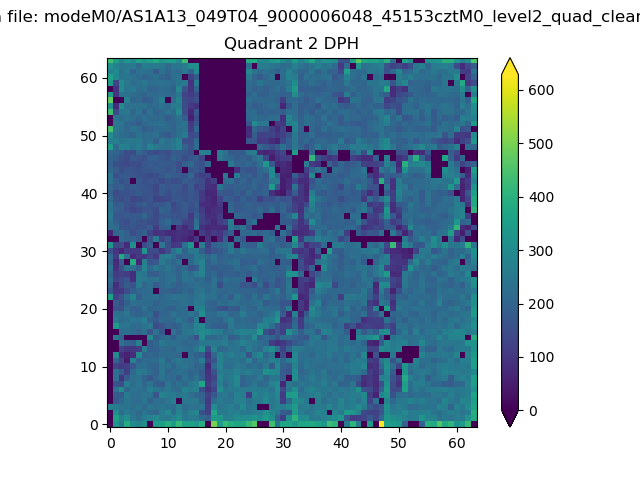
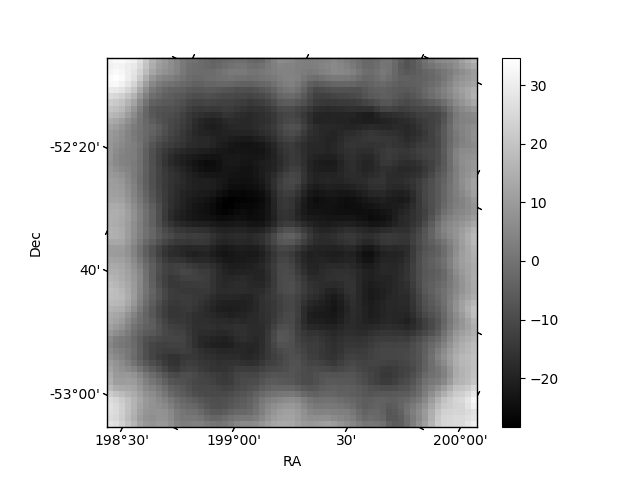
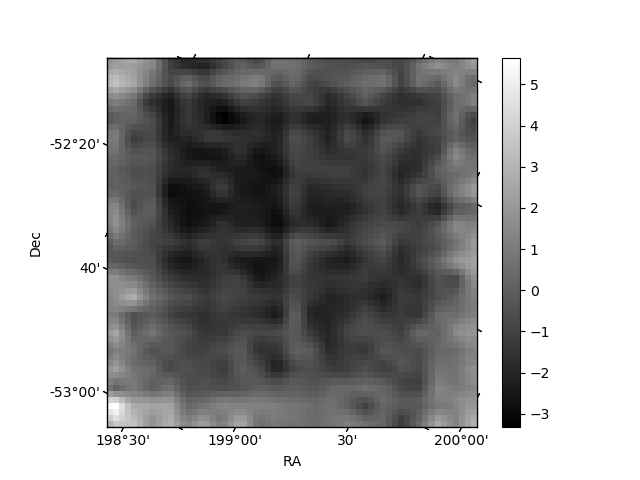
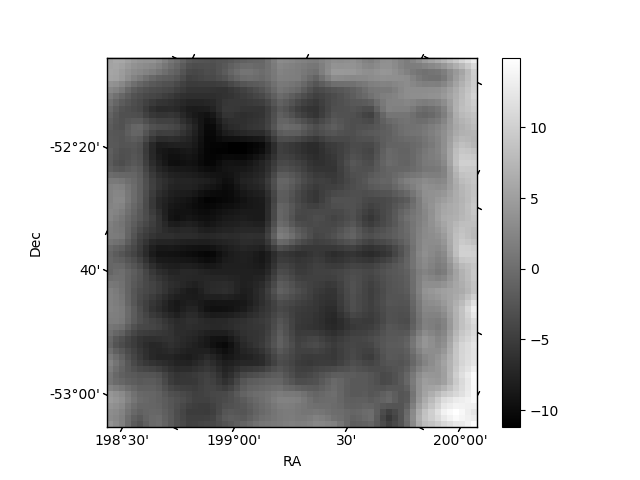
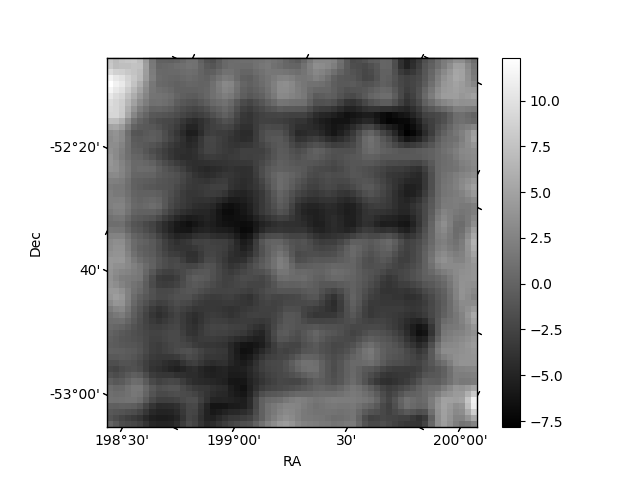
Histogram calculated using DETX and DETY for each event in the final _common_clean file
| Quadrant A | 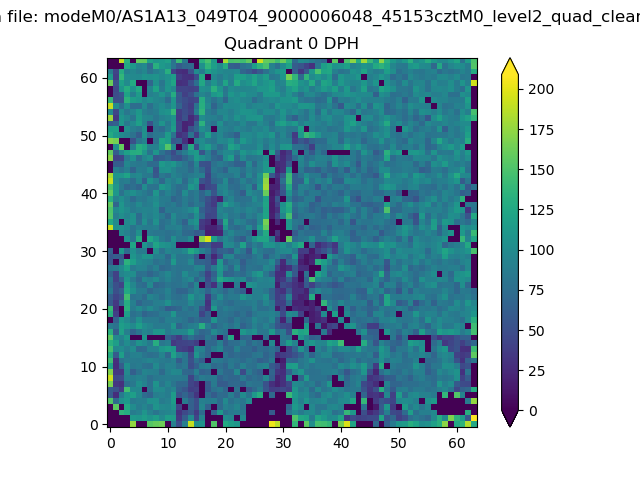 |
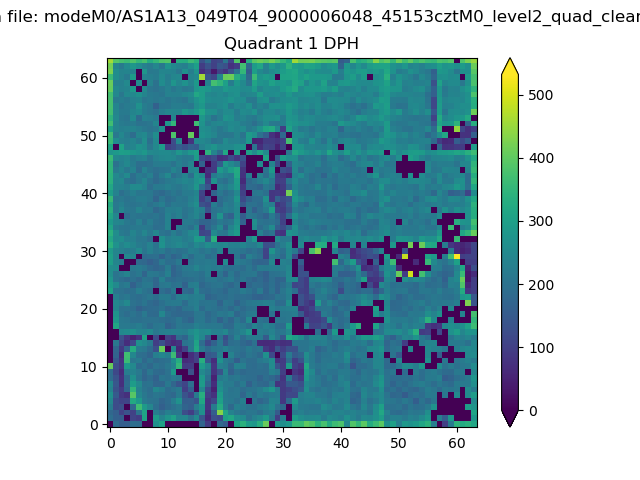 |
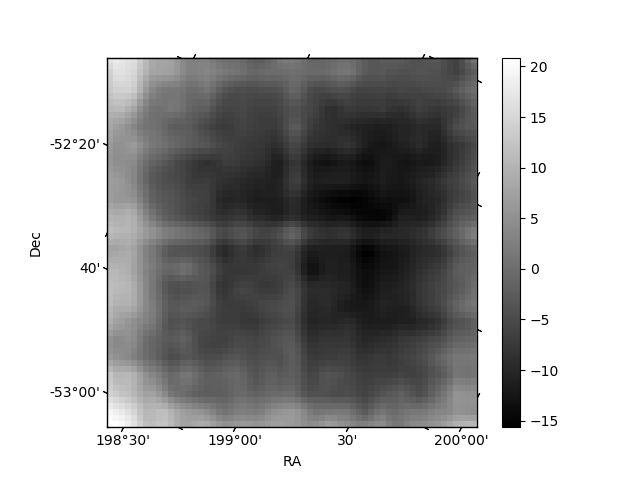
Quadrant B |
|---|---|---|---|
| Quadrant D | 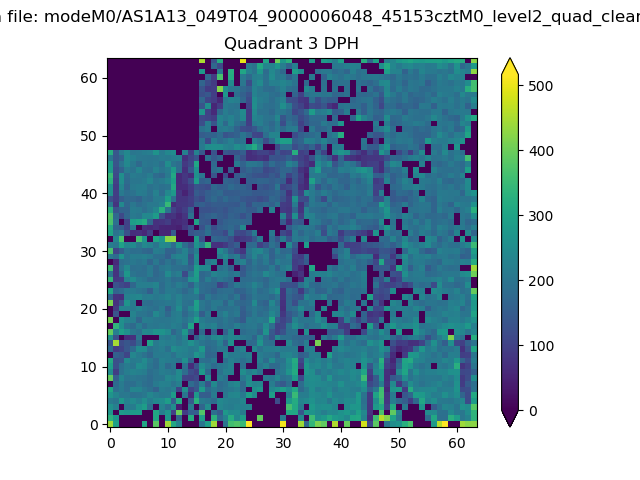 |
 |
Quadrant C |
| Plot type | Count rate plots | Images |
|---|---|---|
| Comparison with Poisson distribution Blue bars denote a histogram of data divided into 1 sec bins. Red curve is a Poisson curve with rate = median count rate of data. |
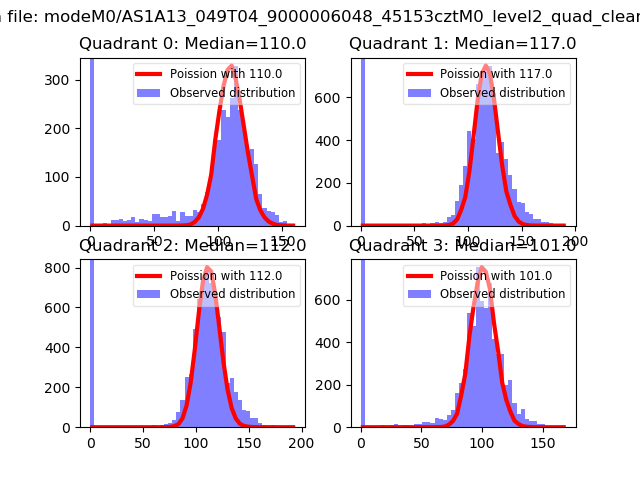 |
 |
| Quadrant-wise count rates Data is divided into 100 sec bins |
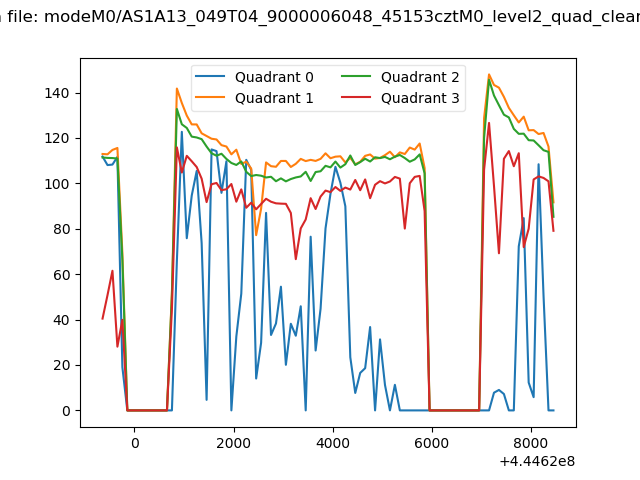 |
|
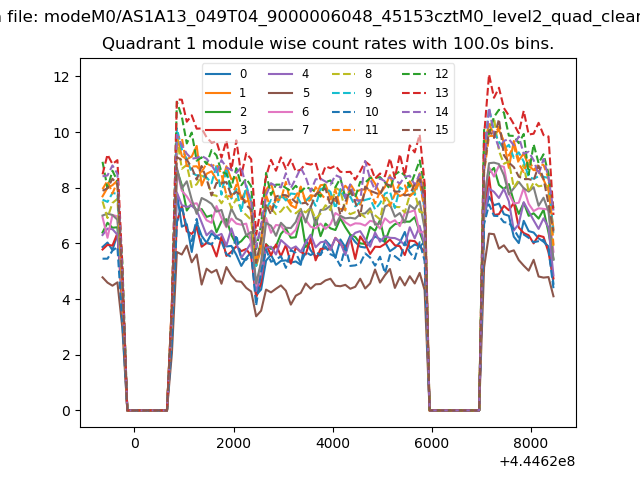
| Module-wise count rates for Quadrant A Data is divided into 100 sec bins |
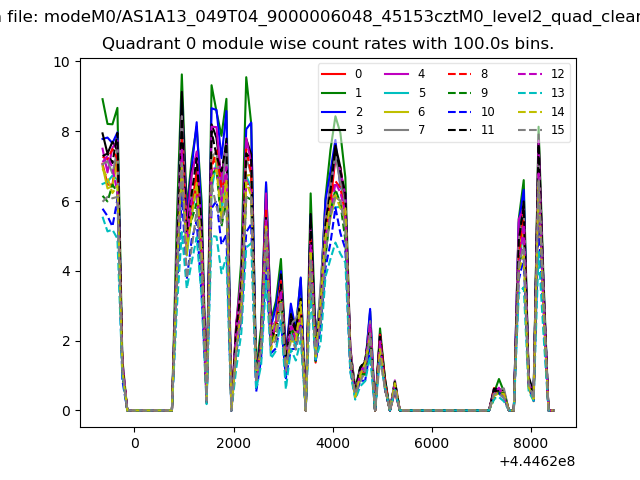 |
 |
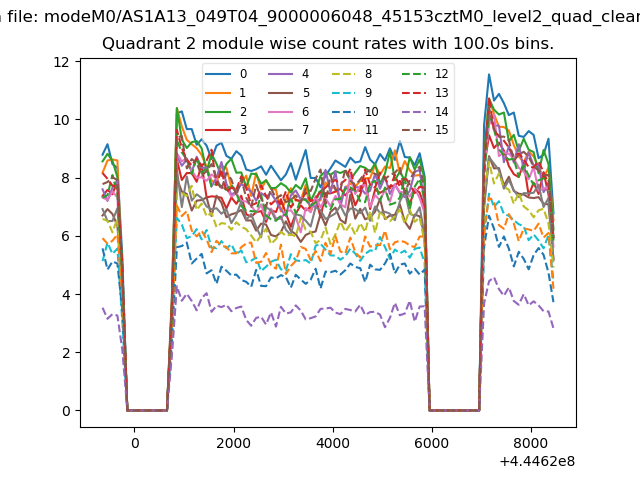
| Module-wise count rates for Quadrant B Data is divided into 100 sec bins |
 |
 |
| Module-wise count rates for Quadrant C Data is divided into 100 sec bins |
 |
 |
| Module-wise count rates for Quadrant D Data is divided into 100 sec bins |
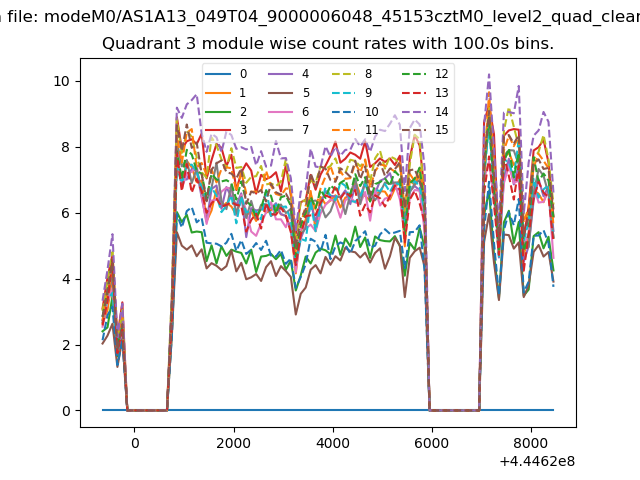 |
 |
| Parameter | Plot |
|---|---|
| CZT HV Monitor | 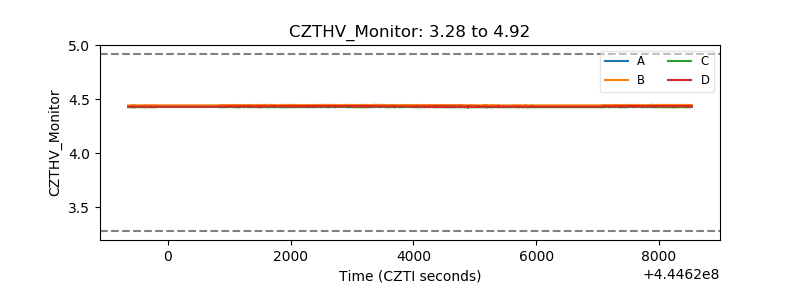 |
| D_VDD | 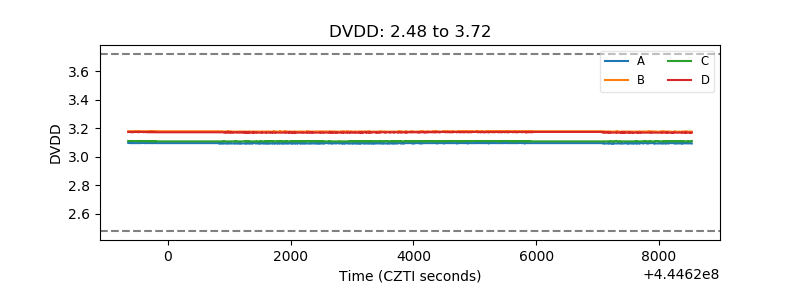 |
| Temperature 1 | 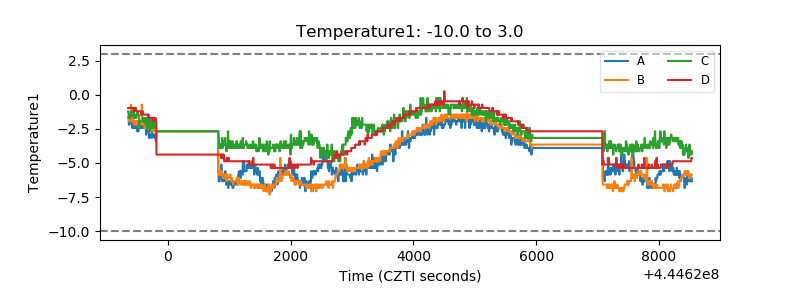 |
| Veto HV Monitor | 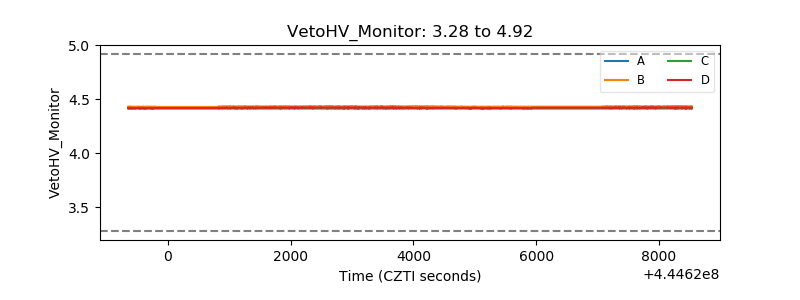 |
| Veto LLD | 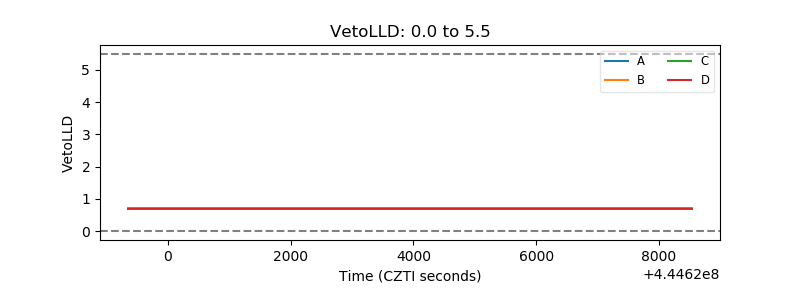 |
| Alpha Counter | 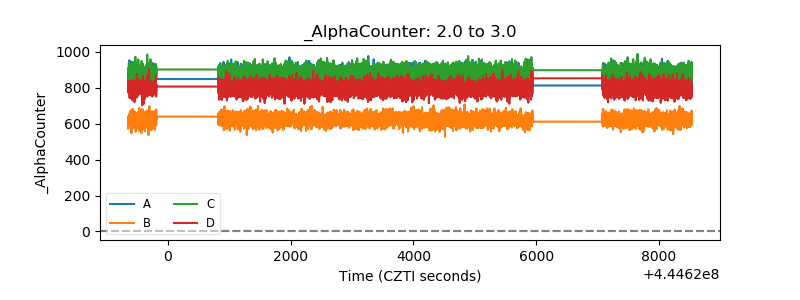 |
| _CPM_Rate | 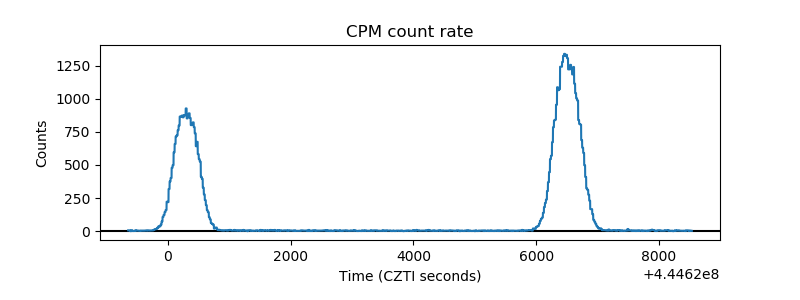 |
| CZT Counter | 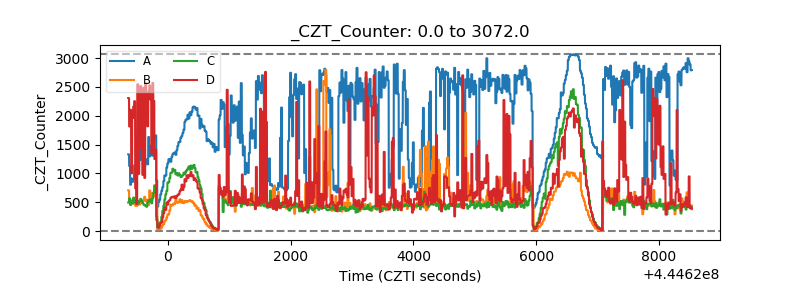 |
| +2.5 Volts monitor | 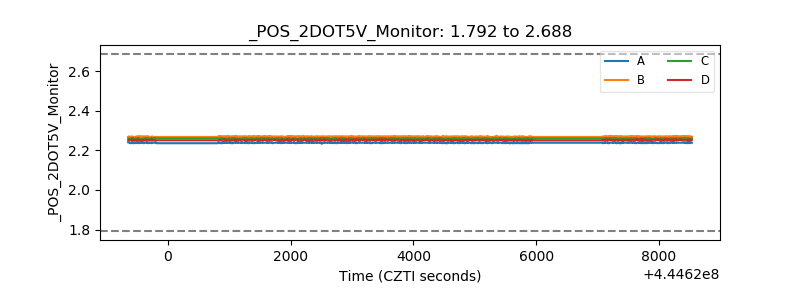 |
| +5 Volts monitor | 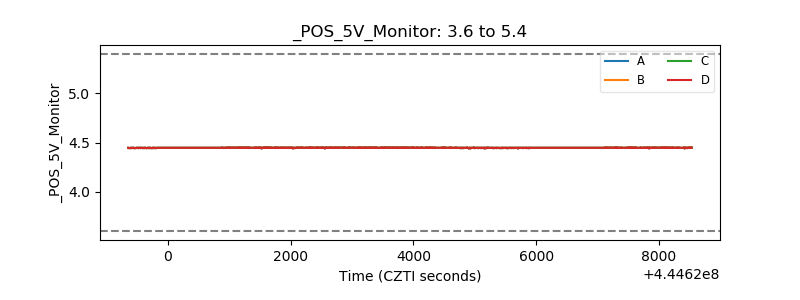 |
| _ROLL_ROT | 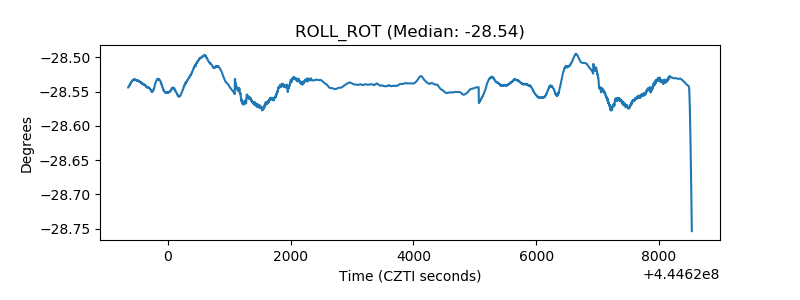 |
| _Roll_DEC | 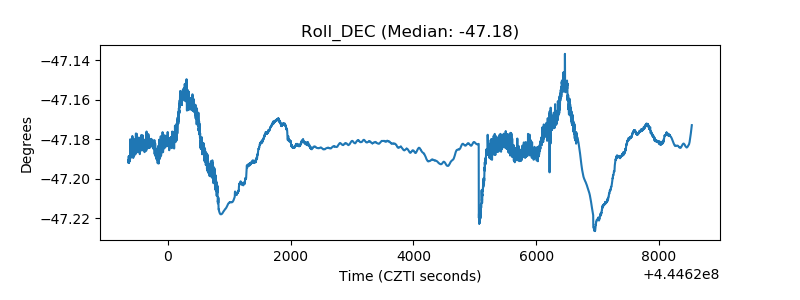 |
| _Roll_RA | 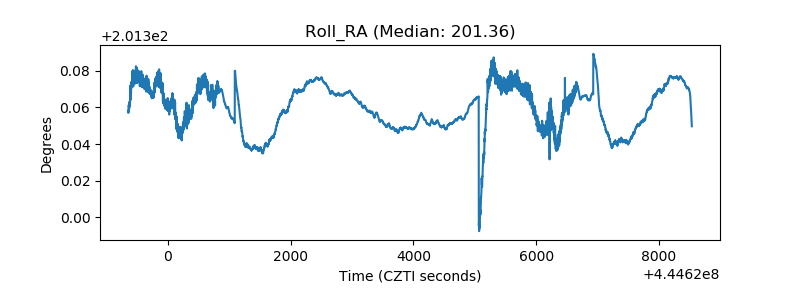 |
| Veto Counter | 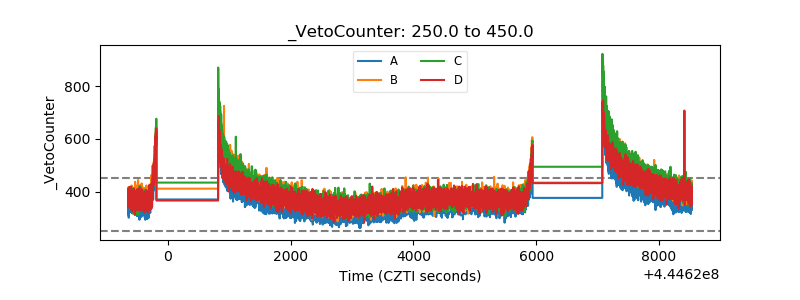 |