| Param | Original file | Final file |
|---|---|---|
| Filename | modeM0/AS1A13_049T04_9000006048_45154cztM0_level2.fits | modeM0/AS1A13_049T04_9000006048_45154cztM0_level2_quad_clean.evt |
| Size (bytes) | 663,670,080 | 79,306,560 |
| Size | 632.9 MB | 75.6 MB |
| Events in quadrant A | 14,127,854 | 86,206 |
| Events in quadrant B | 2,938,334 | 685,110 |
| Events in quadrant C | 2,858,138 | 656,227 |
| Events in quadrant D | 4,200,553 | 576,756 |
| Mode M9 | |||
|---|---|---|---|
| Quadrant | BADHDUFLAG | Total packets | Discarded packets |
| A | 0 | 13 | 0 |
| B | 0 | 13 | 0 |
| C | 0 | 13 | 0 |
| D | 0 | 13 | 0 |
| Mode M0 | |||
|---|---|---|---|
| Quadrant | BADHDUFLAG | Total packets | Discarded packets |
| A | 0 | 45729 | 1 |
| B | 0 | 12424 | 1 |
| C | 0 | 12283 | 1 |
| D | 0 | 16346 | 1 |
| Mode SS | |||
|---|---|---|---|
| Quadrant | BADHDUFLAG | Total packets | Discarded packets |
| A | 0 | 116 | 0 |
| B | 0 | 116 | 0 |
| C | 0 | 116 | 0 |
| D | 0 | 116 | 0 |
| Quadrant | Total seconds | Saturated seconds | Saturation percentage |
|---|---|---|---|
| A | 5683 | 5001 | 87.999296% |
| B | 5684 | 80 | 1.407460% |
| C | 5683 | 103 | 1.812423% |
| D | 5683 | 340 | 5.982756% |
Noise dominated data is calculated using 1-second bins in cleaned event files. If a bin has >2000 counts, and if more than 50% of those come from <1% of pixels, then it is considered to be noise-dominated and hence unusable.
| Quadrant | # 1 sec bins | Bins with >0 counts | Bins with >2000 counts | High rate bins dominated by noise | Noise dominated (total time) | Noise dominated (detector-on time) | Marked lightcurve |
|---|---|---|---|---|---|---|---|
| A | 6837 | 5682 | 4799 | 4799 | 70.19% | 84.46% | 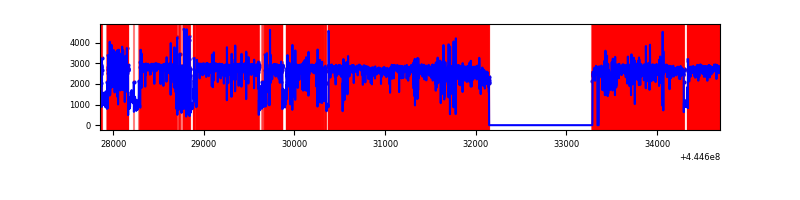 |
| B | 6839 | 5685 | 14 | 14 | 0.20% | 0.25% | 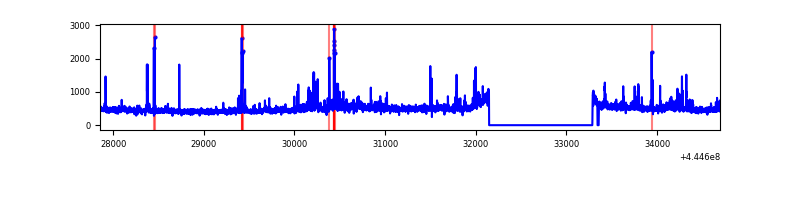 |
| C | 6838 | 5685 | 46 | 46 | 0.67% | 0.81% | 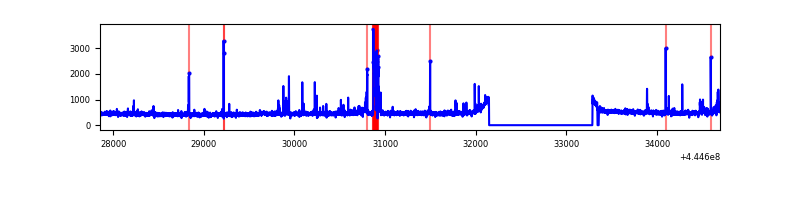 |
| D | 6838 | 5685 | 248 | 248 | 3.63% | 4.36% | 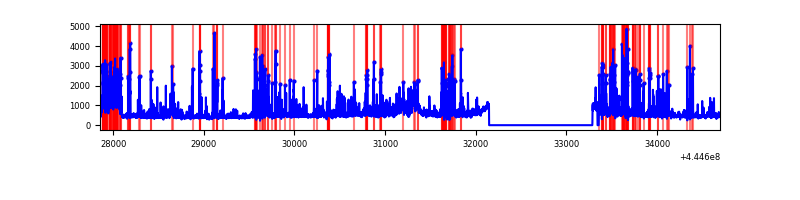 |
Top three noisy pixels from each quadrant. If the there are fewer than three noisy pixels in the level2.evt file, extra rows are filled as -1
| Pixel properties | Quadrant properties | ||||||
|---|---|---|---|---|---|---|---|
| Quadrant | DetID | PixID | Counts | Sigma | Mean | Median | Sigma |
| A | 15 | 223 | 12292966 | 233492.08 | 248 | 243 | 52.6 |
| A | 10 | 83 | 854990 | 16235.35 | 248 | 243 | 52.6 |
| A | 7 | 3 | 7566 | 139.1 | 248 | 243 | 52.6 |
| B | 5 | 172 | 90162 | 690.96 | 665 | 643 | 129.6 |
| B | 4 | 170 | 57905 | 441.98 | 665 | 643 | 129.6 |
| B | 12 | 16 | 56194 | 428.77 | 665 | 643 | 129.6 |
| C | 0 | 207 | 134132 | 857.13 | 666 | 674 | 155.7 |
| C | 1 | 3 | 49959 | 316.53 | 666 | 674 | 155.7 |
| C | 12 | 2 | 46071 | 291.56 | 666 | 674 | 155.7 |
| D | 13 | 249 | 620898 | 3811.27 | 651 | 631 | 162.7 |
| D | 2 | 249 | 340166 | 2086.3 | 651 | 631 | 162.7 |
| D | 11 | 241 | 138078 | 844.55 | 651 | 631 | 162.7 |
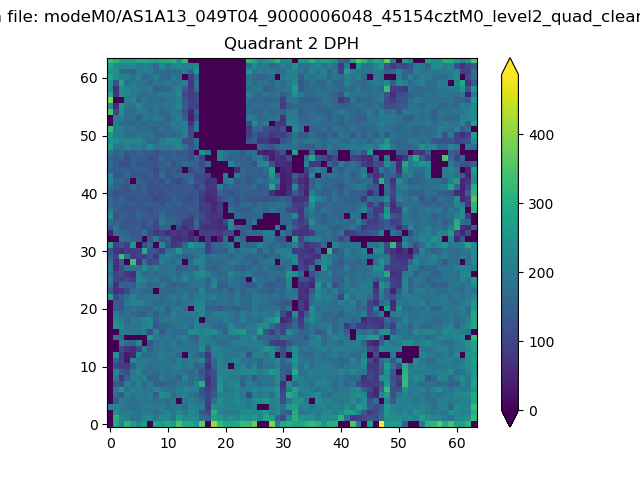
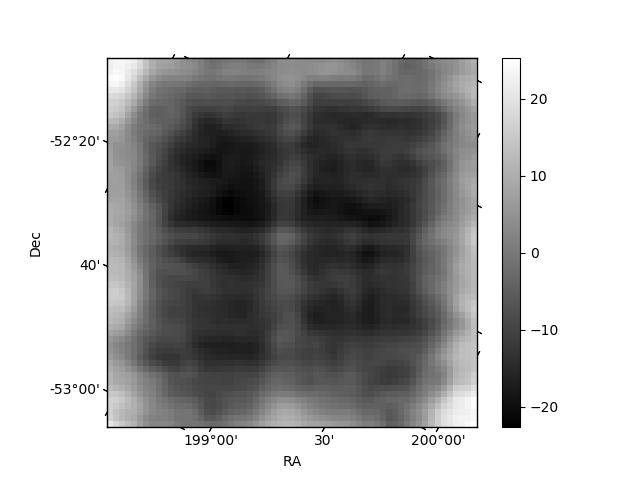
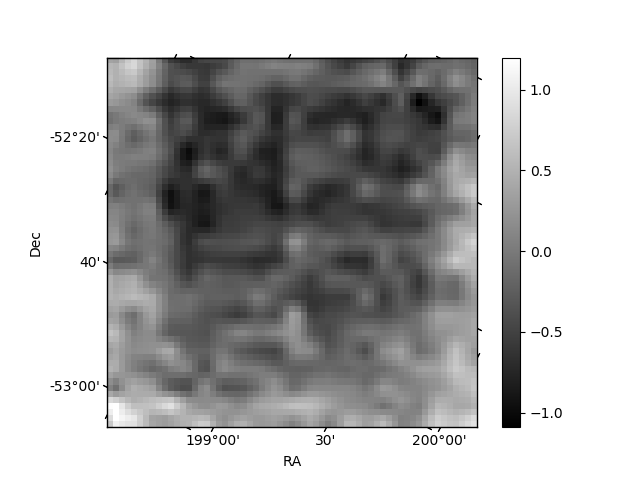
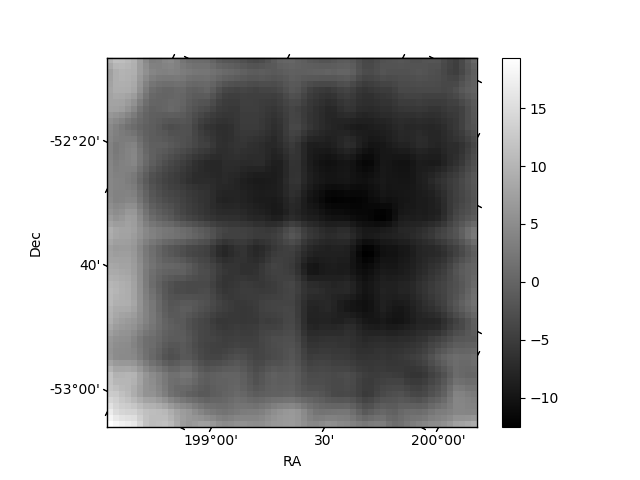
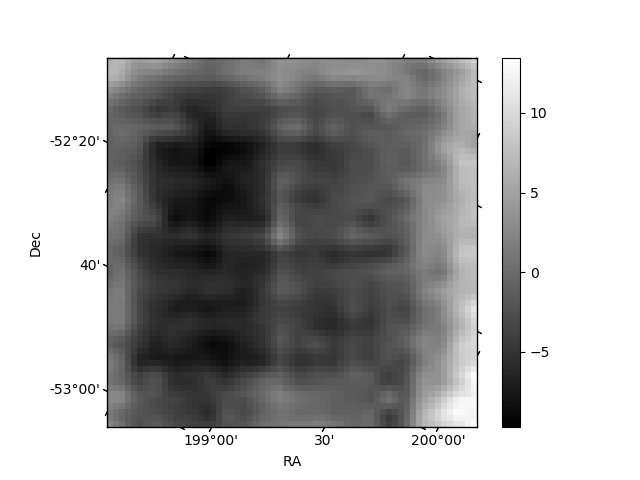
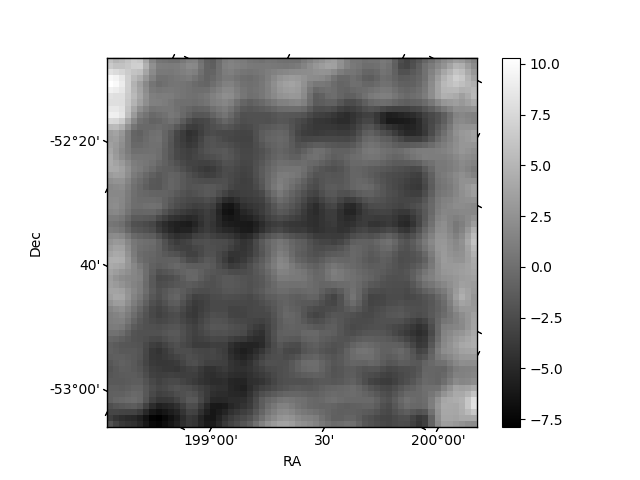
Histogram calculated using DETX and DETY for each event in the final _common_clean file
| Quadrant A | 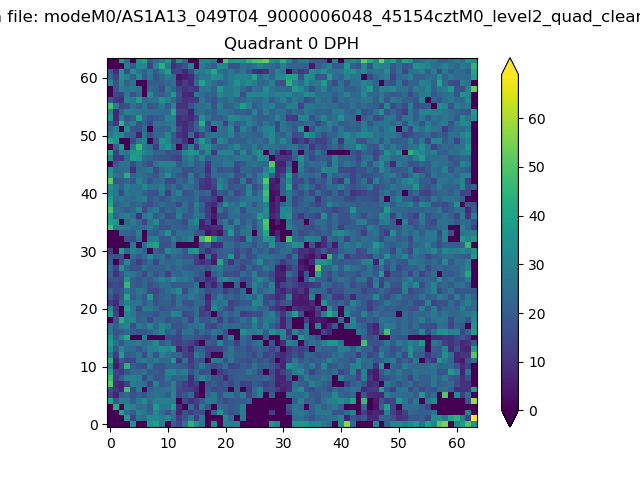 |
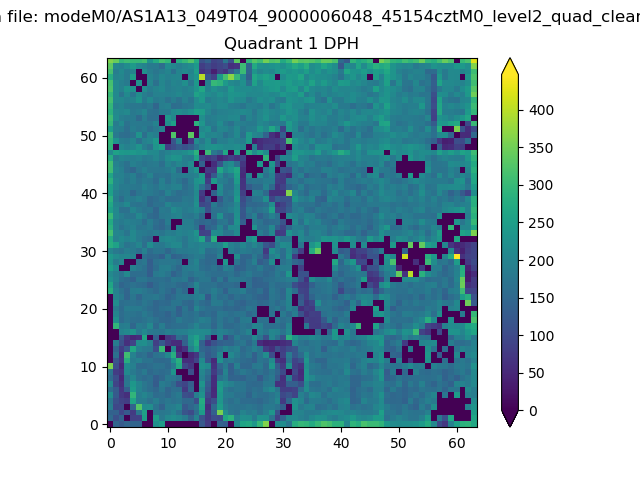 |
Quadrant B |
|---|---|---|---|
| Quadrant D | 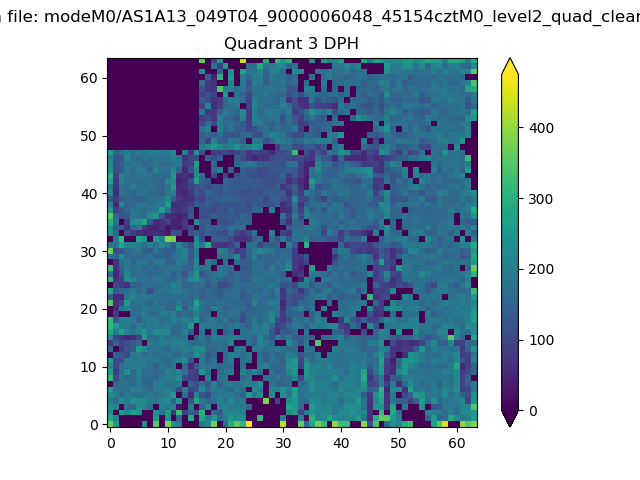 |
 |
Quadrant C |
| Plot type | Count rate plots | Images |
|---|---|---|
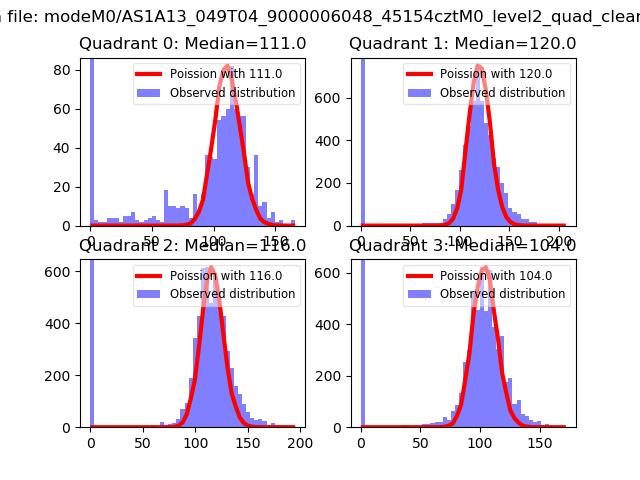
| Comparison with Poisson distribution Blue bars denote a histogram of data divided into 1 sec bins. Red curve is a Poisson curve with rate = median count rate of data. |
 |
 |
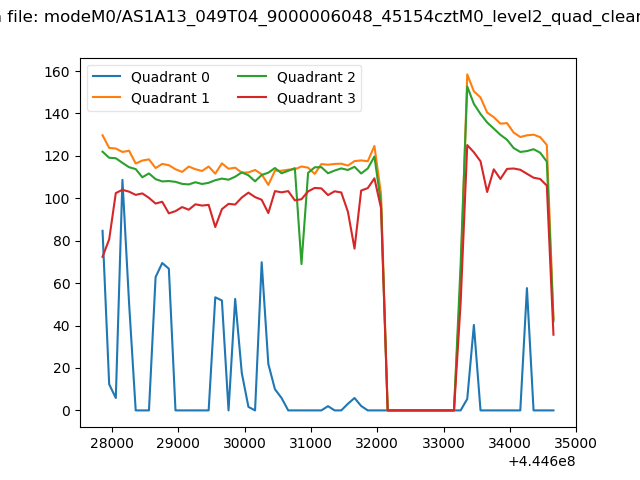
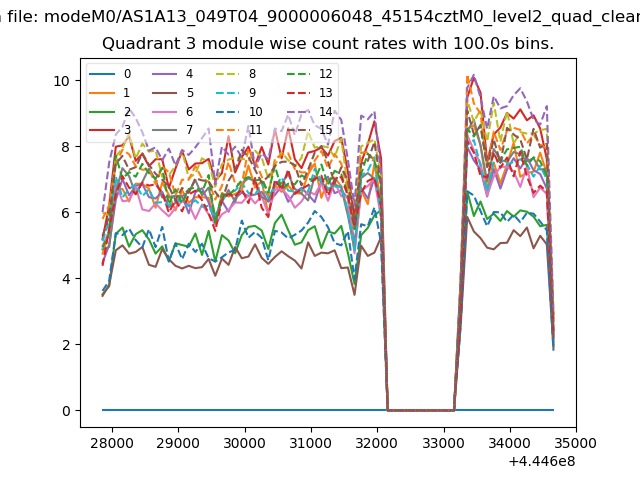
| Quadrant-wise count rates Data is divided into 100 sec bins |
 |
|
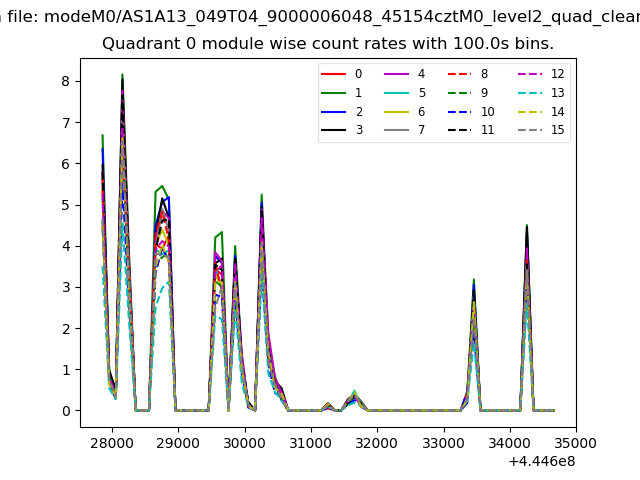
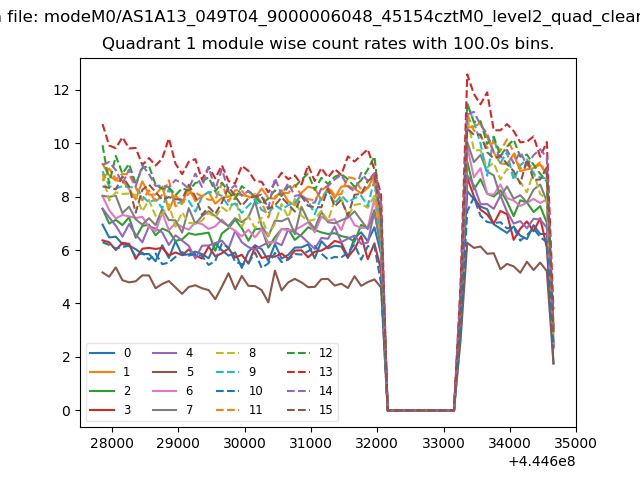
| Module-wise count rates for Quadrant A Data is divided into 100 sec bins |
 |
 |
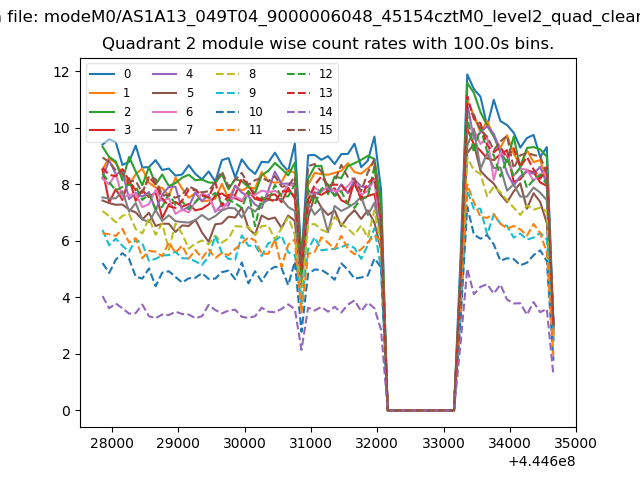
| Module-wise count rates for Quadrant B Data is divided into 100 sec bins |
 |
 |
| Module-wise count rates for Quadrant C Data is divided into 100 sec bins |
 |
 |
| Module-wise count rates for Quadrant D Data is divided into 100 sec bins |
 |
 |
| Parameter | Plot |
|---|---|
| CZT HV Monitor | 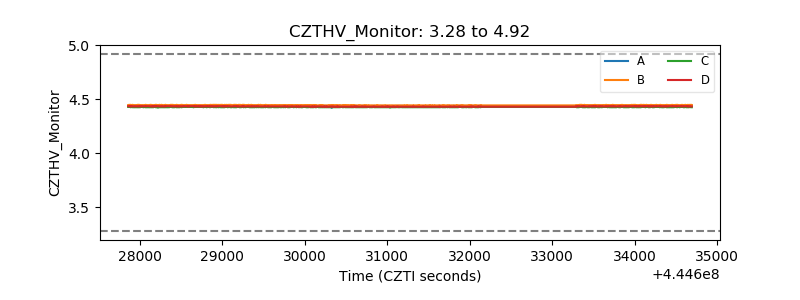 |
| D_VDD | 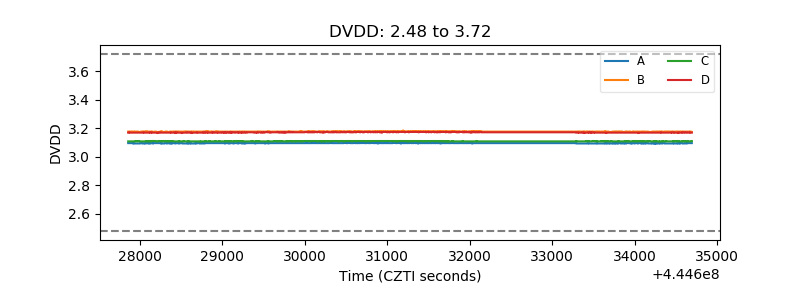 |
| Temperature 1 | 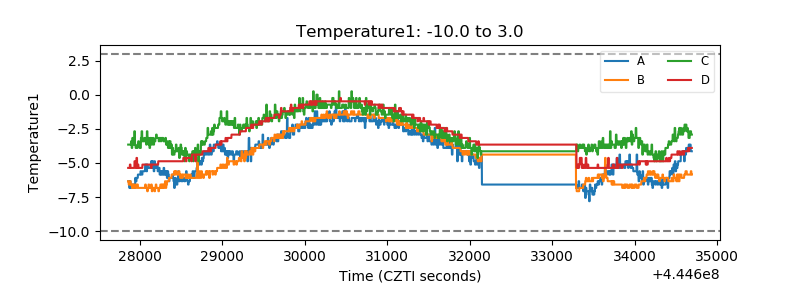 |
| Veto HV Monitor | 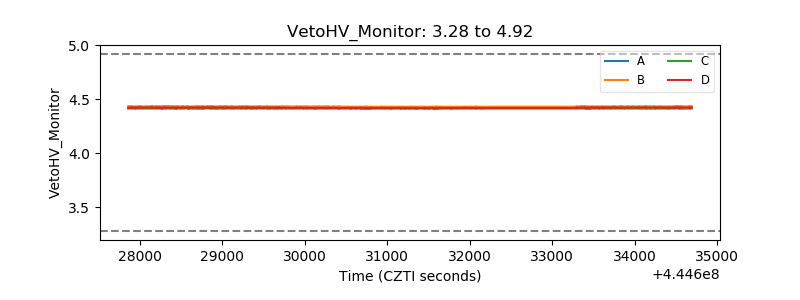 |
| Veto LLD | 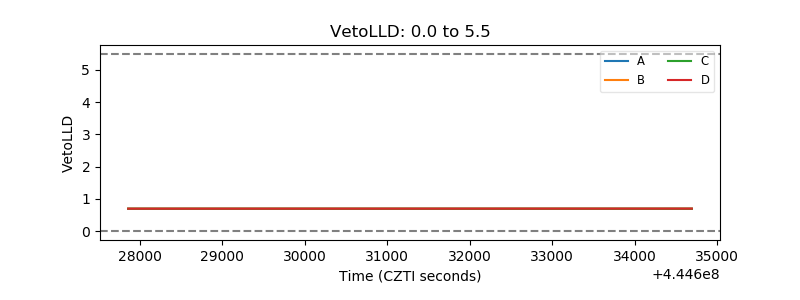 |
| Alpha Counter | 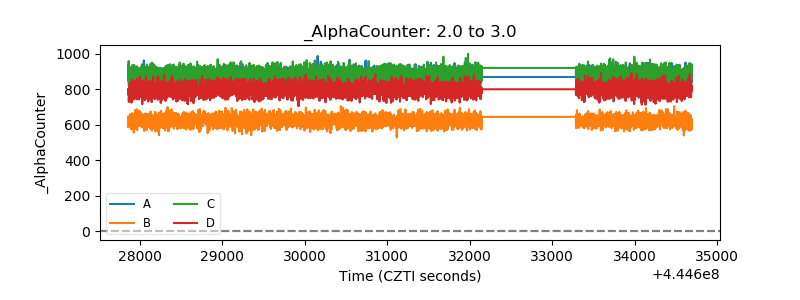 |
| _CPM_Rate | 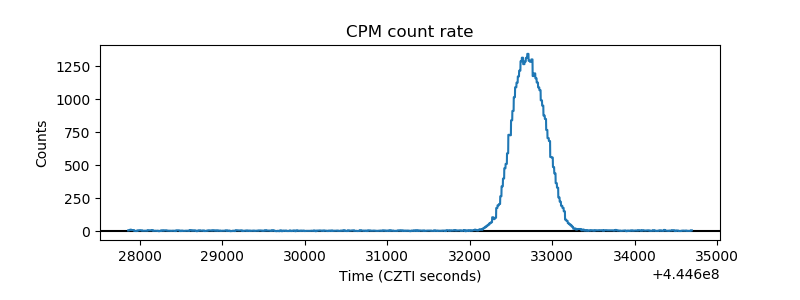 |
| CZT Counter | 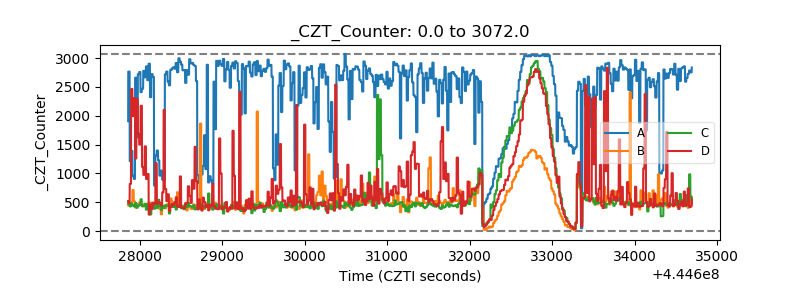 |
| +2.5 Volts monitor | 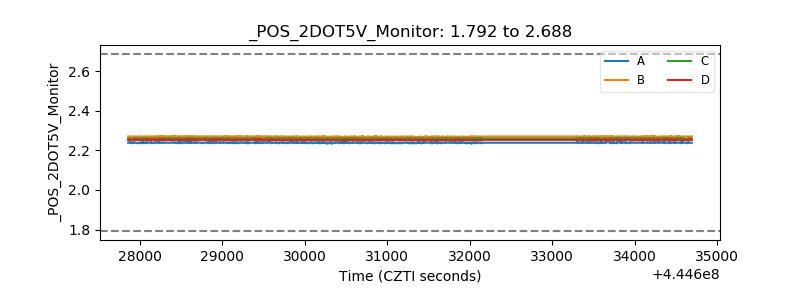 |
| +5 Volts monitor | 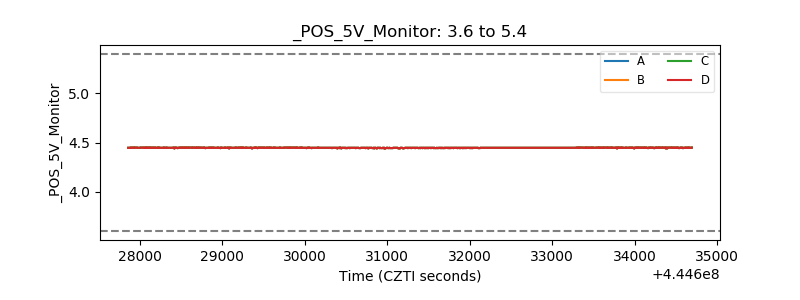 |
| _ROLL_ROT | 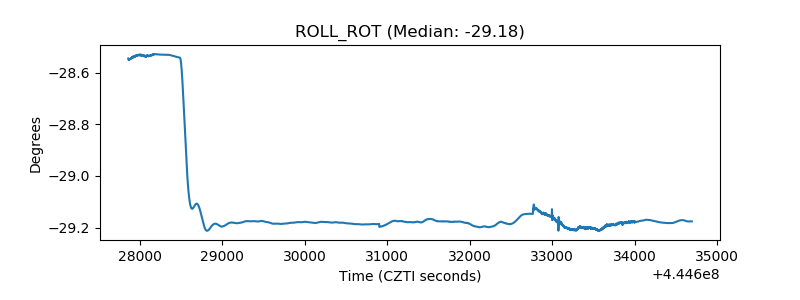 |
| _Roll_DEC | 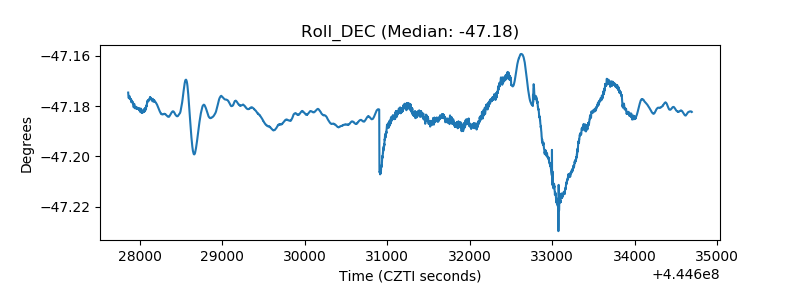 |
| _Roll_RA | 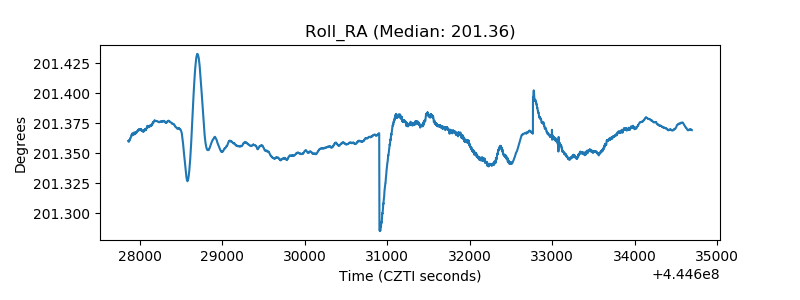 |
| Veto Counter | 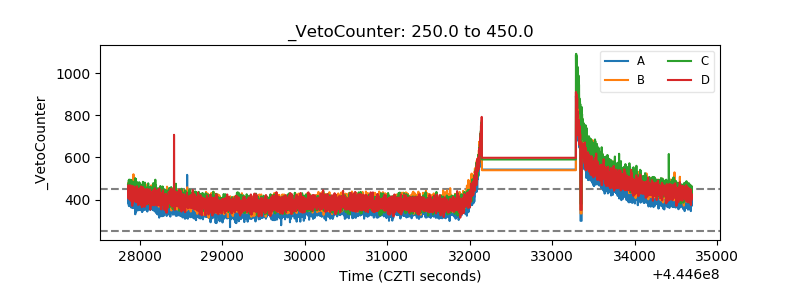 |