| Param | Original file | Final file |
|---|---|---|
| Filename | modeM0/AS1A13_049T04_9000006048_45155cztM0_level2.fits | modeM0/AS1A13_049T04_9000006048_45155cztM0_level2_quad_clean.evt |
| Size (bytes) | 597,600,000 | 95,149,440 |
| Size | 569.9 MB | 90.7 MB |
| Events in quadrant A | 11,257,879 | 362,016 |
| Events in quadrant B | 3,397,235 | 739,292 |
| Events in quadrant C | 3,190,950 | 718,576 |
| Events in quadrant D | 3,807,115 | 640,355 |
| Mode M9 | |||
|---|---|---|---|
| Quadrant | BADHDUFLAG | Total packets | Discarded packets |
| A | 0 | 12 | 0 |
| B | 0 | 12 | 0 |
| C | 0 | 12 | 0 |
| D | 0 | 12 | 0 |
| Mode M0 | |||
|---|---|---|---|
| Quadrant | BADHDUFLAG | Total packets | Discarded packets |
| A | 0 | 37497 | 1 |
| B | 0 | 13886 | 1 |
| C | 0 | 13330 | 1 |
| D | 0 | 15225 | 1 |
| Mode SS | |||
|---|---|---|---|
| Quadrant | BADHDUFLAG | Total packets | Discarded packets |
| A | 0 | 122 | 0 |
| B | 0 | 122 | 0 |
| C | 0 | 122 | 0 |
| D | 0 | 122 | 0 |
| Quadrant | Total seconds | Saturated seconds | Saturation percentage |
|---|---|---|---|
| A | 6026 | 3180 | 52.771324% |
| B | 6027 | 101 | 1.675792% |
| C | 6027 | 58 | 0.962336% |
| D | 6027 | 174 | 2.887008% |
Noise dominated data is calculated using 1-second bins in cleaned event files. If a bin has >2000 counts, and if more than 50% of those come from <1% of pixels, then it is considered to be noise-dominated and hence unusable.
| Quadrant | # 1 sec bins | Bins with >0 counts | Bins with >2000 counts | High rate bins dominated by noise | Noise dominated (total time) | Noise dominated (detector-on time) | Marked lightcurve |
|---|---|---|---|---|---|---|---|
| A | 7216 | 6027 | 2848 | 2848 | 39.47% | 47.25% | 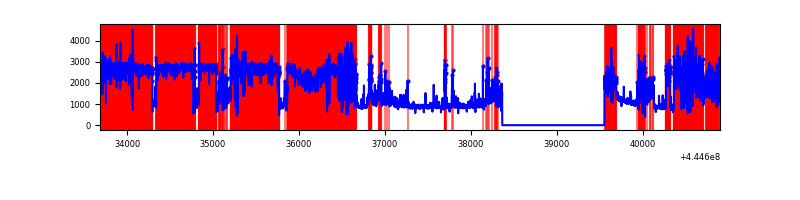 |
| B | 7217 | 6028 | 23 | 23 | 0.32% | 0.38% | 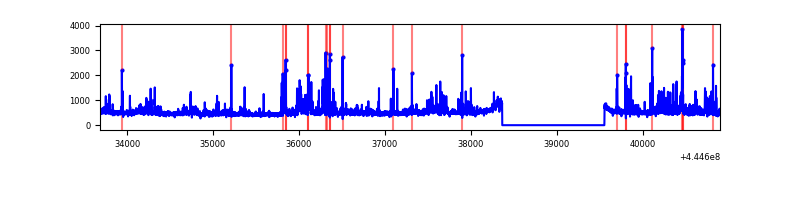 |
| C | 7217 | 6028 | 20 | 20 | 0.28% | 0.33% | 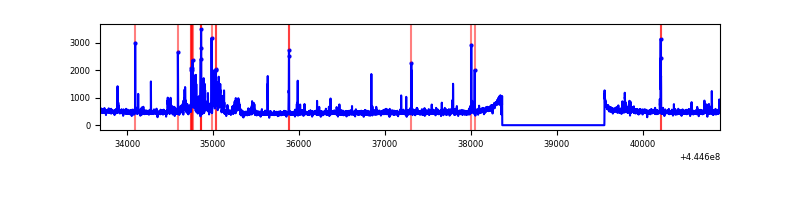 |
| D | 7217 | 6027 | 114 | 114 | 1.58% | 1.89% | 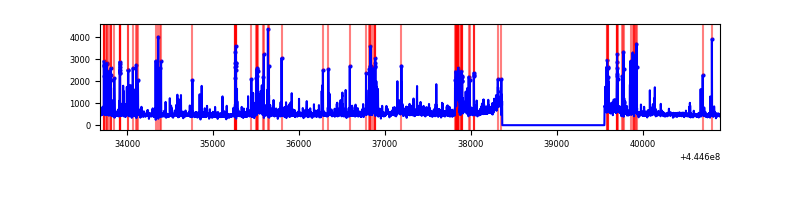 |
Top three noisy pixels from each quadrant. If the there are fewer than three noisy pixels in the level2.evt file, extra rows are filled as -1
| Pixel properties | Quadrant properties | ||||||
|---|---|---|---|---|---|---|---|
| Quadrant | DetID | PixID | Counts | Sigma | Mean | Median | Sigma |
| A | 15 | 223 | 7755861 | 78082.74 | 480 | 470 | 99.3 |
| A | 10 | 83 | 1591488 | 16018.67 | 480 | 470 | 99.3 |
| A | 15 | 174 | 22949 | 226.32 | 480 | 470 | 99.3 |
| B | 12 | 16 | 196899 | 1399.5 | 715 | 692 | 140.2 |
| B | 5 | 172 | 146802 | 1042.17 | 715 | 692 | 140.2 |
| B | 4 | 170 | 127602 | 905.22 | 715 | 692 | 140.2 |
| C | 1 | 3 | 158898 | 941.06 | 719 | 723 | 168.1 |
| C | 12 | 2 | 139361 | 824.82 | 719 | 723 | 168.1 |
| C | 14 | 254 | 55248 | 324.39 | 719 | 723 | 168.1 |
| D | 13 | 249 | 410934 | 2338.59 | 709 | 689 | 175.4 |
| D | 1 | 52 | 240974 | 1369.74 | 709 | 689 | 175.4 |
| D | 11 | 241 | 159334 | 904.35 | 709 | 689 | 175.4 |
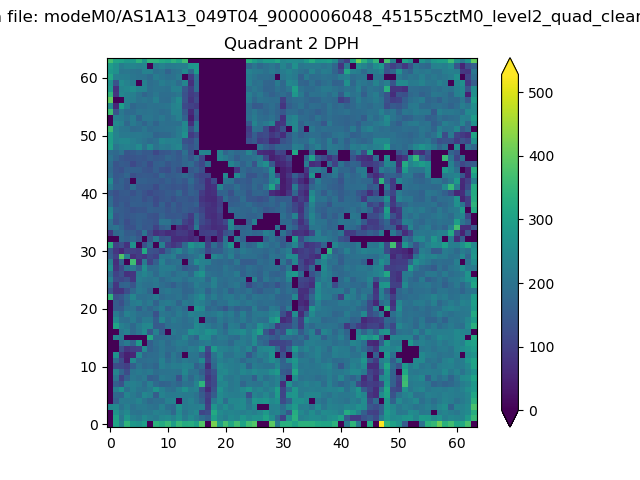
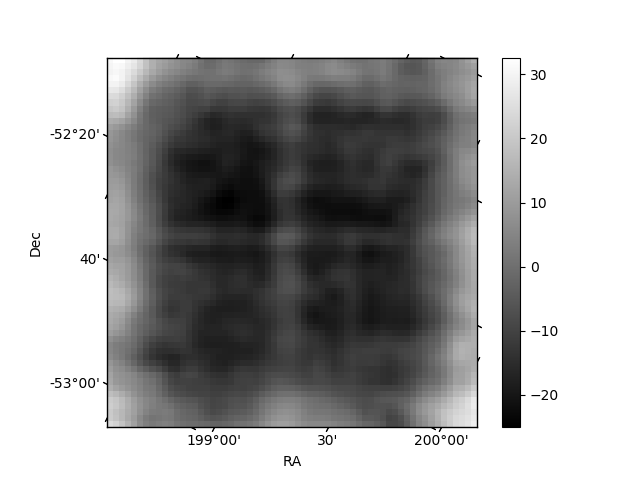
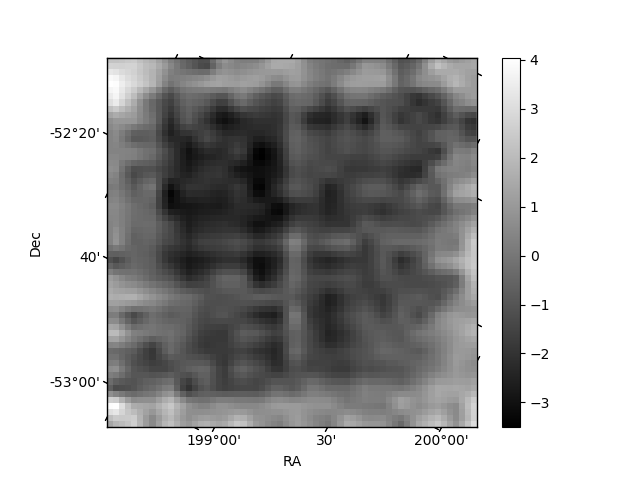
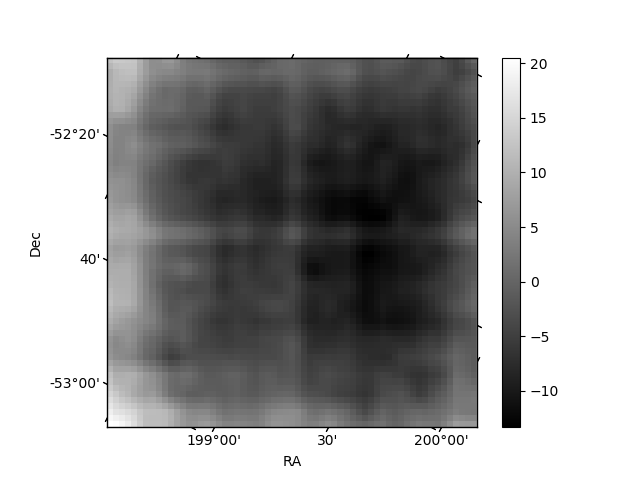
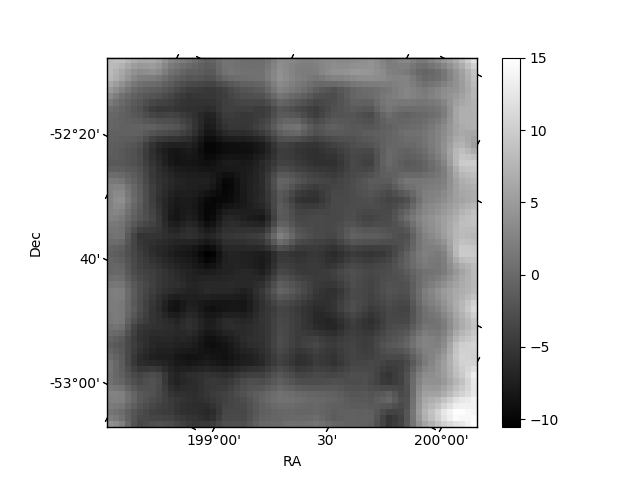
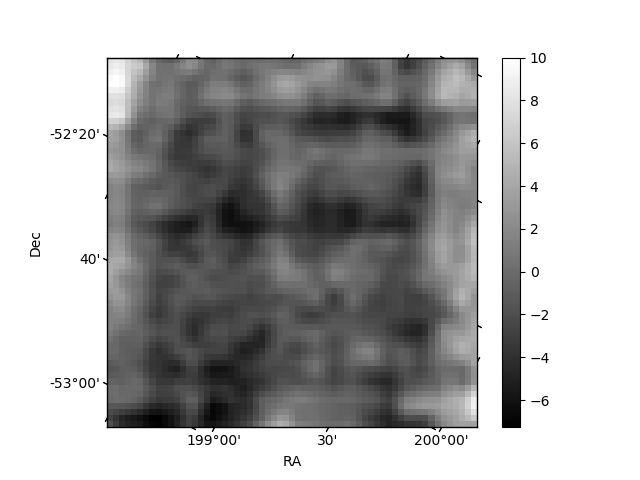
Histogram calculated using DETX and DETY for each event in the final _common_clean file
| Quadrant A | 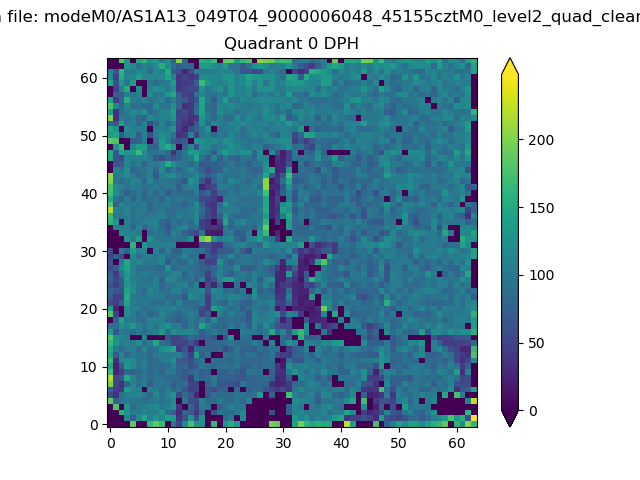 |
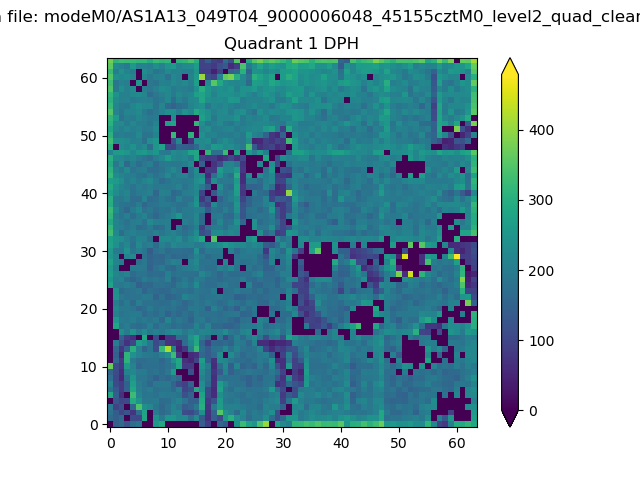 |
Quadrant B |
|---|---|---|---|
| Quadrant D | 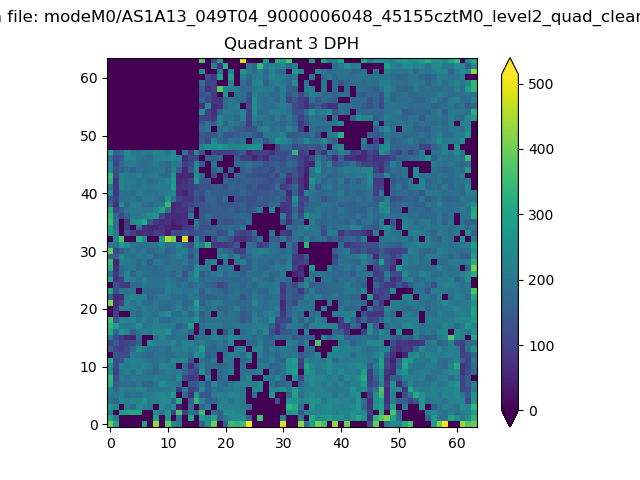 |
 |
Quadrant C |
| Plot type | Count rate plots | Images |
|---|---|---|
| Comparison with Poisson distribution Blue bars denote a histogram of data divided into 1 sec bins. Red curve is a Poisson curve with rate = median count rate of data. |
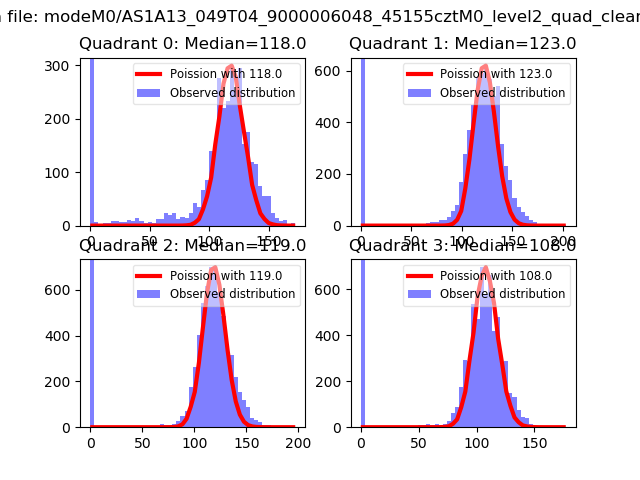 |
 |
| Quadrant-wise count rates Data is divided into 100 sec bins |
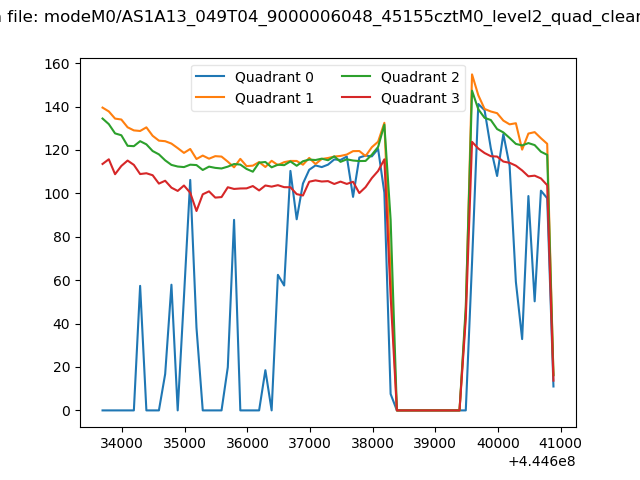 |
|
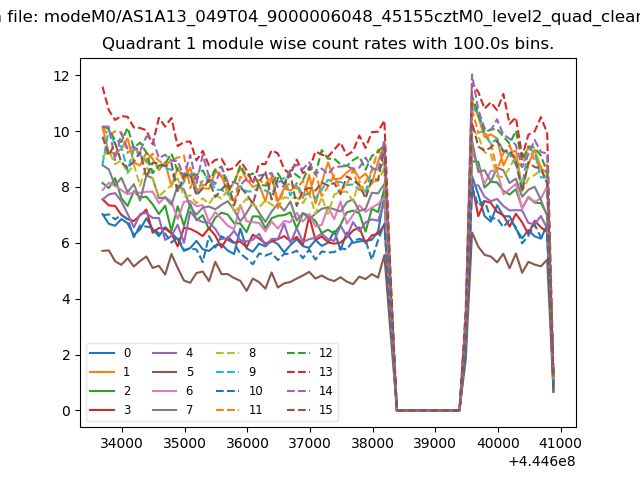
| Module-wise count rates for Quadrant A Data is divided into 100 sec bins |
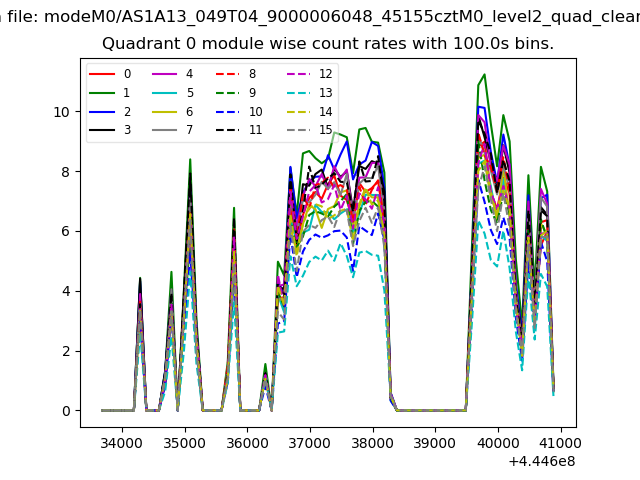 |
 |
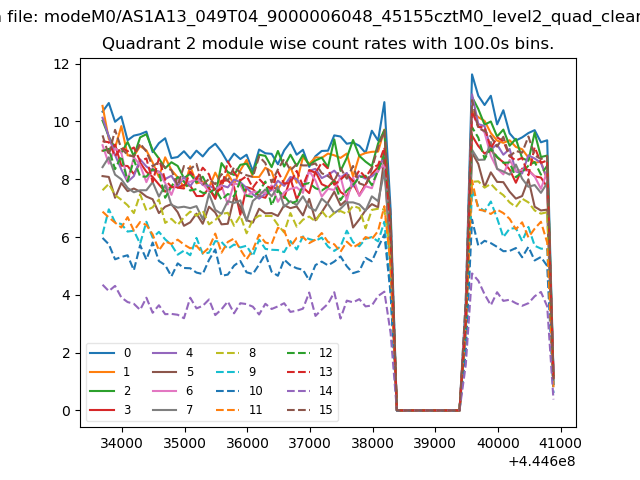
| Module-wise count rates for Quadrant B Data is divided into 100 sec bins |
 |
 |
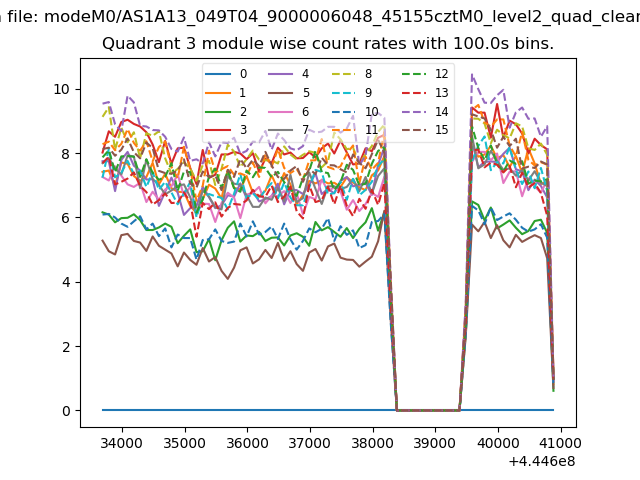
| Module-wise count rates for Quadrant C Data is divided into 100 sec bins |
 |
 |
| Module-wise count rates for Quadrant D Data is divided into 100 sec bins |
 |
 |
| Parameter | Plot |
|---|---|
| CZT HV Monitor | 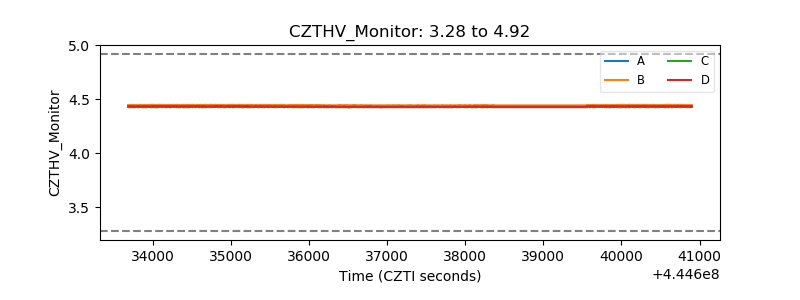 |
| D_VDD | 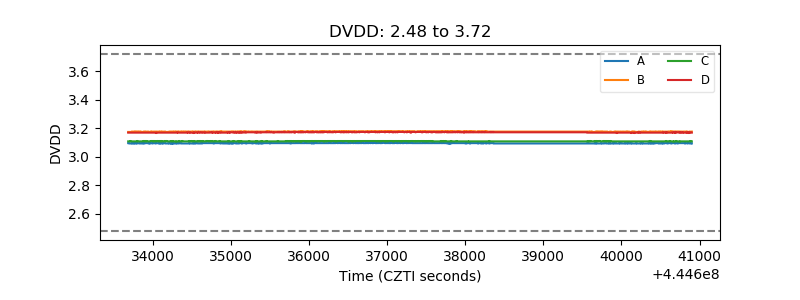 |
| Temperature 1 | 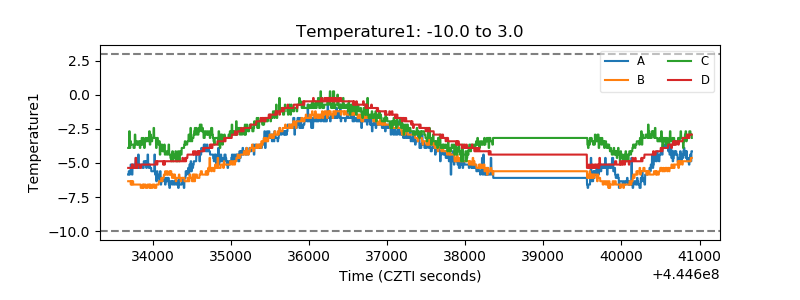 |
| Veto HV Monitor |  |
| Veto LLD | 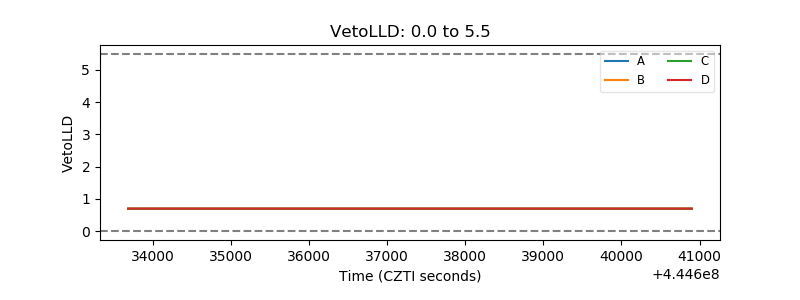 |
| Alpha Counter | 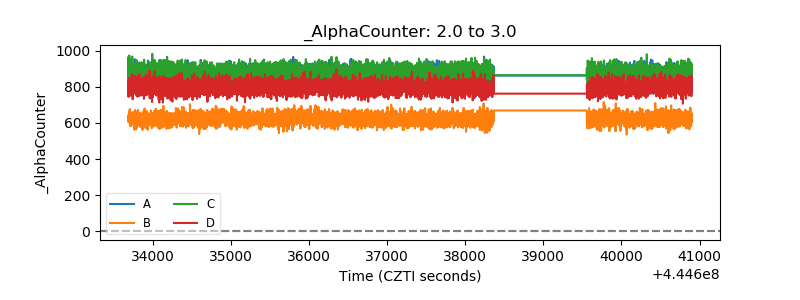 |
| _CPM_Rate | 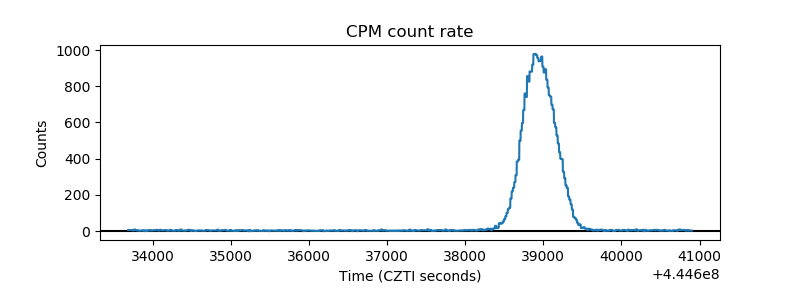 |
| CZT Counter | 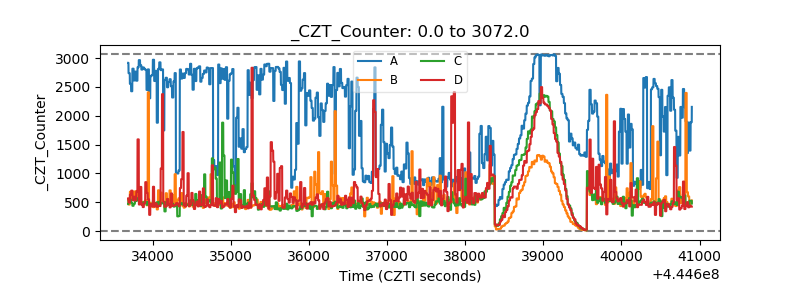 |
| +2.5 Volts monitor | 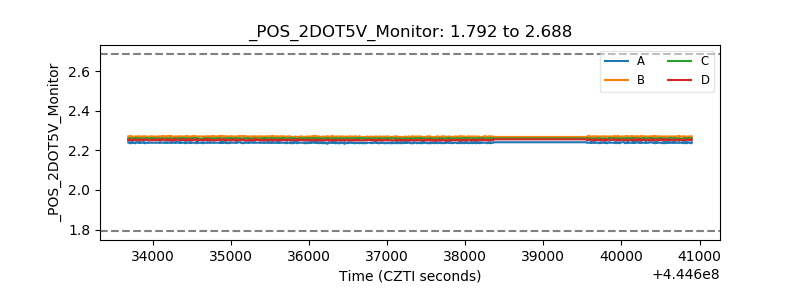 |
| +5 Volts monitor | 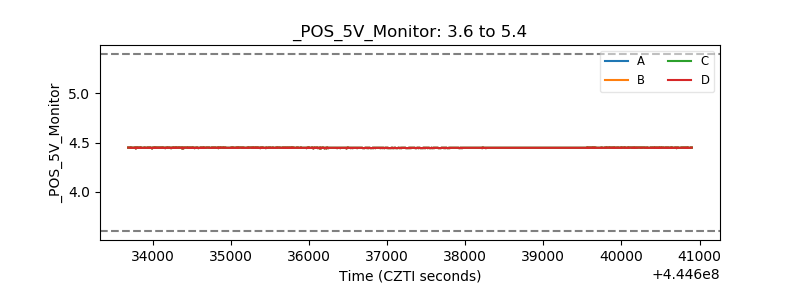 |
| _ROLL_ROT | 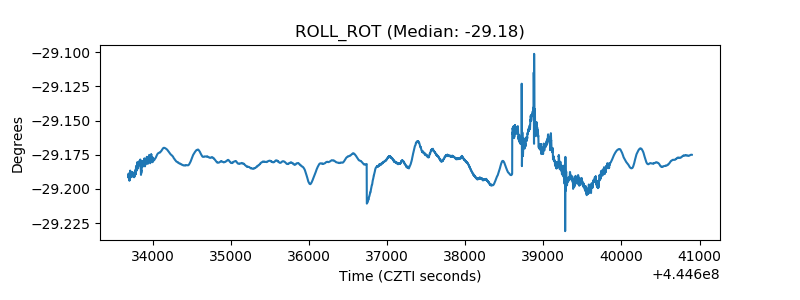 |
| _Roll_DEC | 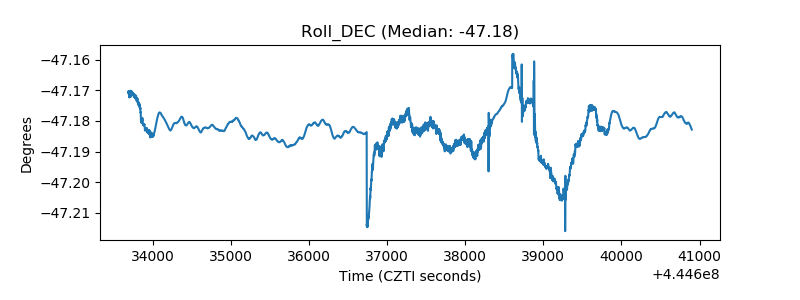 |
| _Roll_RA | 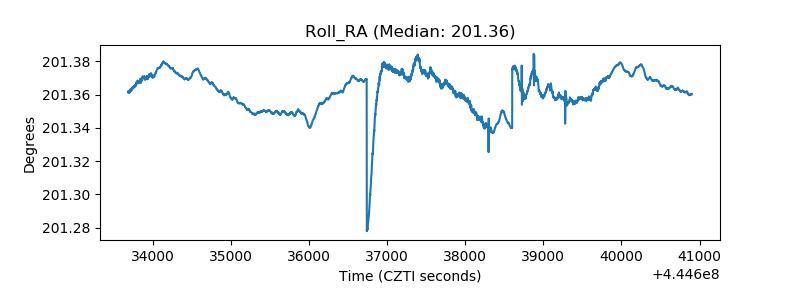 |
| Veto Counter | 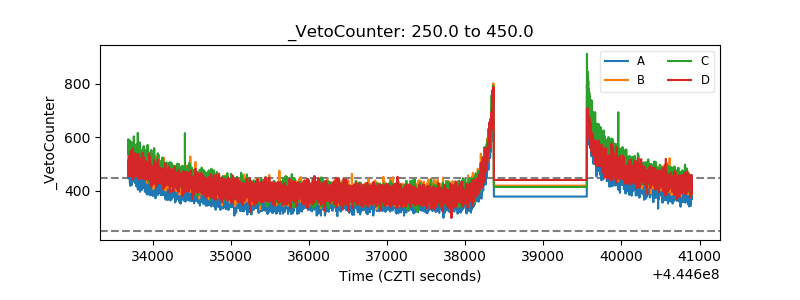 |