| Param | Original file | Final file |
|---|---|---|
| Filename | modeM0/AS1A13_049T04_9000006048_45156cztM0_level2.fits | modeM0/AS1A13_049T04_9000006048_45156cztM0_level2_quad_clean.evt |
| Size (bytes) | 655,862,400 | 96,347,520 |
| Size | 625.5 MB | 91.9 MB |
| Events in quadrant A | 12,045,466 | 370,465 |
| Events in quadrant B | 3,322,045 | 758,936 |
| Events in quadrant C | 2,997,500 | 735,815 |
| Events in quadrant D | 5,427,823 | 616,218 |
| Mode M9 | |||
|---|---|---|---|
| Quadrant | BADHDUFLAG | Total packets | Discarded packets |
| A | 0 | 12 | 0 |
| B | 0 | 12 | 0 |
| C | 0 | 12 | 0 |
| D | 0 | 12 | 0 |
| Mode M0 | |||
|---|---|---|---|
| Quadrant | BADHDUFLAG | Total packets | Discarded packets |
| A | 0 | 40092 | 5 |
| B | 0 | 13863 | 1 |
| C | 0 | 13023 | 1 |
| D | 0 | 20270 | 1 |
| Mode SS | |||
|---|---|---|---|
| Quadrant | BADHDUFLAG | Total packets | Discarded packets |
| A | 0 | 126 | 0 |
| B | 0 | 126 | 0 |
| C | 0 | 126 | 0 |
| D | 0 | 126 | 0 |
| Quadrant | Total seconds | Saturated seconds | Saturation percentage |
|---|---|---|---|
| A | 6249 | 3452 | 55.240839% |
| B | 6250 | 79 | 1.264000% |
| C | 6250 | 42 | 0.672000% |
| D | 6250 | 665 | 10.640000% |
Noise dominated data is calculated using 1-second bins in cleaned event files. If a bin has >2000 counts, and if more than 50% of those come from <1% of pixels, then it is considered to be noise-dominated and hence unusable.
| Quadrant | # 1 sec bins | Bins with >0 counts | Bins with >2000 counts | High rate bins dominated by noise | Noise dominated (total time) | Noise dominated (detector-on time) | Marked lightcurve |
|---|---|---|---|---|---|---|---|
| A | 7398 | 6248 | 2981 | 2981 | 40.29% | 47.71% | 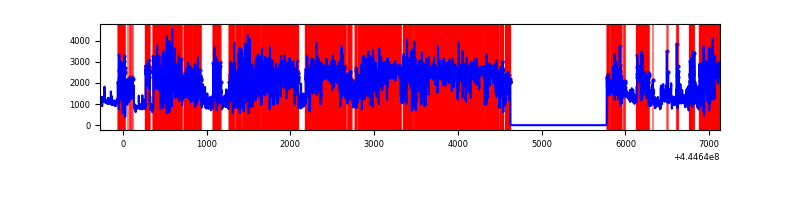 |
| B | 7400 | 6251 | 21 | 21 | 0.28% | 0.34% | 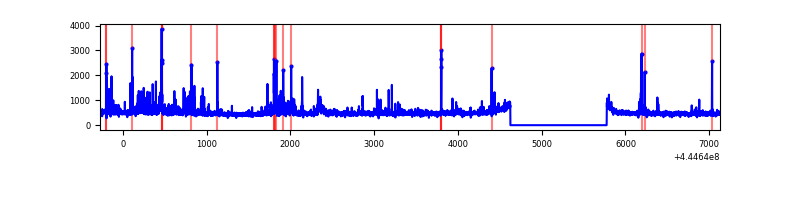 |
| C | 7400 | 6251 | 3 | 3 | 0.04% | 0.05% | 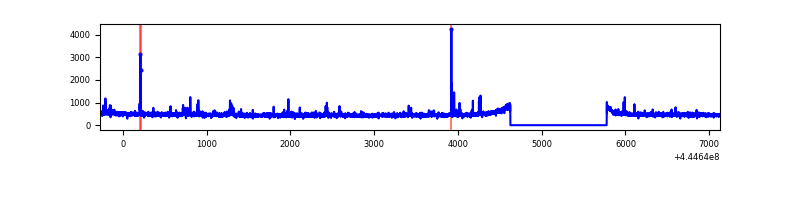 |
| D | 7400 | 6251 | 506 | 506 | 6.84% | 8.09% | 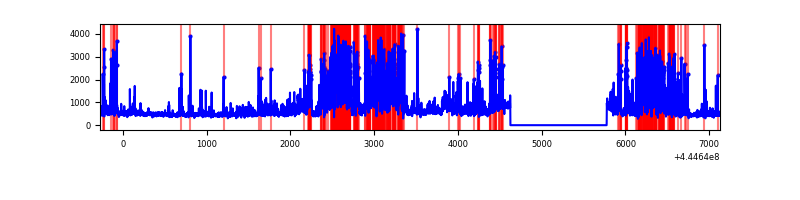 |
Top three noisy pixels from each quadrant. If the there are fewer than three noisy pixels in the level2.evt file, extra rows are filled as -1
| Pixel properties | Quadrant properties | ||||||
|---|---|---|---|---|---|---|---|
| Quadrant | DetID | PixID | Counts | Sigma | Mean | Median | Sigma |
| A | 15 | 223 | 7884825 | 68984.02 | 556 | 544 | 114.3 |
| A | 10 | 83 | 1858035 | 16252.24 | 556 | 544 | 114.3 |
| A | 15 | 174 | 100224 | 872.16 | 556 | 544 | 114.3 |
| B | 12 | 16 | 128164 | 893.56 | 736 | 713 | 142.6 |
| B | 5 | 172 | 90135 | 626.94 | 736 | 713 | 142.6 |
| B | 4 | 170 | 76313 | 530.03 | 736 | 713 | 142.6 |
| C | 14 | 254 | 59501 | 342.37 | 738 | 744 | 171.6 |
| C | 12 | 2 | 20449 | 114.82 | 738 | 744 | 171.6 |
| C | 11 | 16 | 17683 | 98.7 | 738 | 744 | 171.6 |
| D | 5 | 235 | 1463576 | 8224.75 | 710 | 690 | 177.9 |
| D | 11 | 241 | 350832 | 1968.59 | 710 | 690 | 177.9 |
| D | 13 | 249 | 284706 | 1596.82 | 710 | 690 | 177.9 |
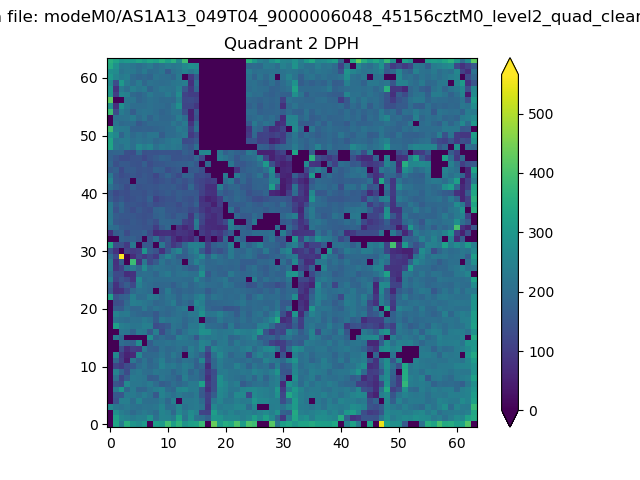
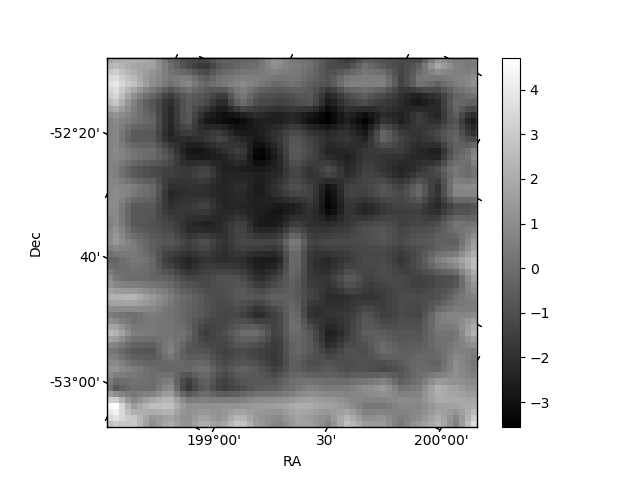
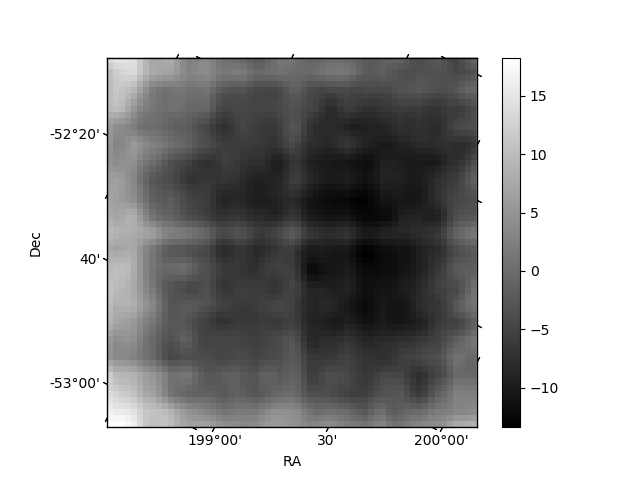
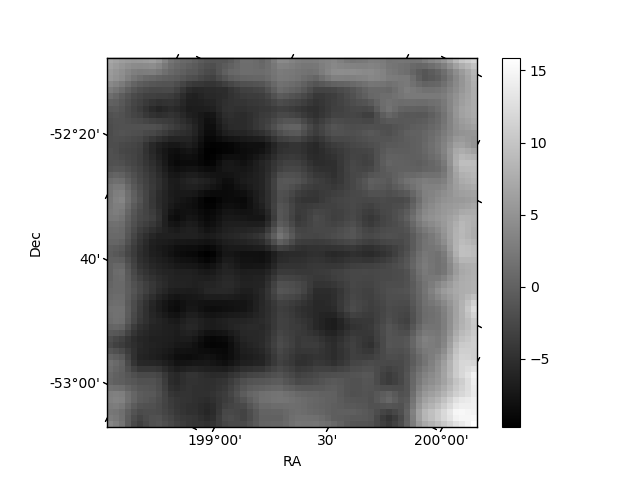
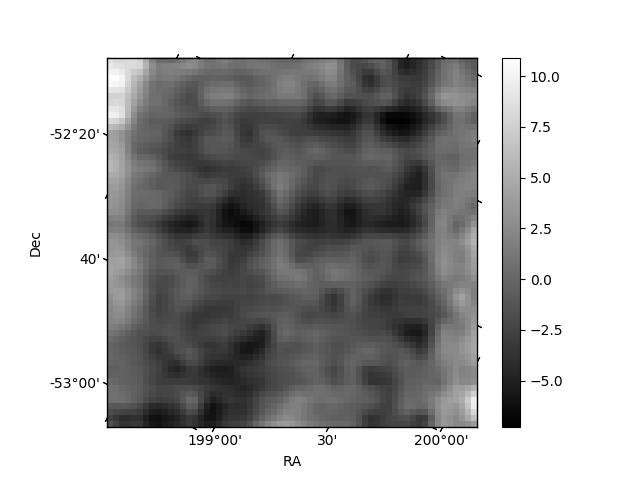
Histogram calculated using DETX and DETY for each event in the final _common_clean file
| Quadrant A | 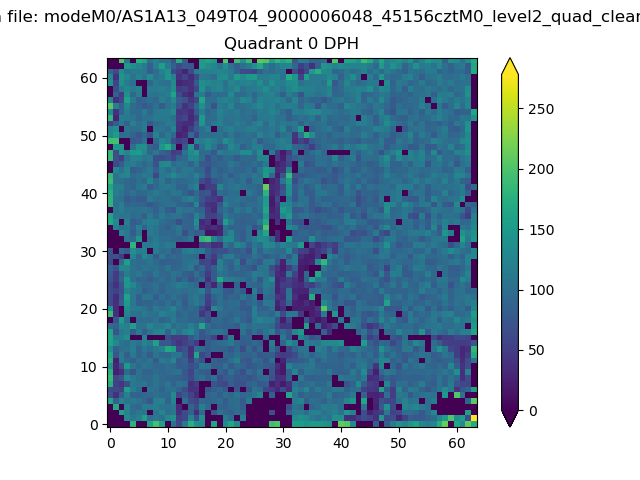 |
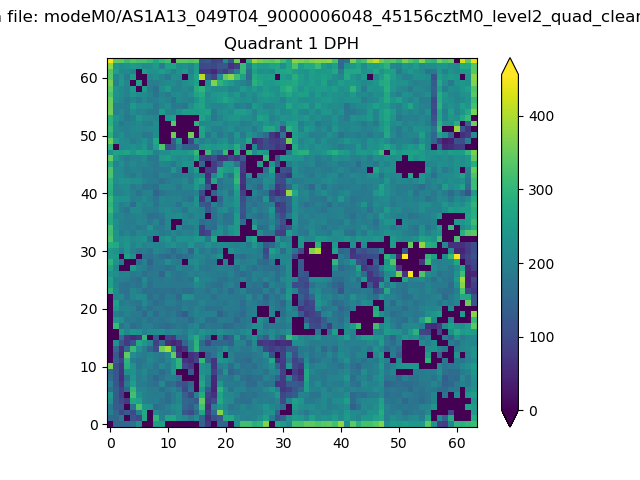 |
Quadrant B |
|---|---|---|---|
| Quadrant D | 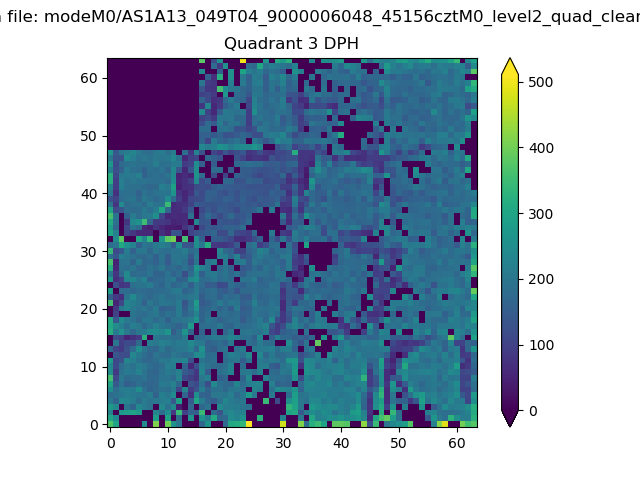 |
 |
Quadrant C |
| Plot type | Count rate plots | Images |
|---|---|---|
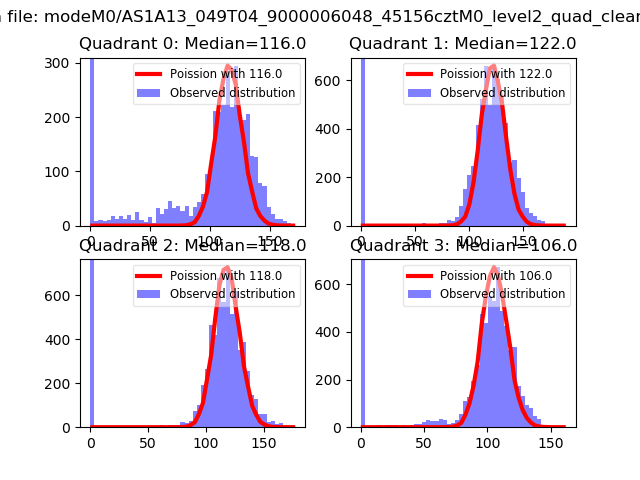
| Comparison with Poisson distribution Blue bars denote a histogram of data divided into 1 sec bins. Red curve is a Poisson curve with rate = median count rate of data. |
 |
 |
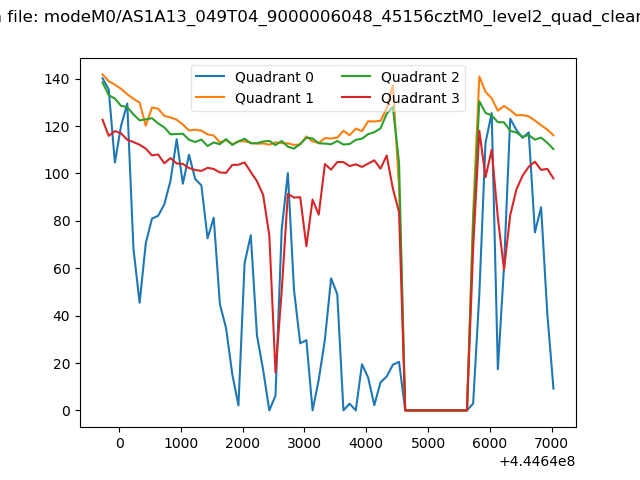
| Quadrant-wise count rates Data is divided into 100 sec bins |
 |
|
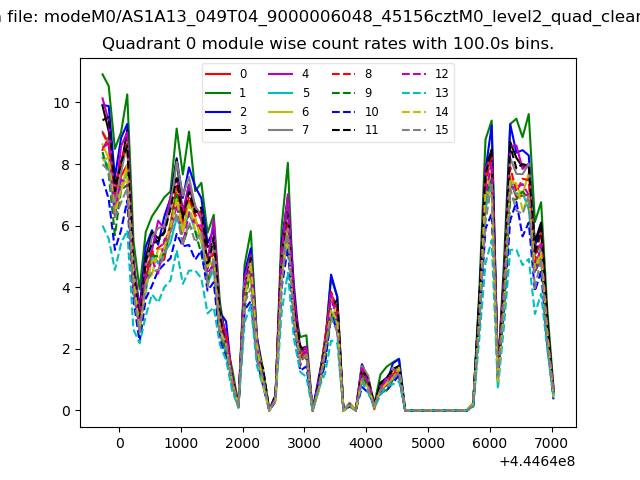
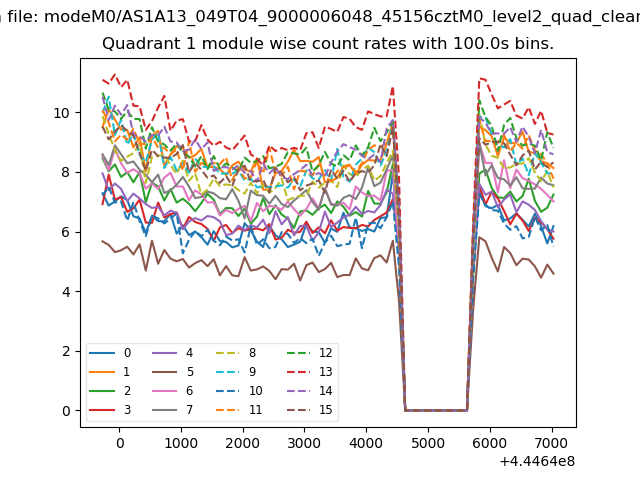
| Module-wise count rates for Quadrant A Data is divided into 100 sec bins |
 |
 |
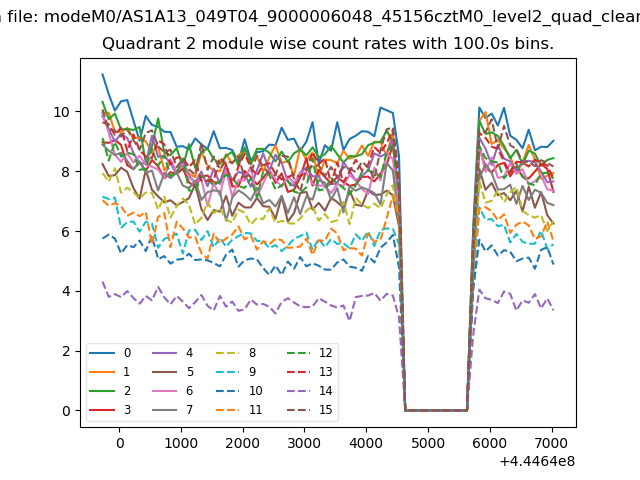
| Module-wise count rates for Quadrant B Data is divided into 100 sec bins |
 |
 |
| Module-wise count rates for Quadrant C Data is divided into 100 sec bins |
 |
 |
| Module-wise count rates for Quadrant D Data is divided into 100 sec bins |
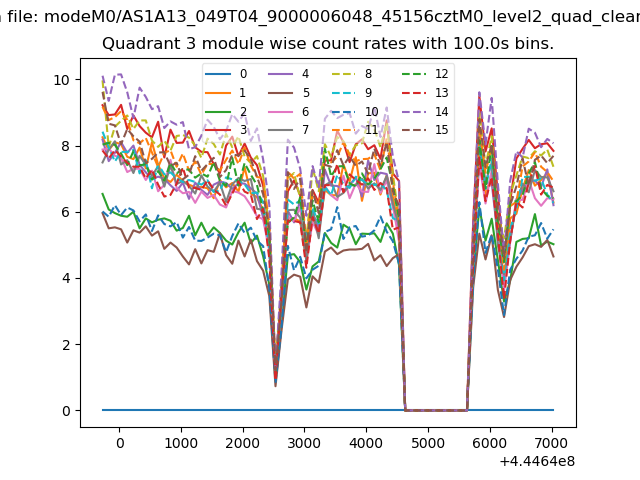 |
 |
| Parameter | Plot |
|---|---|
| CZT HV Monitor | 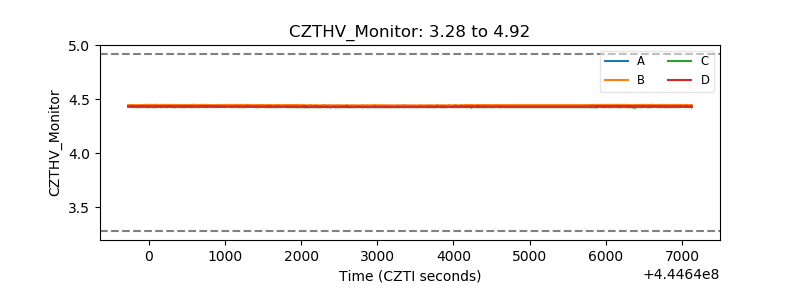 |
| D_VDD | 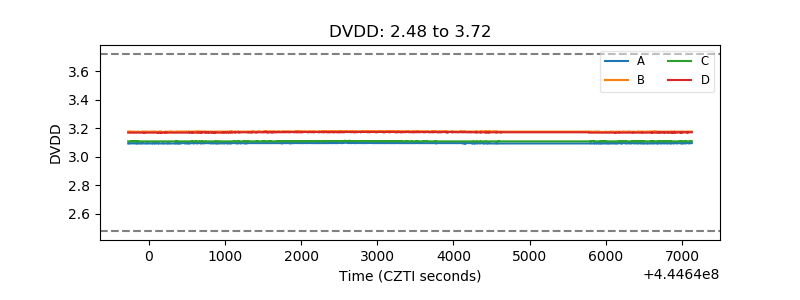 |
| Temperature 1 | 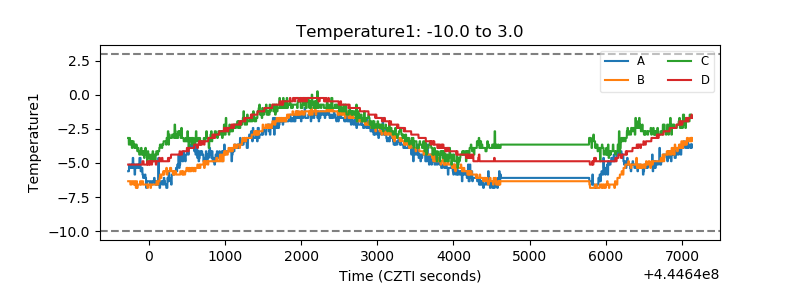 |
| Veto HV Monitor | 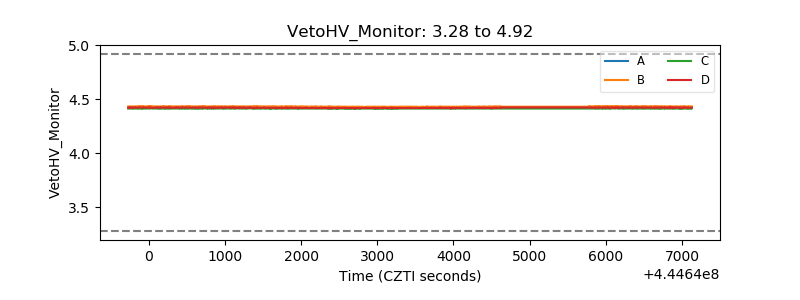 |
| Veto LLD | 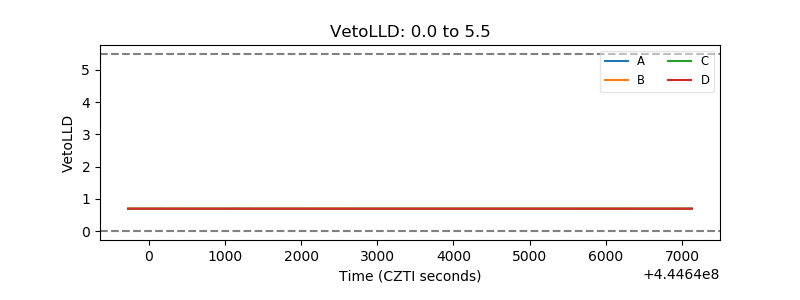 |
| Alpha Counter | 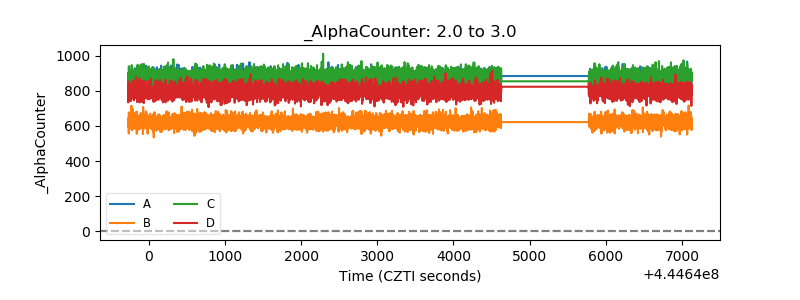 |
| _CPM_Rate | 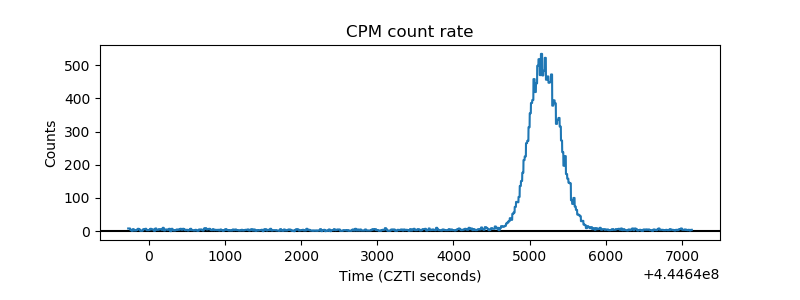 |
| CZT Counter | 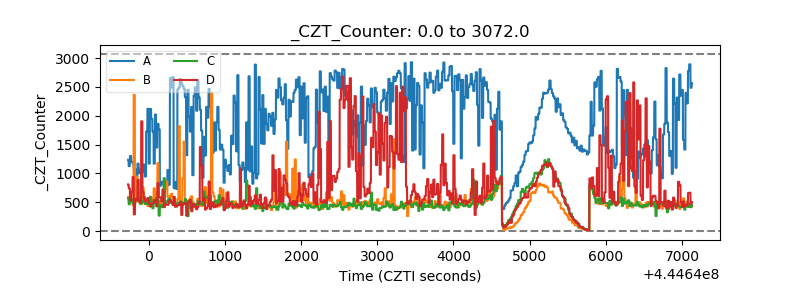 |
| +2.5 Volts monitor | 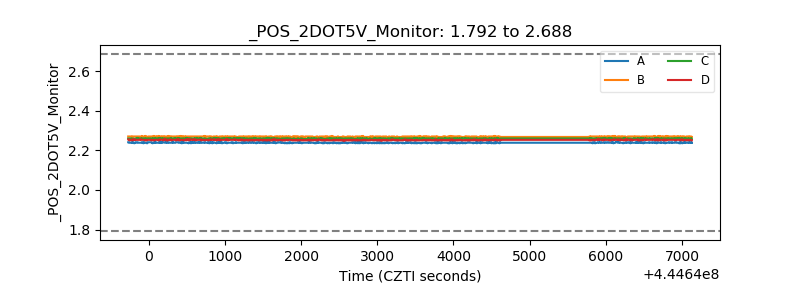 |
| +5 Volts monitor | 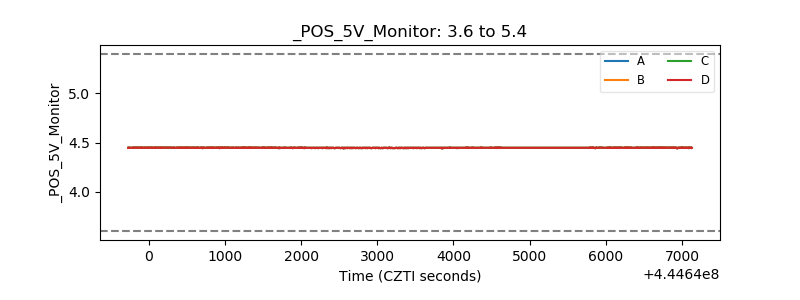 |
| _ROLL_ROT | 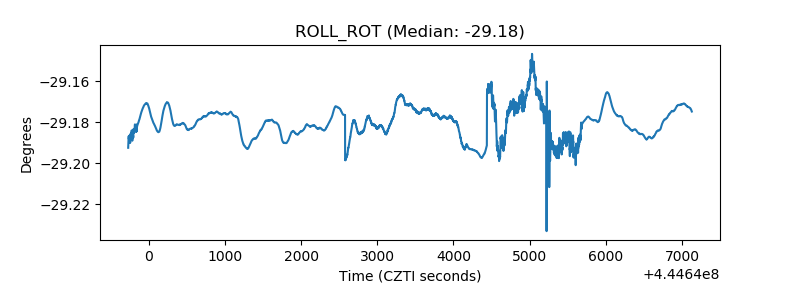 |
| _Roll_DEC | 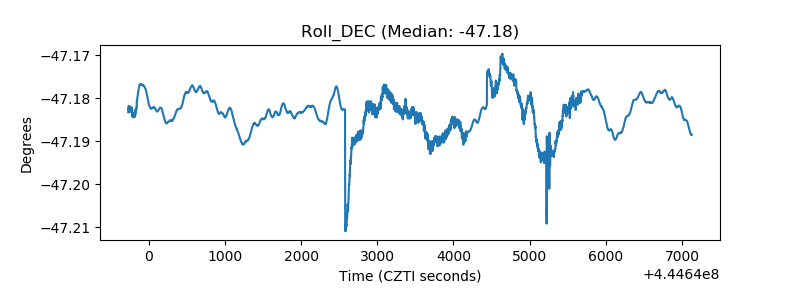 |
| _Roll_RA | 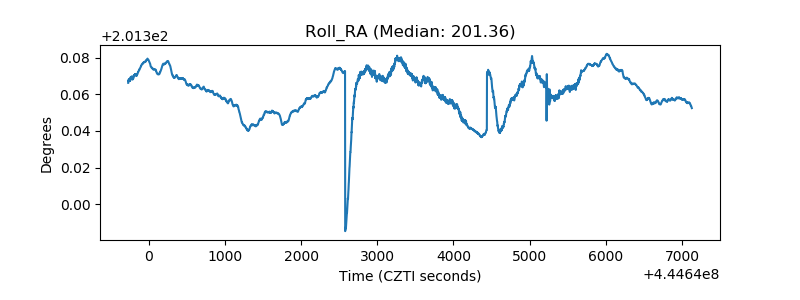 |
| Veto Counter | 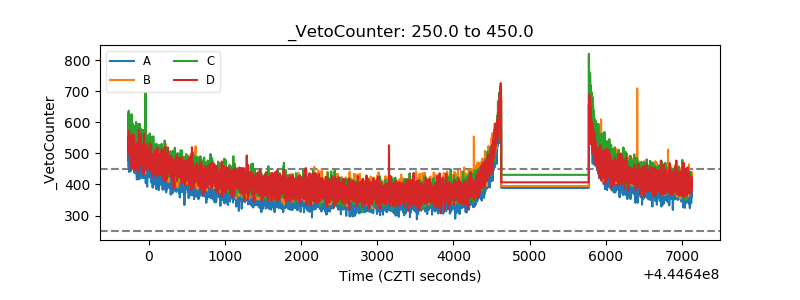 |