| Param | Original file | Final file |
|---|---|---|
| Filename | modeM0/AS1A13_049T04_9000006048_45157cztM0_level2.fits | modeM0/AS1A13_049T04_9000006048_45157cztM0_level2_quad_clean.evt |
| Size (bytes) | 664,482,240 | 100,152,000 |
| Size | 633.7 MB | 95.5 MB |
| Events in quadrant A | 10,977,839 | 501,935 |
| Events in quadrant B | 3,430,495 | 758,195 |
| Events in quadrant C | 4,249,119 | 688,471 |
| Events in quadrant D | 5,428,158 | 623,874 |
| Mode M9 | |||
|---|---|---|---|
| Quadrant | BADHDUFLAG | Total packets | Discarded packets |
| A | 0 | 10 | 0 |
| B | 0 | 10 | 0 |
| C | 0 | 10 | 0 |
| D | 0 | 10 | 0 |
| Mode M0 | |||
|---|---|---|---|
| Quadrant | BADHDUFLAG | Total packets | Discarded packets |
| A | 0 | 37171 | 2 |
| B | 0 | 14535 | 2 |
| C | 0 | 17037 | 2 |
| D | 0 | 20539 | 3 |
| Mode SS | |||
|---|---|---|---|
| Quadrant | BADHDUFLAG | Total packets | Discarded packets |
| A | 0 | 134 | 0 |
| B | 0 | 134 | 0 |
| C | 0 | 134 | 0 |
| D | 0 | 134 | 0 |
| Quadrant | Total seconds | Saturated seconds | Saturation percentage |
|---|---|---|---|
| A | 6594 | 2544 | 38.580528% |
| B | 6594 | 186 | 2.820746% |
| C | 6595 | 535 | 8.112206% |
| D | 6594 | 669 | 10.145587% |
Noise dominated data is calculated using 1-second bins in cleaned event files. If a bin has >2000 counts, and if more than 50% of those come from <1% of pixels, then it is considered to be noise-dominated and hence unusable.
| Quadrant | # 1 sec bins | Bins with >0 counts | Bins with >2000 counts | High rate bins dominated by noise | Noise dominated (total time) | Noise dominated (detector-on time) | Marked lightcurve |
|---|---|---|---|---|---|---|---|
| A | 7584 | 6594 | 2032 | 2032 | 26.79% | 30.82% | 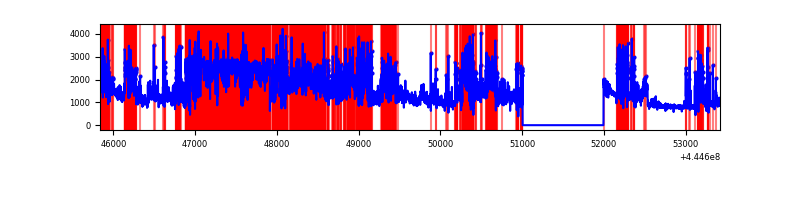 |
| B | 7584 | 6595 | 69 | 69 | 0.91% | 1.05% | 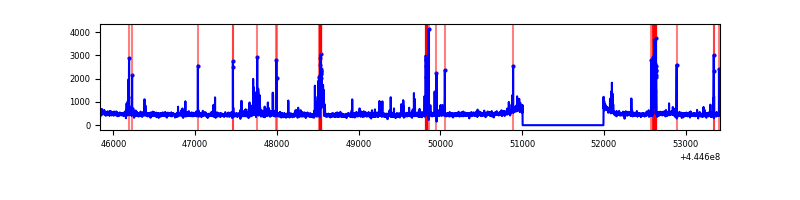 |
| C | 7585 | 6596 | 449 | 449 | 5.92% | 6.81% | 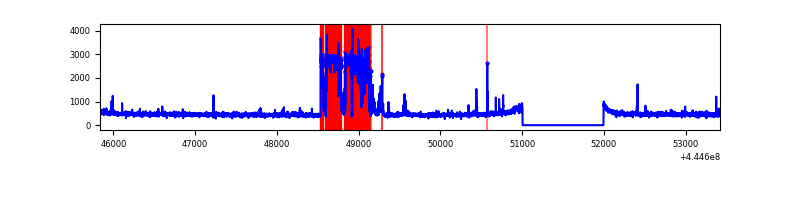 |
| D | 7584 | 6595 | 494 | 494 | 6.51% | 7.49% | 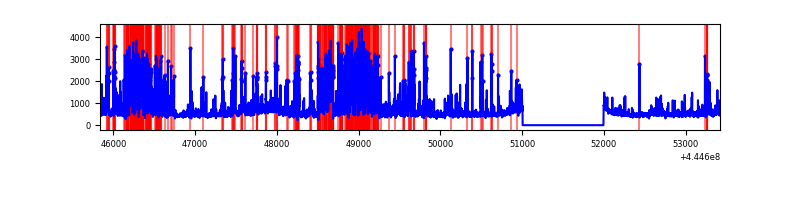 |
Top three noisy pixels from each quadrant. If the there are fewer than three noisy pixels in the level2.evt file, extra rows are filled as -1
| Pixel properties | Quadrant properties | ||||||
|---|---|---|---|---|---|---|---|
| Quadrant | DetID | PixID | Counts | Sigma | Mean | Median | Sigma |
| A | 15 | 223 | 6355900 | 49117.56 | 620 | 605 | 129.4 |
| A | 10 | 83 | 2148114 | 16597.25 | 620 | 605 | 129.4 |
| A | 15 | 174 | 32572 | 247.06 | 620 | 605 | 129.4 |
| B | 5 | 172 | 221896 | 1493.31 | 757 | 734 | 148.1 |
| B | 5 | 171 | 85040 | 569.24 | 757 | 734 | 148.1 |
| B | 4 | 170 | 54671 | 364.19 | 757 | 734 | 148.1 |
| C | 1 | 3 | 1328676 | 7739.27 | 733 | 738 | 171.6 |
| C | 12 | 250 | 23517 | 132.76 | 733 | 738 | 171.6 |
| C | 14 | 254 | 17334 | 96.72 | 733 | 738 | 171.6 |
| D | 5 | 235 | 1130236 | 6137.03 | 734 | 714 | 184.1 |
| D | 13 | 249 | 288211 | 1562.06 | 734 | 714 | 184.1 |
| D | 2 | 249 | 231014 | 1251.29 | 734 | 714 | 184.1 |
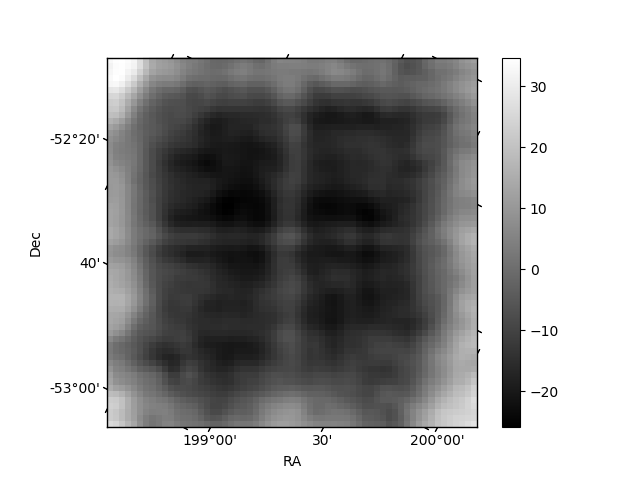
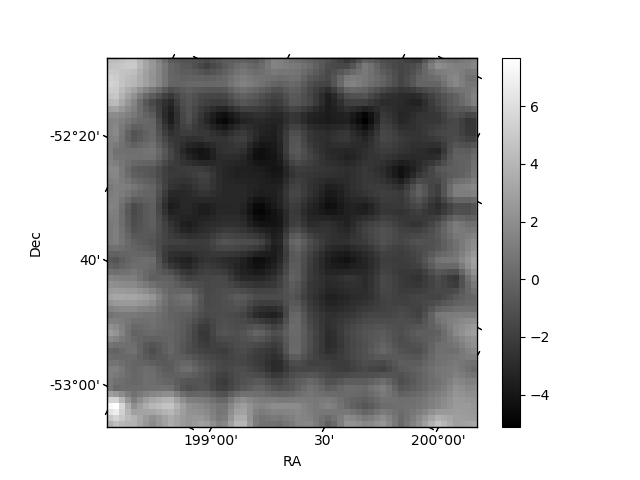
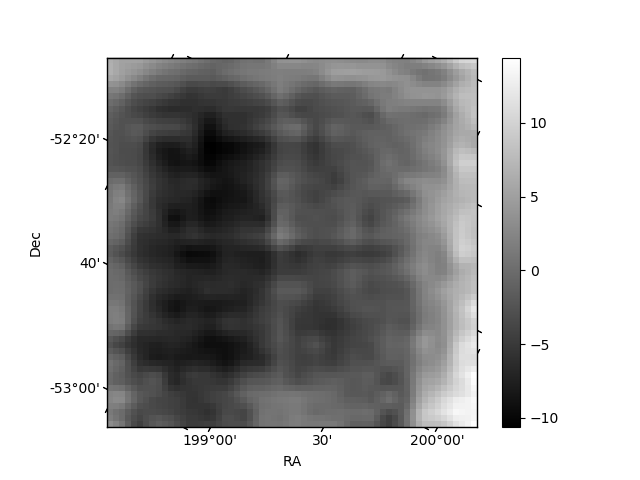
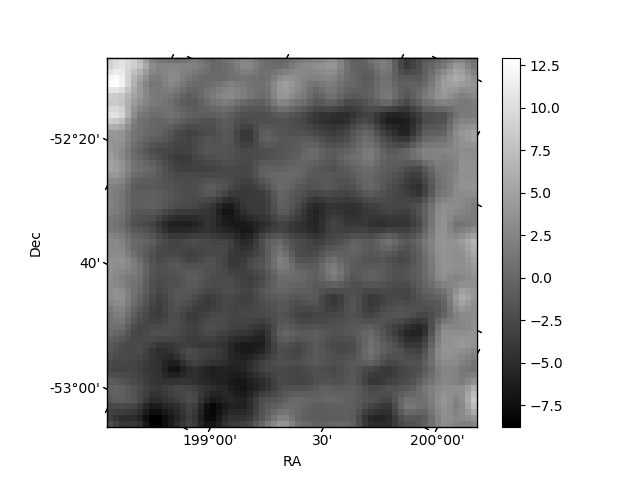
Histogram calculated using DETX and DETY for each event in the final _common_clean file
| Quadrant A | 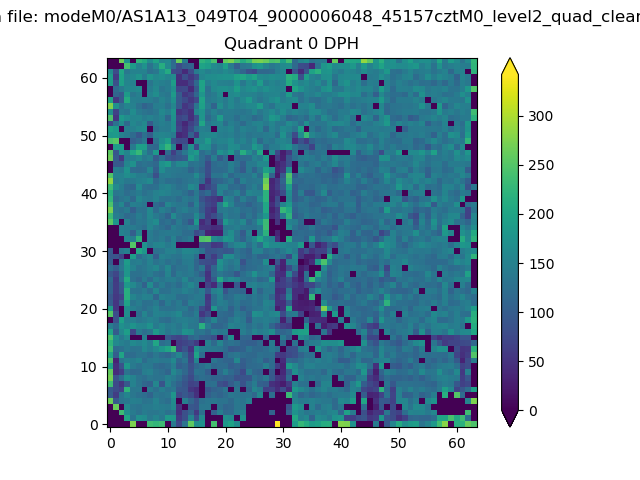 |
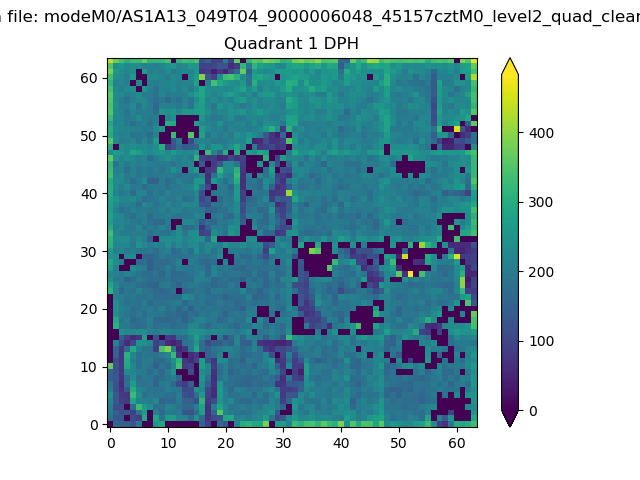 |
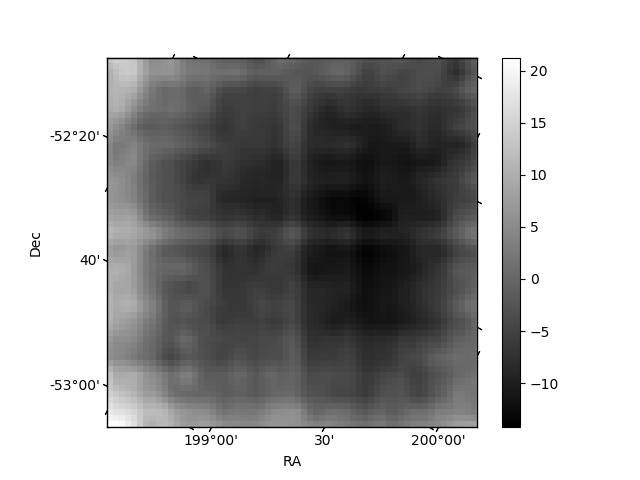
Quadrant B |
|---|---|---|---|
| Quadrant D | 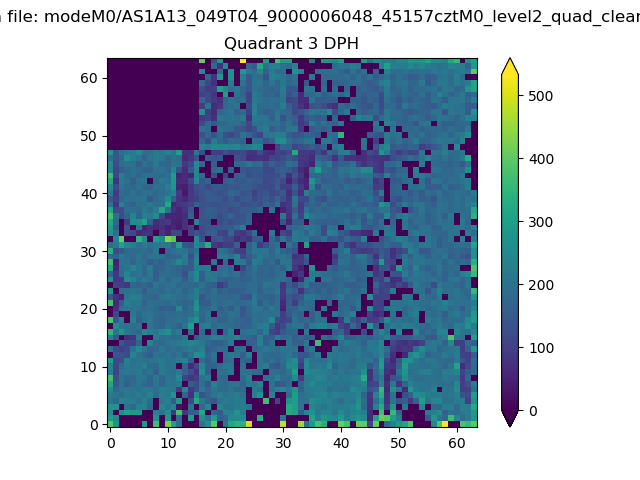 |
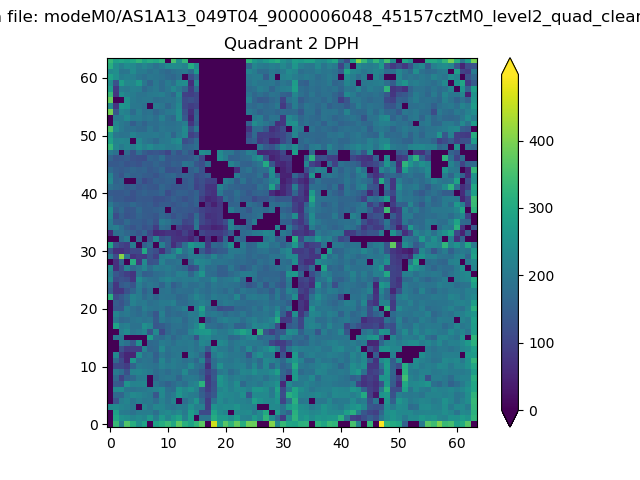 |
Quadrant C |
| Plot type | Count rate plots | Images |
|---|---|---|
| Comparison with Poisson distribution Blue bars denote a histogram of data divided into 1 sec bins. Red curve is a Poisson curve with rate = median count rate of data. |
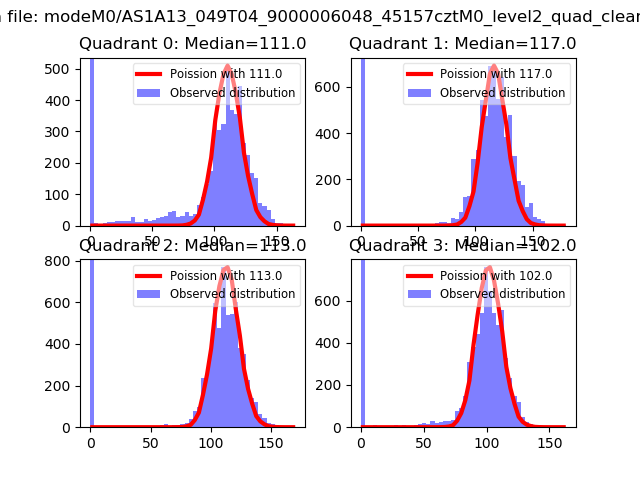 |
 |
| Quadrant-wise count rates Data is divided into 100 sec bins |
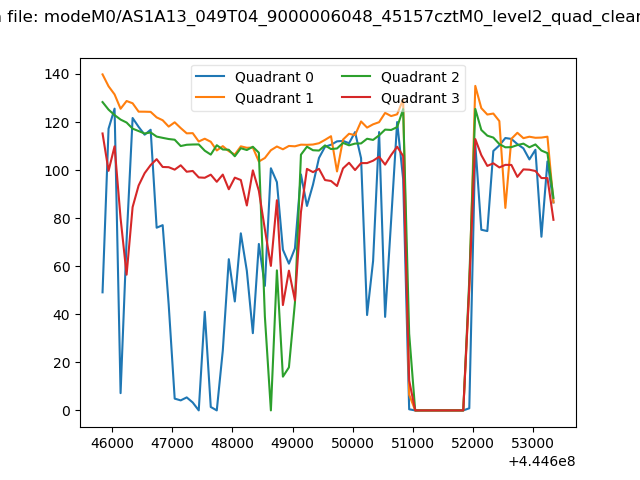 |
|
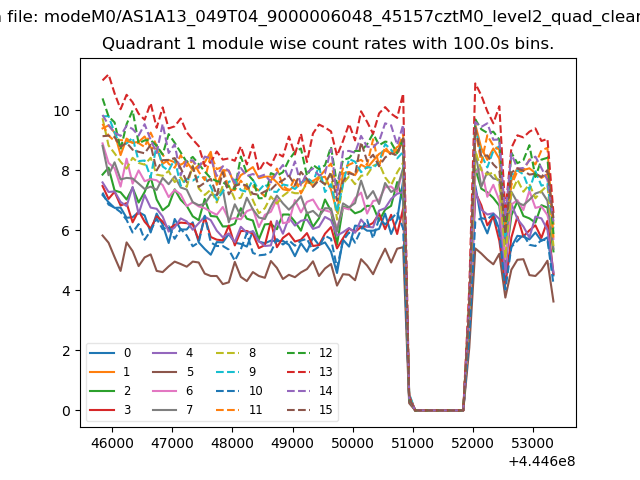
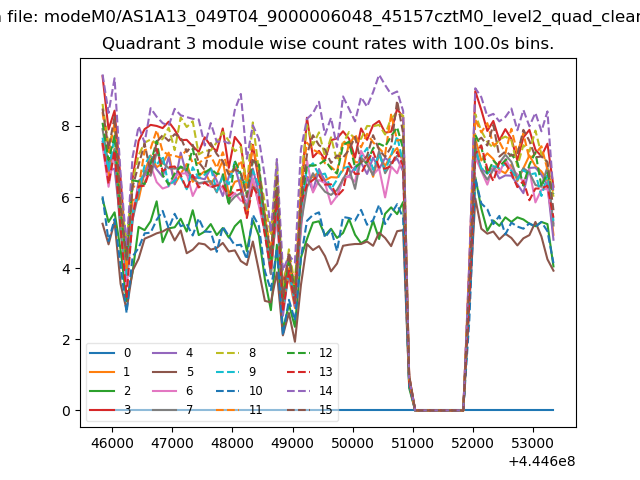
| Module-wise count rates for Quadrant A Data is divided into 100 sec bins |
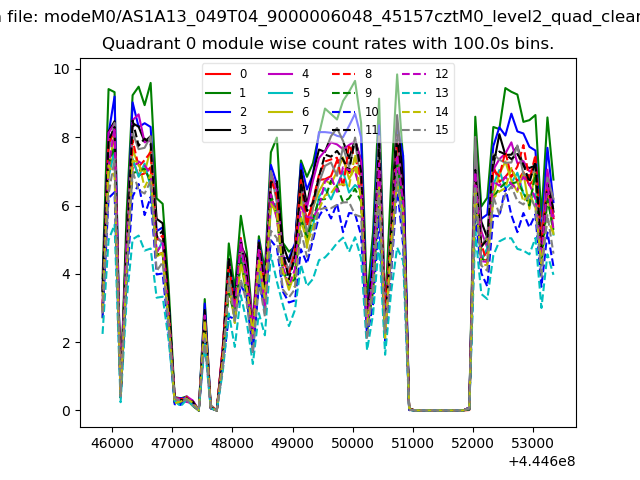 |
 |
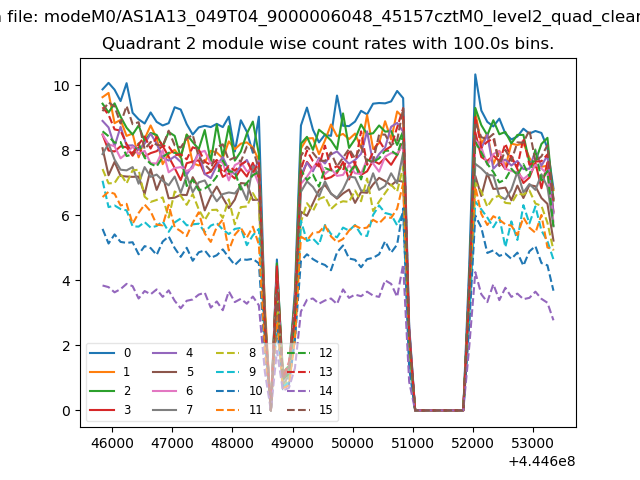
| Module-wise count rates for Quadrant B Data is divided into 100 sec bins |
 |
 |
| Module-wise count rates for Quadrant C Data is divided into 100 sec bins |
 |
 |
| Module-wise count rates for Quadrant D Data is divided into 100 sec bins |
 |
 |
| Parameter | Plot |
|---|---|
| CZT HV Monitor |  |
| D_VDD | 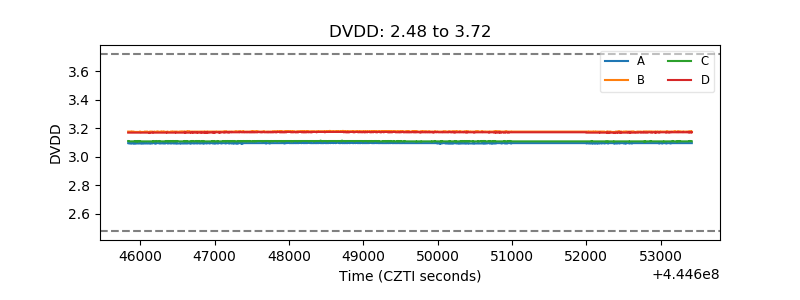 |
| Temperature 1 | 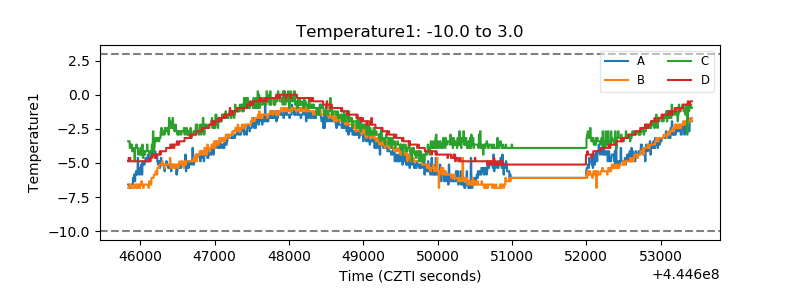 |
| Veto HV Monitor | 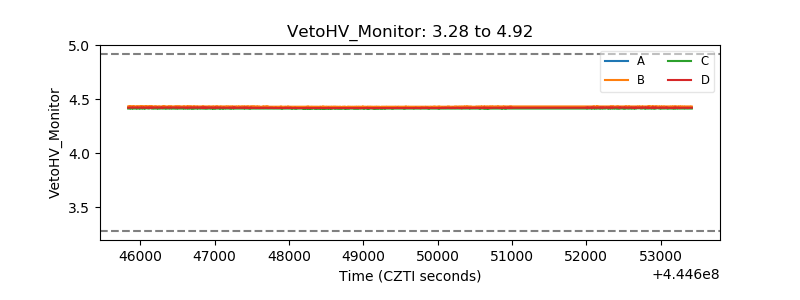 |
| Veto LLD | 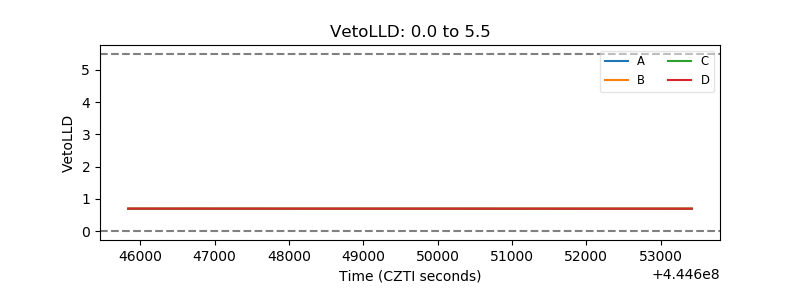 |
| Alpha Counter | 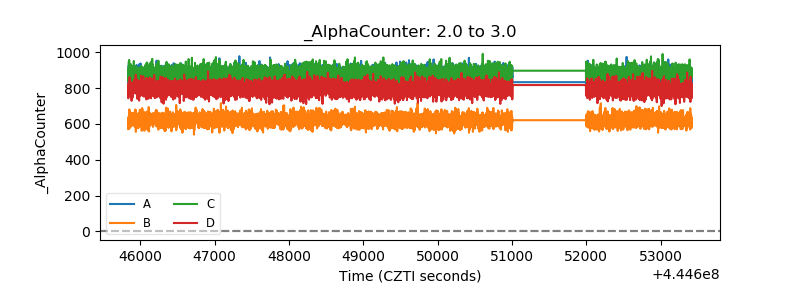 |
| _CPM_Rate | 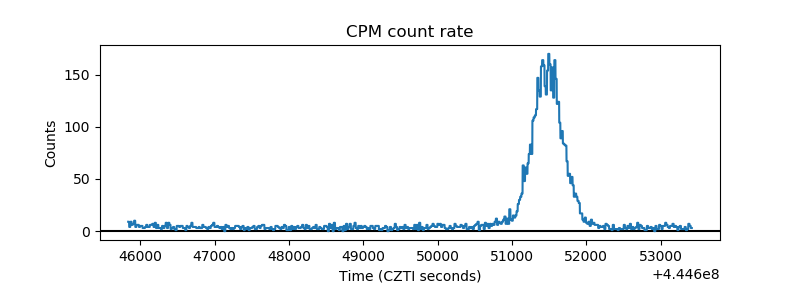 |
| CZT Counter | 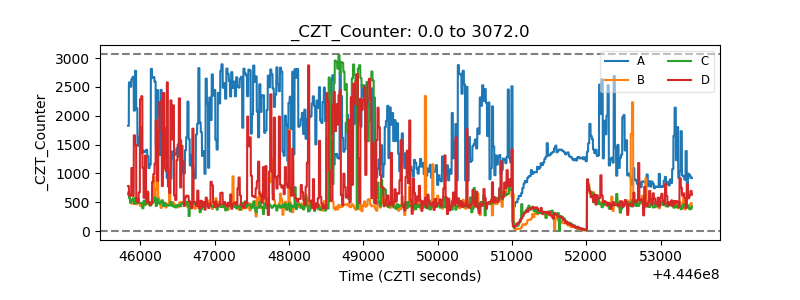 |
| +2.5 Volts monitor | 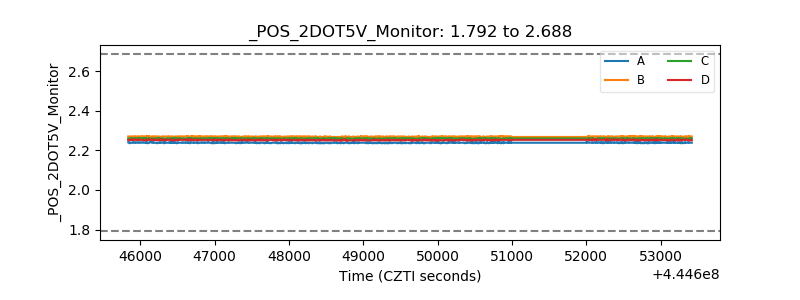 |
| +5 Volts monitor | 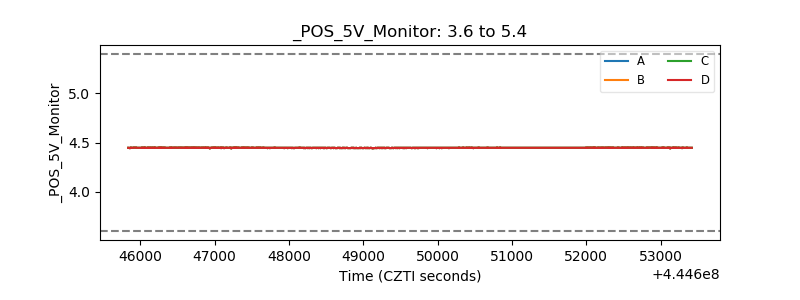 |
| _ROLL_ROT | 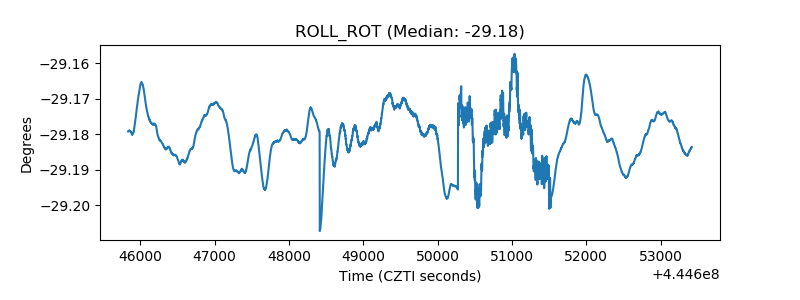 |
| _Roll_DEC | 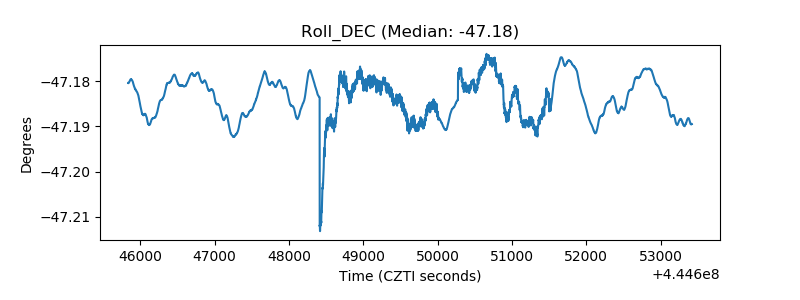 |
| _Roll_RA | 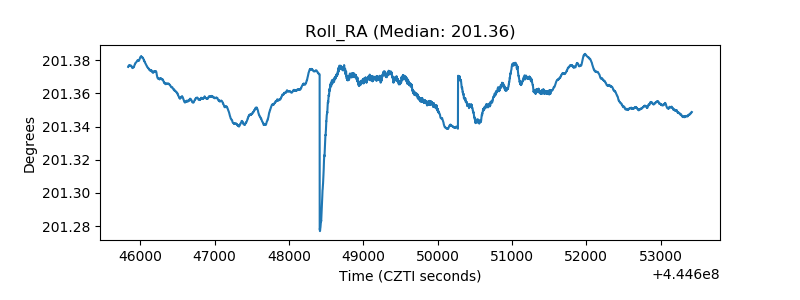 |
| Veto Counter | 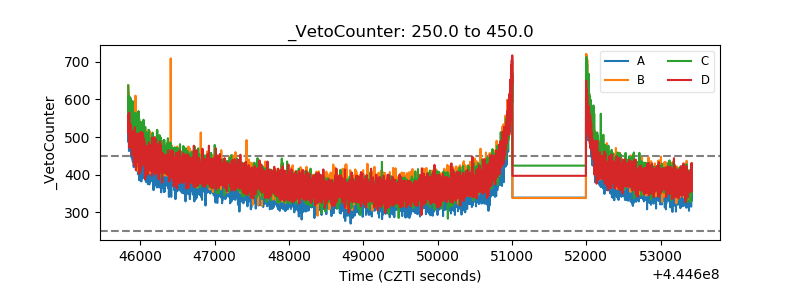 |