| Param | Original file | Final file |
|---|---|---|
| Filename | modeM0/AS1A13_049T04_9000006048_45158cztM0_level2.fits | modeM0/AS1A13_049T04_9000006048_45158cztM0_level2_quad_clean.evt |
| Size (bytes) | 637,793,280 | 108,365,760 |
| Size | 608.2 MB | 103.3 MB |
| Events in quadrant A | 9,732,878 | 611,267 |
| Events in quadrant B | 3,778,079 | 778,202 |
| Events in quadrant C | 3,745,857 | 744,182 |
| Events in quadrant D | 5,800,040 | 651,740 |
| Mode M9 | |||
|---|---|---|---|
| Quadrant | BADHDUFLAG | Total packets | Discarded packets |
| A | 0 | 6 | 0 |
| B | 0 | 6 | 0 |
| C | 0 | 6 | 0 |
| D | 0 | 6 | 0 |
| Mode M0 | |||
|---|---|---|---|
| Quadrant | BADHDUFLAG | Total packets | Discarded packets |
| A | 0 | 33758 | 3 |
| B | 0 | 15914 | 2 |
| C | 0 | 16209 | 2 |
| D | 0 | 22050 | 2 |
| Mode SS | |||
|---|---|---|---|
| Quadrant | BADHDUFLAG | Total packets | Discarded packets |
| A | 0 | 146 | 0 |
| B | 0 | 146 | 0 |
| C | 0 | 146 | 0 |
| D | 0 | 146 | 0 |
| Quadrant | Total seconds | Saturated seconds | Saturation percentage |
|---|---|---|---|
| A | 7119 | 1728 | 24.273072% |
| B | 7119 | 301 | 4.228122% |
| C | 7120 | 352 | 4.943820% |
| D | 7120 | 707 | 9.929775% |
Noise dominated data is calculated using 1-second bins in cleaned event files. If a bin has >2000 counts, and if more than 50% of those come from <1% of pixels, then it is considered to be noise-dominated and hence unusable.
| Quadrant | # 1 sec bins | Bins with >0 counts | Bins with >2000 counts | High rate bins dominated by noise | Noise dominated (total time) | Noise dominated (detector-on time) | Marked lightcurve |
|---|---|---|---|---|---|---|---|
| A | 7689 | 7119 | 1202 | 1202 | 15.63% | 16.88% | 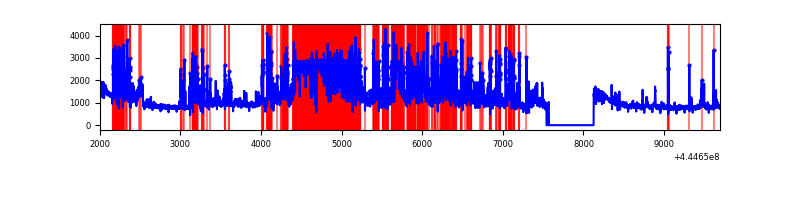 |
| B | 7689 | 7120 | 56 | 56 | 0.73% | 0.79% | 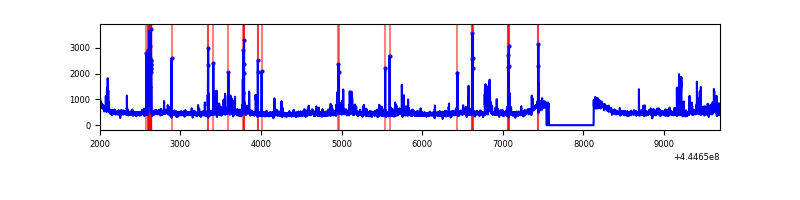 |
| C | 7690 | 7121 | 162 | 162 | 2.11% | 2.27% | 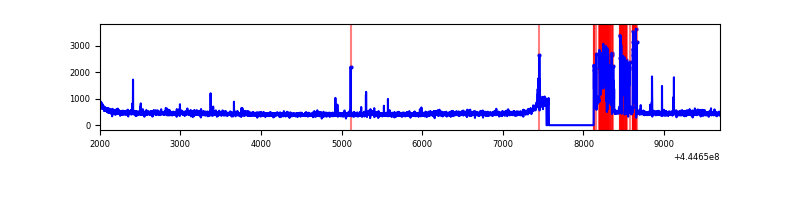 |
| D | 7690 | 7121 | 432 | 432 | 5.62% | 6.07% | 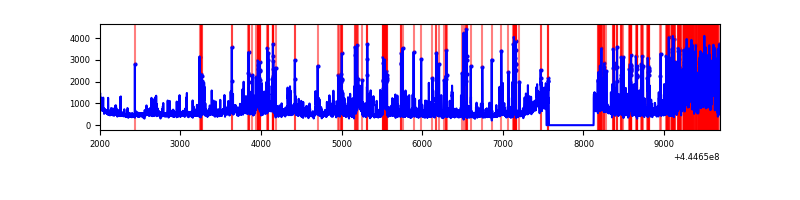 |
Top three noisy pixels from each quadrant. If the there are fewer than three noisy pixels in the level2.evt file, extra rows are filled as -1
| Pixel properties | Quadrant properties | ||||||
|---|---|---|---|---|---|---|---|
| Quadrant | DetID | PixID | Counts | Sigma | Mean | Median | Sigma |
| A | 15 | 223 | 4179953 | 26653.85 | 751 | 734 | 156.8 |
| A | 10 | 83 | 2444997 | 15588.8 | 751 | 734 | 156.8 |
| A | 2 | 79 | 97485 | 617.05 | 751 | 734 | 156.8 |
| B | 5 | 172 | 239912 | 1453.08 | 825 | 799 | 164.6 |
| B | 4 | 170 | 59301 | 355.51 | 825 | 799 | 164.6 |
| B | 3 | 112 | 53904 | 322.72 | 825 | 799 | 164.6 |
| C | 1 | 3 | 506206 | 2647.38 | 812 | 816 | 190.9 |
| C | 2 | 14 | 22681 | 114.53 | 812 | 816 | 190.9 |
| C | 12 | 250 | 11590 | 56.43 | 812 | 816 | 190.9 |
| D | 1 | 52 | 1272899 | 6281.36 | 797 | 772 | 202.5 |
| D | 13 | 249 | 596579 | 2941.91 | 797 | 772 | 202.5 |
| D | 5 | 235 | 180268 | 886.29 | 797 | 772 | 202.5 |
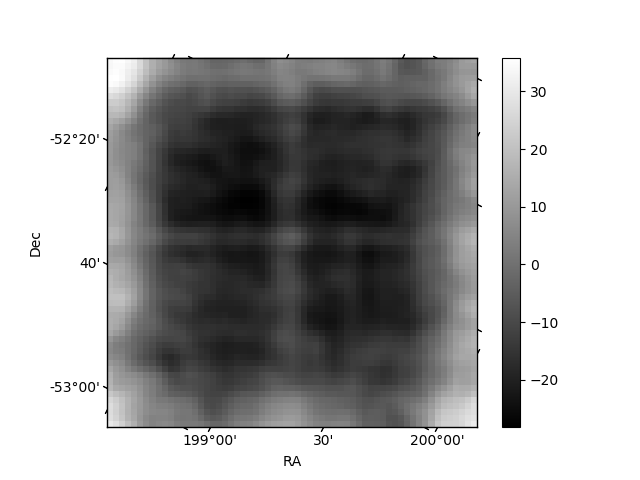
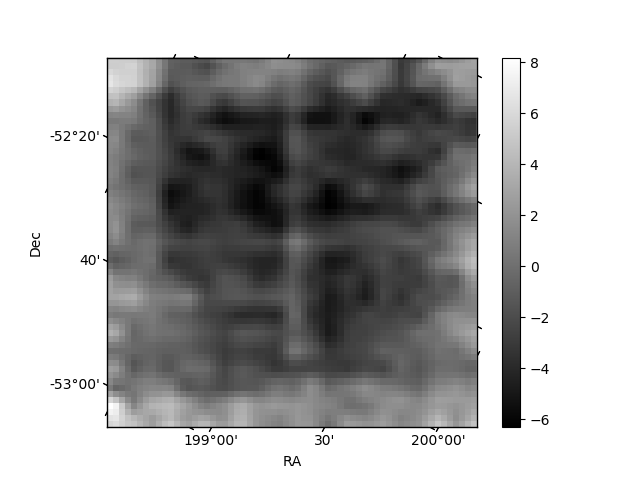
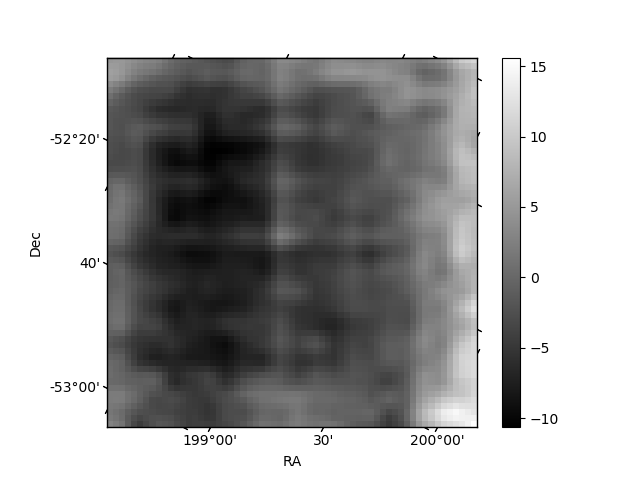
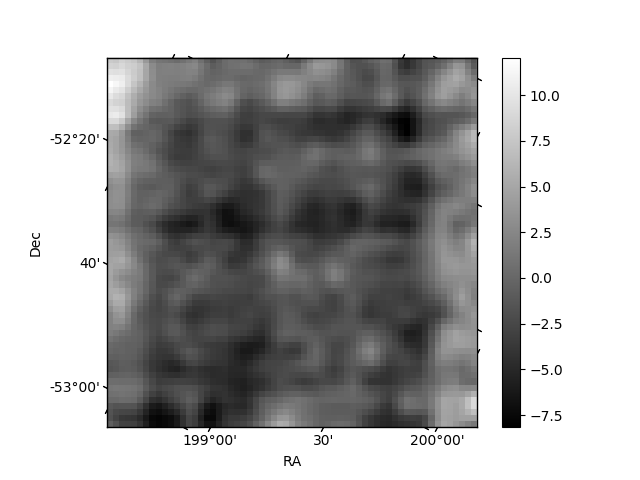
Histogram calculated using DETX and DETY for each event in the final _common_clean file
| Quadrant A | 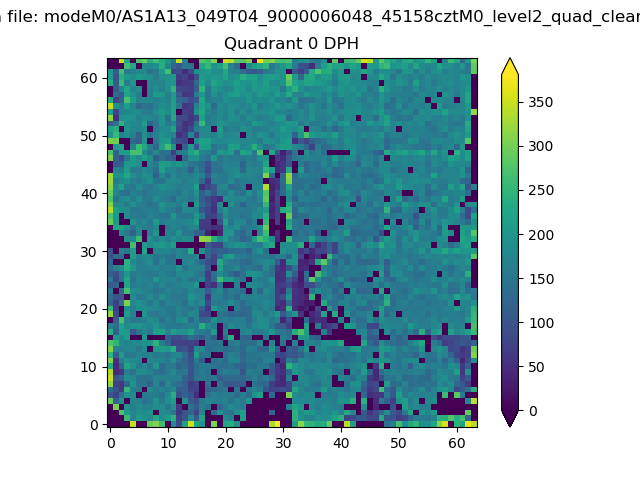 |
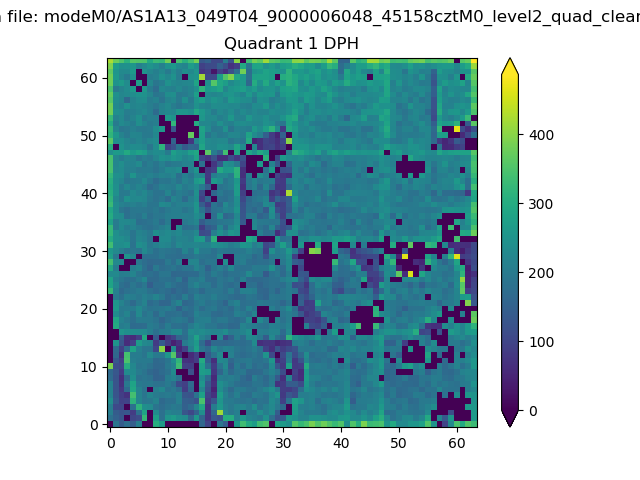 |
Quadrant B |
|---|---|---|---|
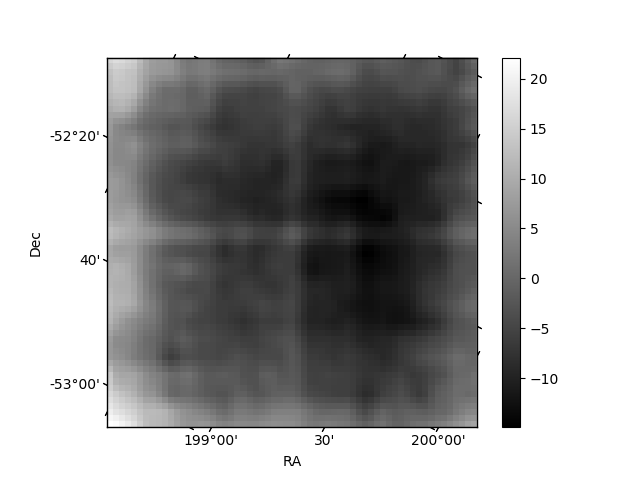
| Quadrant D | 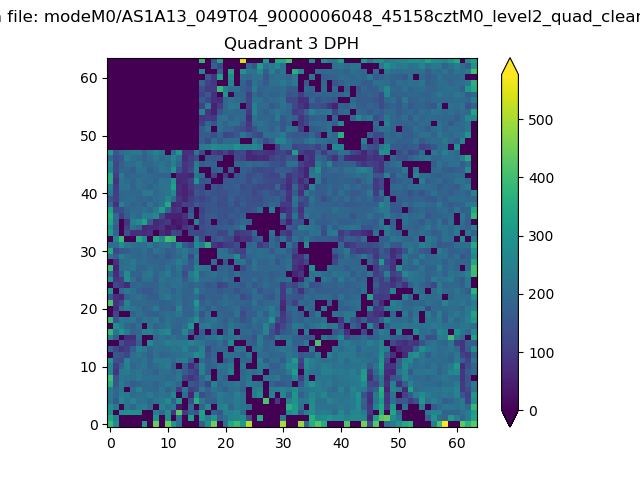 |
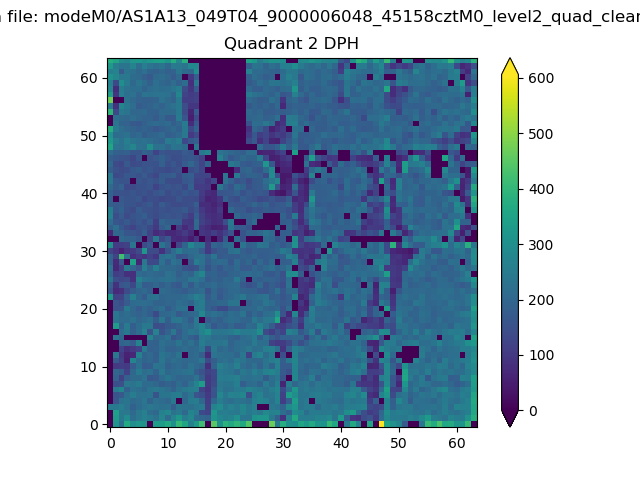 |
Quadrant C |
| Plot type | Count rate plots | Images |
|---|---|---|
| Comparison with Poisson distribution Blue bars denote a histogram of data divided into 1 sec bins. Red curve is a Poisson curve with rate = median count rate of data. |
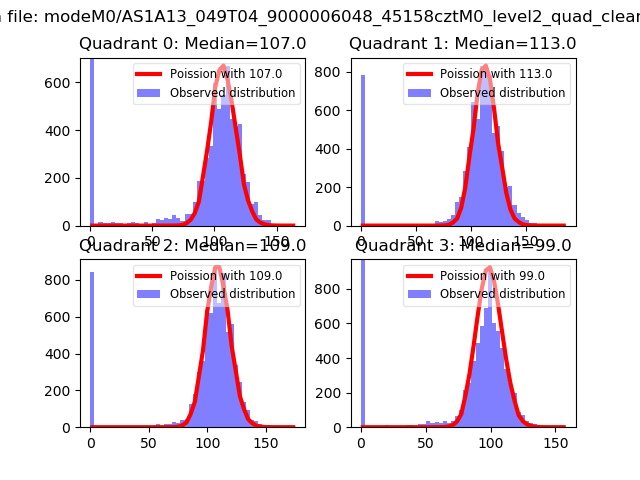 |
 |
| Quadrant-wise count rates Data is divided into 100 sec bins |
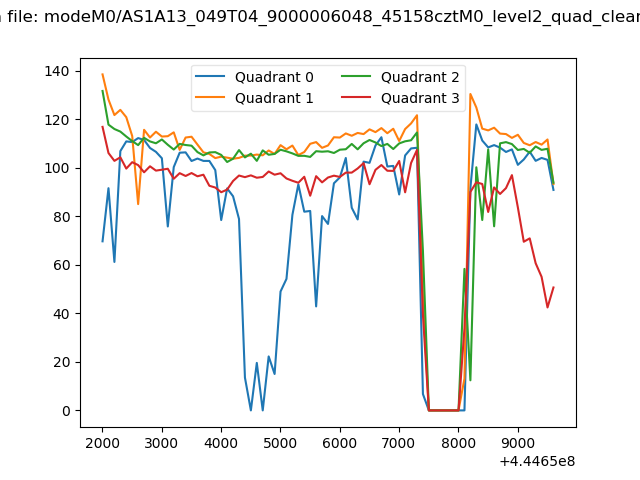 |
|
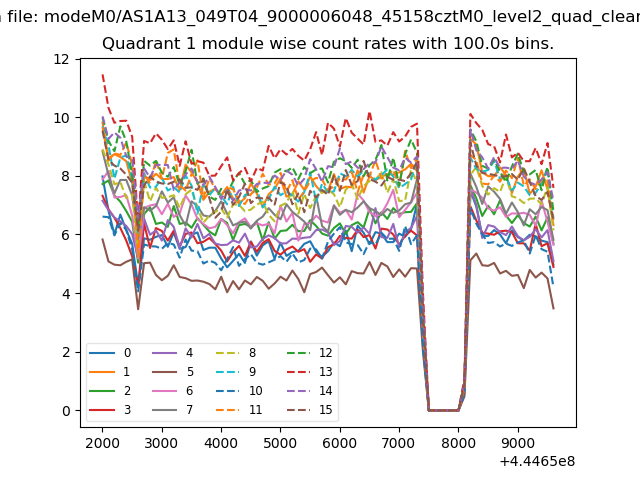
| Module-wise count rates for Quadrant A Data is divided into 100 sec bins |
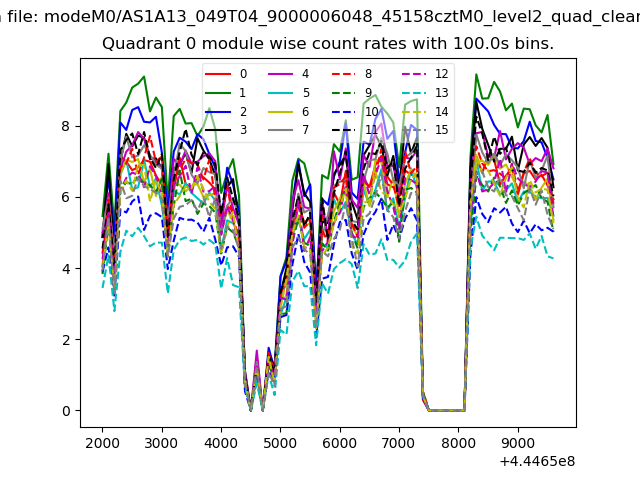 |
 |
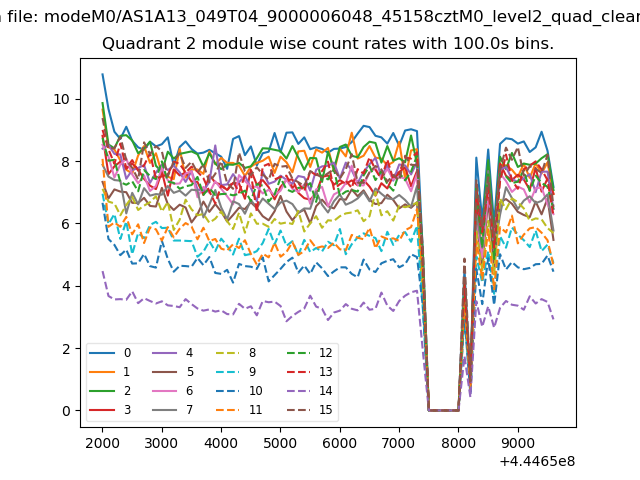
| Module-wise count rates for Quadrant B Data is divided into 100 sec bins |
 |
 |
| Module-wise count rates for Quadrant C Data is divided into 100 sec bins |
 |
 |
| Module-wise count rates for Quadrant D Data is divided into 100 sec bins |
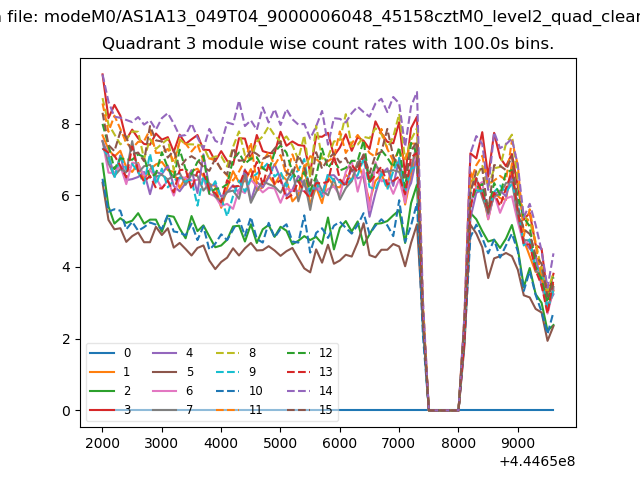 |
 |
| Parameter | Plot |
|---|---|
| CZT HV Monitor | 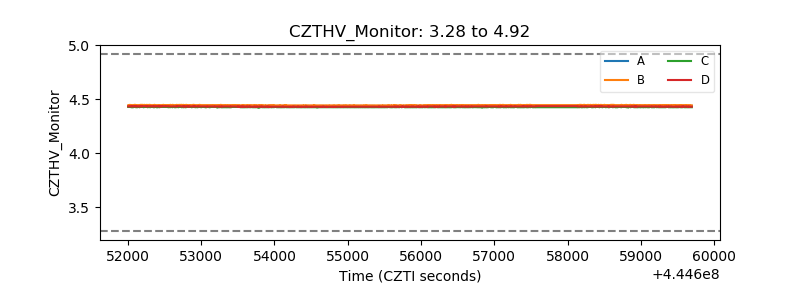 |
| D_VDD | 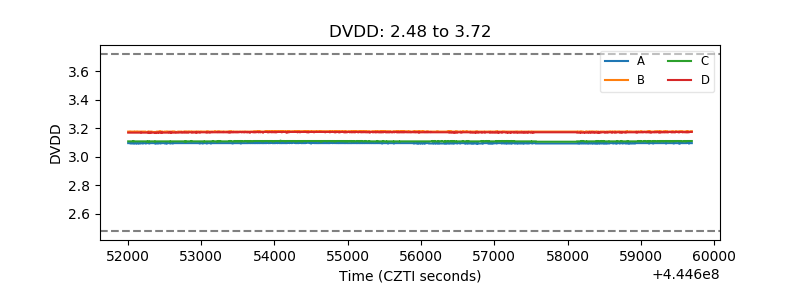 |
| Temperature 1 | 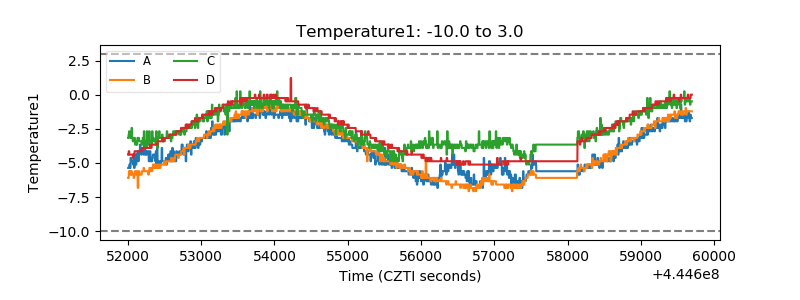 |
| Veto HV Monitor | 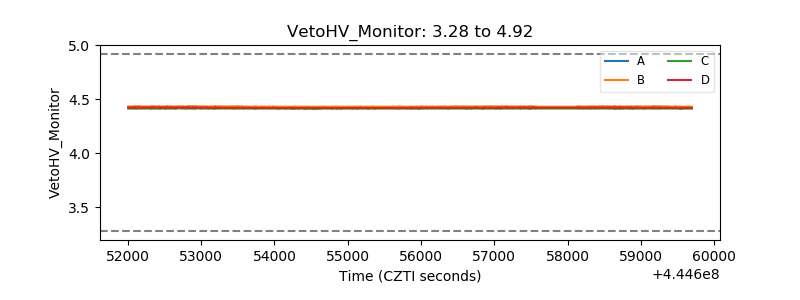 |
| Veto LLD | 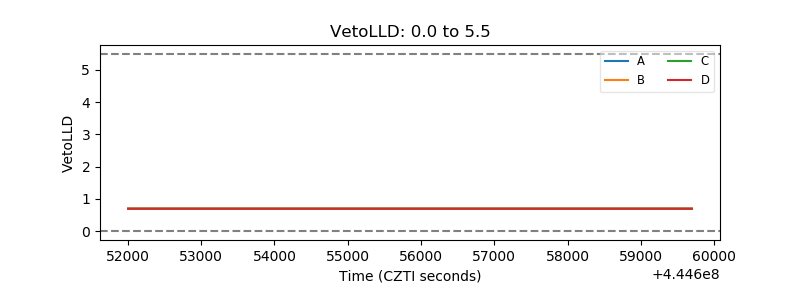 |
| Alpha Counter | 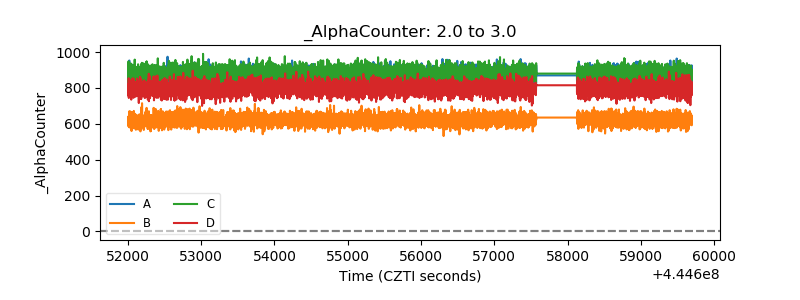 |
| _CPM_Rate | 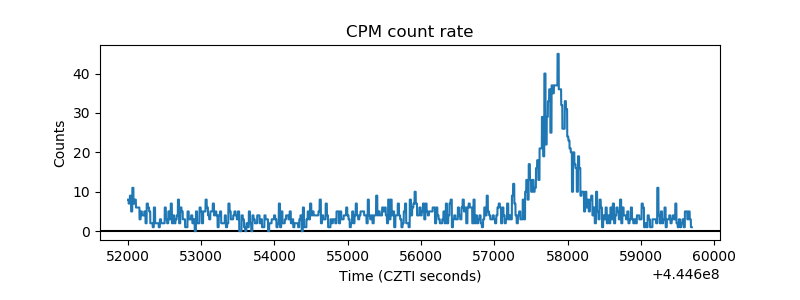 |
| CZT Counter | 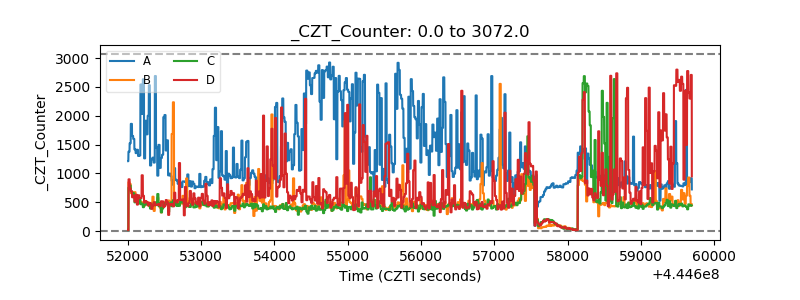 |
| +2.5 Volts monitor | 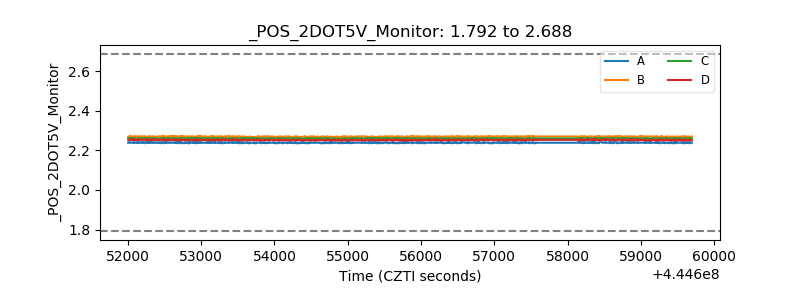 |
| +5 Volts monitor | 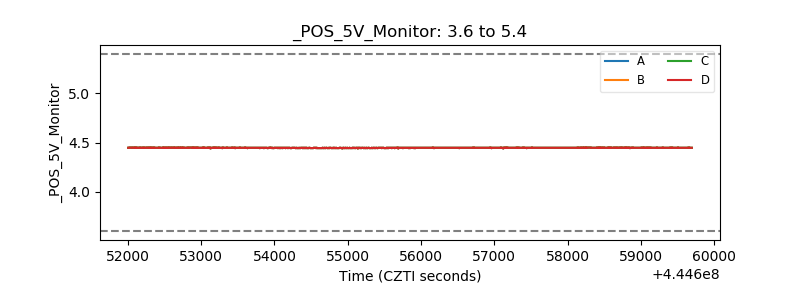 |
| _ROLL_ROT | 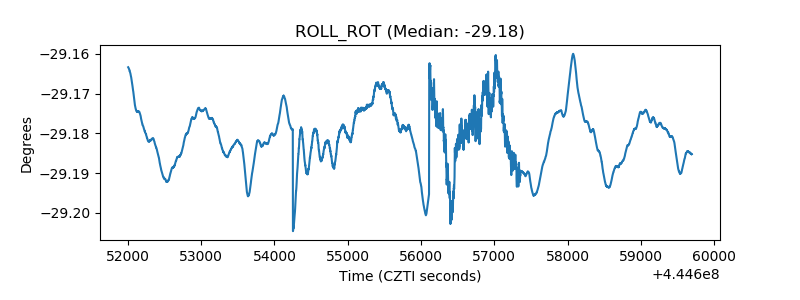 |
| _Roll_DEC | 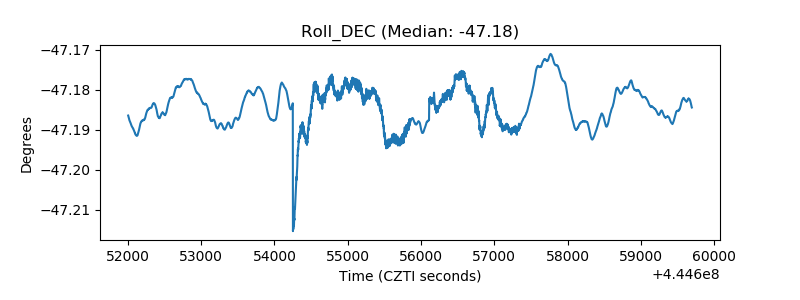 |
| _Roll_RA | 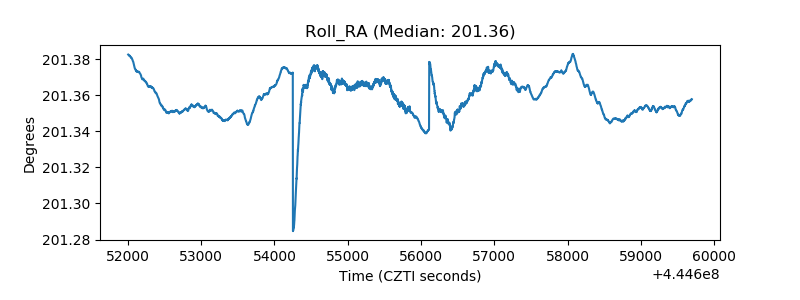 |
| Veto Counter | 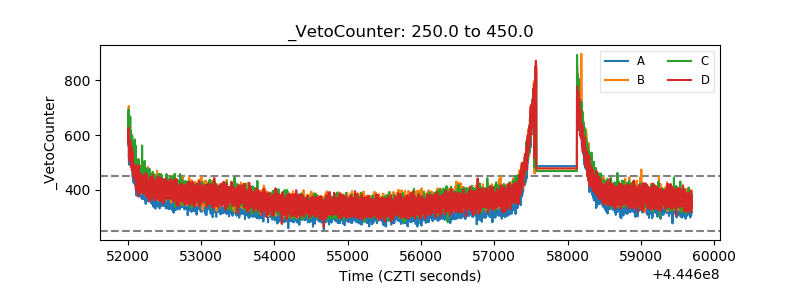 |