| Param | Original file | Final file |
|---|---|---|
| Filename | modeM0/AS1A13_049T04_9000006048_45159cztM0_level2.fits | modeM0/AS1A13_049T04_9000006048_45159cztM0_level2_quad_clean.evt |
| Size (bytes) | 692,732,160 | 122,114,880 |
| Size | 660.6 MB | 116.5 MB |
| Events in quadrant A | 9,028,562 | 756,953 |
| Events in quadrant B | 4,360,097 | 842,795 |
| Events in quadrant C | 4,094,415 | 850,292 |
| Events in quadrant D | 7,536,432 | 688,375 |
| Mode M0 | |||
|---|---|---|---|
| Quadrant | BADHDUFLAG | Total packets | Discarded packets |
| A | 0 | 32365 | 0 |
| B | 0 | 18370 | 0 |
| C | 0 | 18023 | 0 |
| D | 0 | 27943 | 0 |
| Mode SS | |||
|---|---|---|---|
| Quadrant | BADHDUFLAG | Total packets | Discarded packets |
| A | 0 | 160 | 0 |
| B | 0 | 160 | 0 |
| C | 0 | 160 | 0 |
| D | 0 | 160 | 0 |
| Quadrant | Total seconds | Saturated seconds | Saturation percentage |
|---|---|---|---|
| A | 8040 | 1192 | 14.825871% |
| B | 8040 | 481 | 5.982587% |
| C | 8041 | 268 | 3.332919% |
| D | 8041 | 1212 | 15.072752% |
Noise dominated data is calculated using 1-second bins in cleaned event files. If a bin has >2000 counts, and if more than 50% of those come from <1% of pixels, then it is considered to be noise-dominated and hence unusable.
| Quadrant | # 1 sec bins | Bins with >0 counts | Bins with >2000 counts | High rate bins dominated by noise | Noise dominated (total time) | Noise dominated (detector-on time) | Marked lightcurve |
|---|---|---|---|---|---|---|---|
| A | 8040 | 8040 | 594 | 594 | 7.39% | 7.39% | 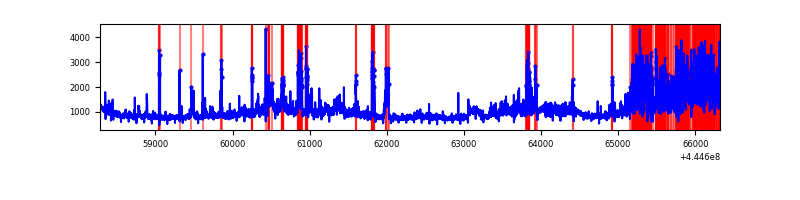 |
| B | 8040 | 8040 | 87 | 87 | 1.08% | 1.08% | 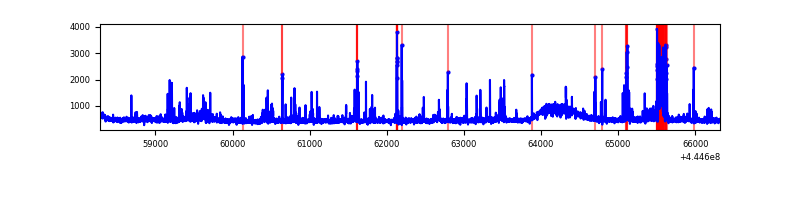 |
| C | 8041 | 8041 | 92 | 92 | 1.14% | 1.14% | 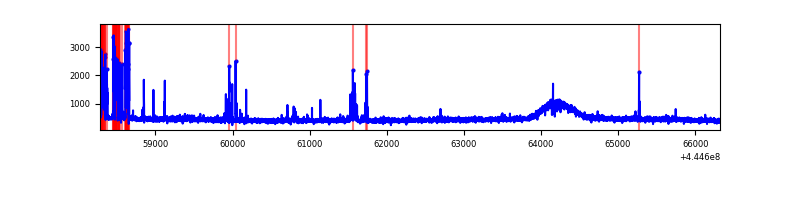 |
| D | 8041 | 8041 | 801 | 801 | 9.96% | 9.96% | 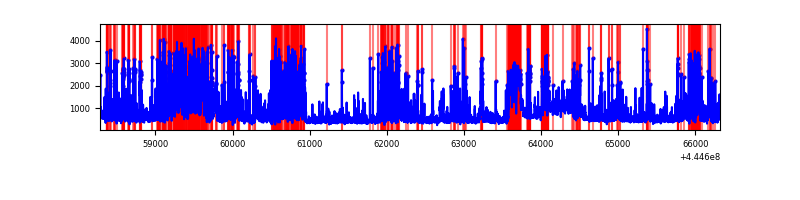 |
Top three noisy pixels from each quadrant. If the there are fewer than three noisy pixels in the level2.evt file, extra rows are filled as -1
| Pixel properties | Quadrant properties | ||||||
|---|---|---|---|---|---|---|---|
| Quadrant | DetID | PixID | Counts | Sigma | Mean | Median | Sigma |
| A | 10 | 83 | 2685660 | 14087.26 | 915 | 892 | 190.6 |
| A | 15 | 223 | 2474416 | 12978.84 | 915 | 892 | 190.6 |
| A | 13 | 248 | 201877 | 1054.59 | 915 | 892 | 190.6 |
| B | 5 | 172 | 359435 | 1893.22 | 940 | 912 | 189.4 |
| B | 4 | 170 | 95021 | 496.95 | 940 | 912 | 189.4 |
| B | 0 | 183 | 52330 | 271.52 | 940 | 912 | 189.4 |
| C | 1 | 3 | 316625 | 1416.39 | 939 | 942 | 222.9 |
| C | 14 | 254 | 49025 | 215.74 | 939 | 942 | 222.9 |
| C | 12 | 2 | 37981 | 166.18 | 939 | 942 | 222.9 |
| D | 1 | 52 | 1603366 | 7075.57 | 898 | 869 | 226.5 |
| D | 13 | 249 | 1088428 | 4801.95 | 898 | 869 | 226.5 |
| D | 5 | 235 | 662284 | 2920.37 | 898 | 869 | 226.5 |
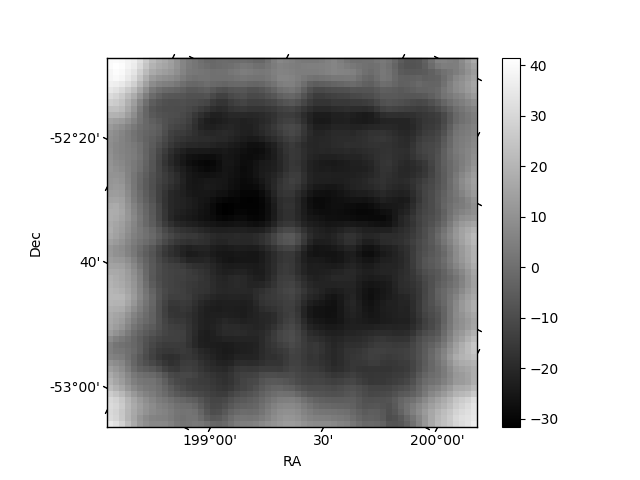
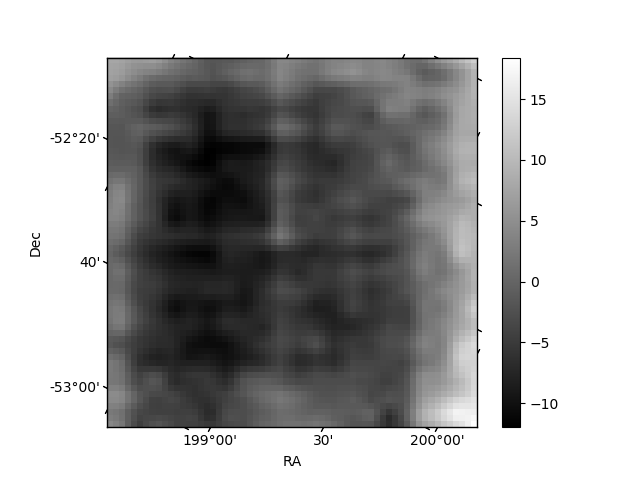
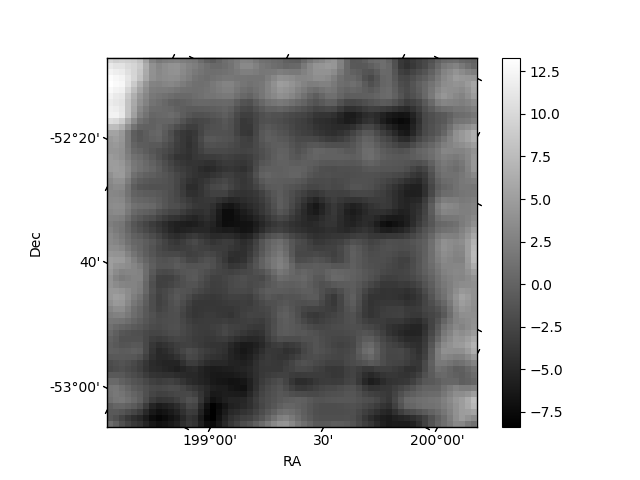
Histogram calculated using DETX and DETY for each event in the final _common_clean file
| Quadrant A | 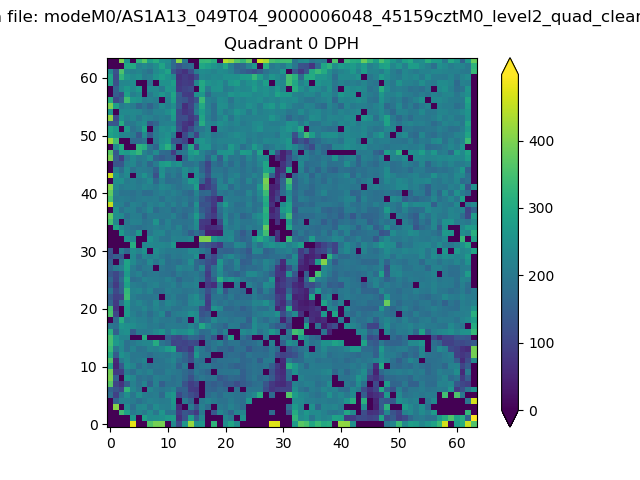 |
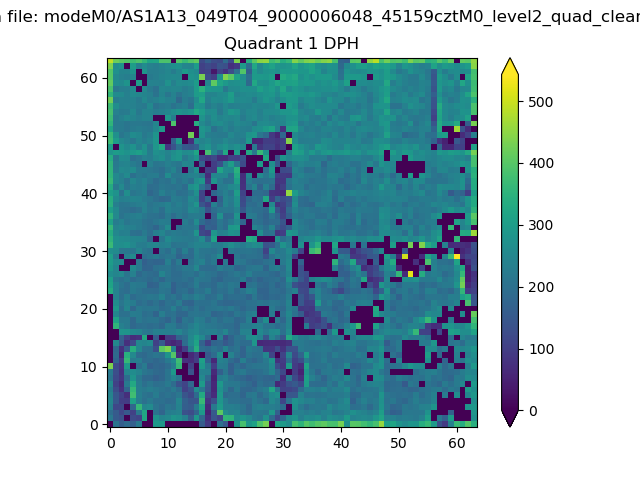 |
Quadrant B |
|---|---|---|---|
| Quadrant D | 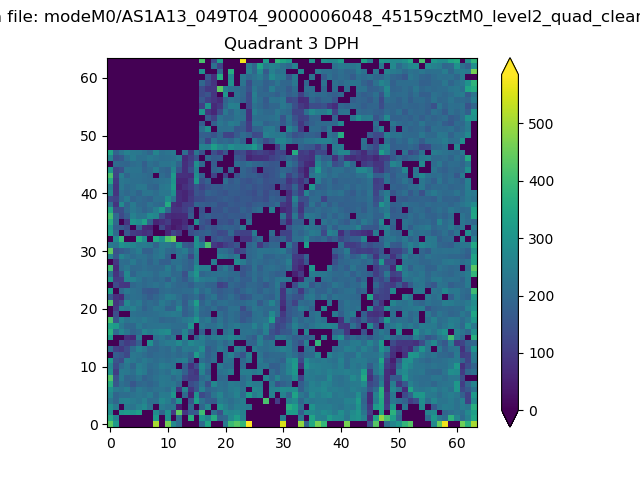 |
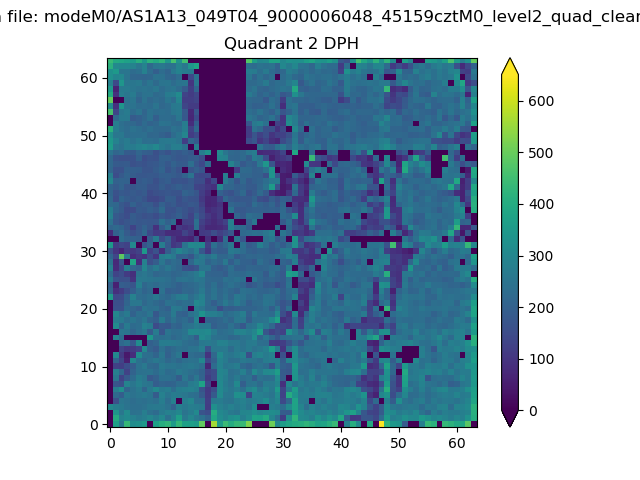 |
Quadrant C |
| Plot type | Count rate plots | Images |
|---|---|---|
| Comparison with Poisson distribution Blue bars denote a histogram of data divided into 1 sec bins. Red curve is a Poisson curve with rate = median count rate of data. |
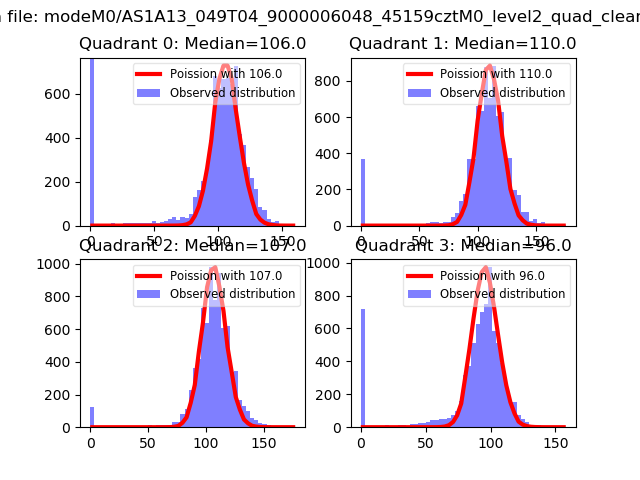 |
 |
| Quadrant-wise count rates Data is divided into 100 sec bins |
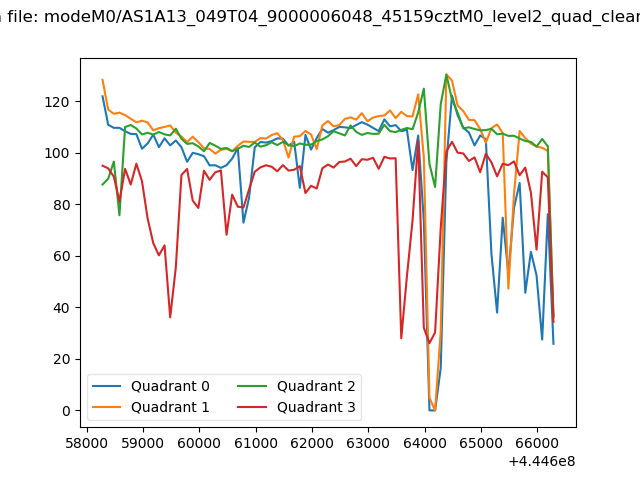 |
|
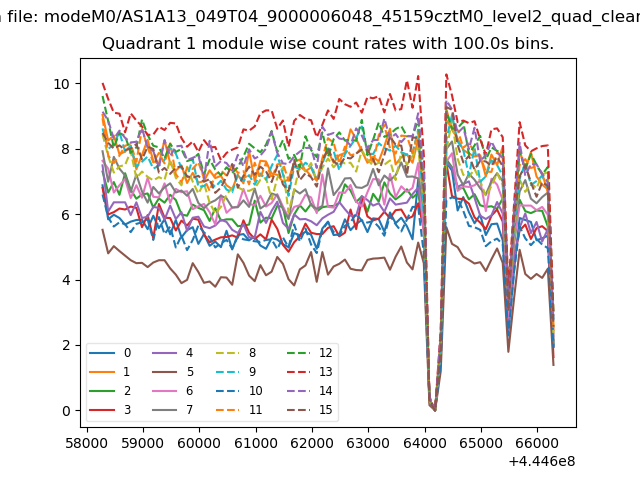
| Module-wise count rates for Quadrant A Data is divided into 100 sec bins |
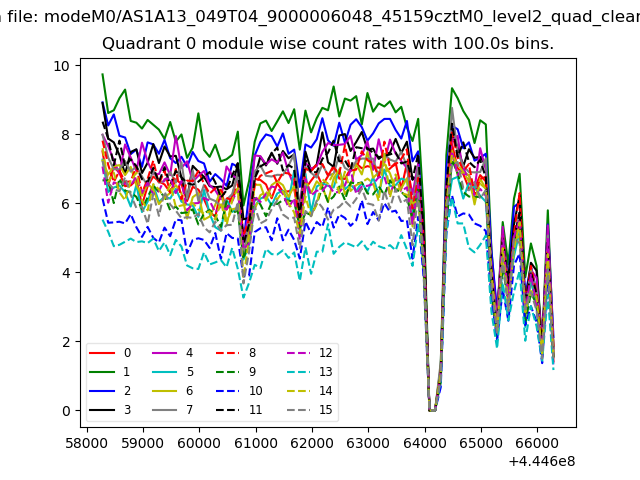 |
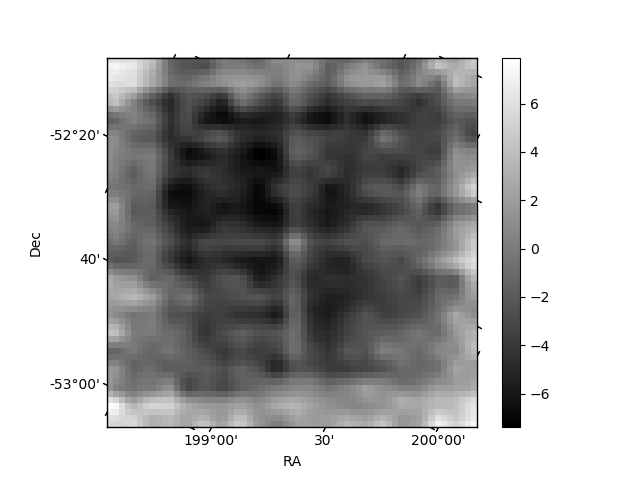 |
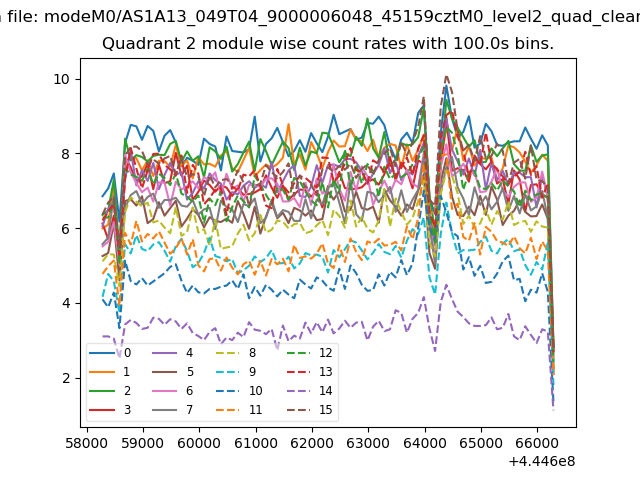
| Module-wise count rates for Quadrant B Data is divided into 100 sec bins |
 |
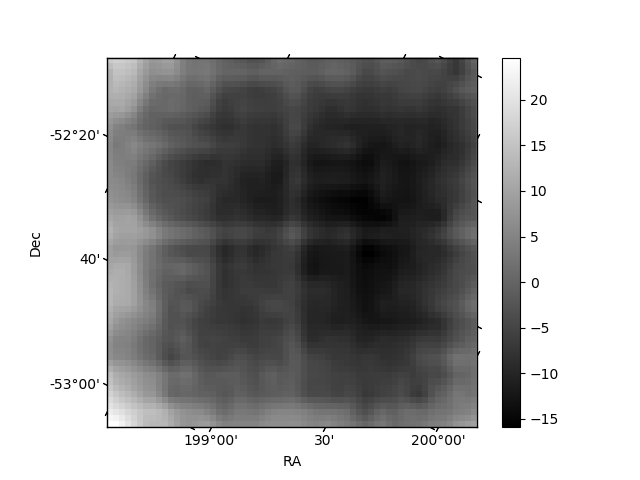 |
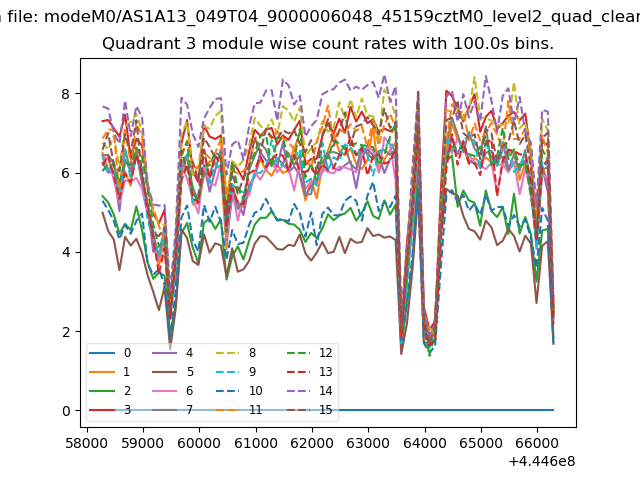
| Module-wise count rates for Quadrant C Data is divided into 100 sec bins |
 |
 |
| Module-wise count rates for Quadrant D Data is divided into 100 sec bins |
 |
 |
| Parameter | Plot |
|---|---|
| CZT HV Monitor | 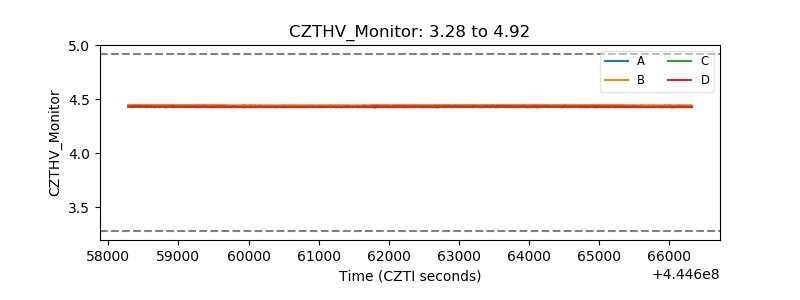 |
| D_VDD | 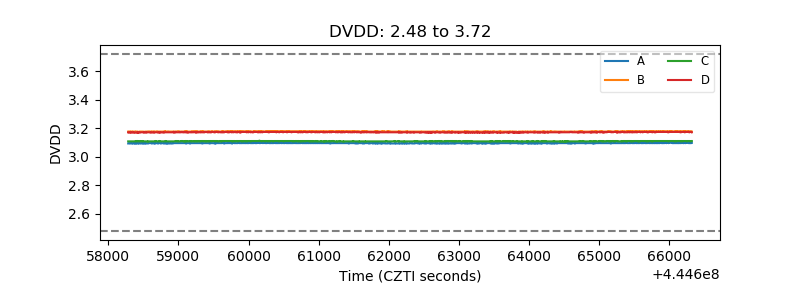 |
| Temperature 1 | 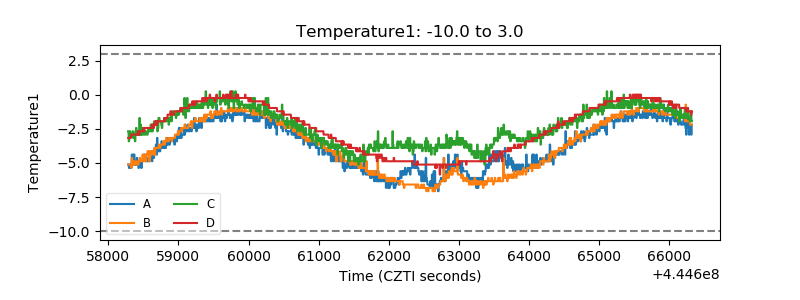 |
| Veto HV Monitor | 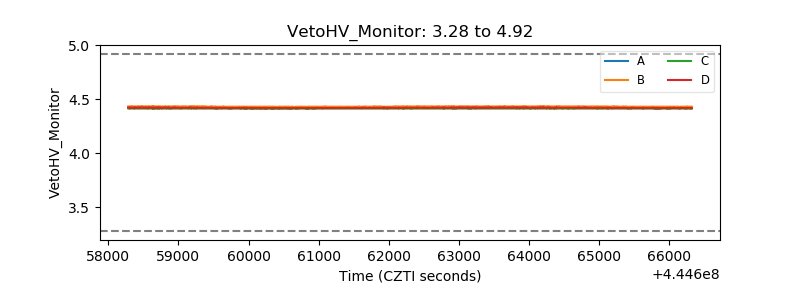 |
| Veto LLD | 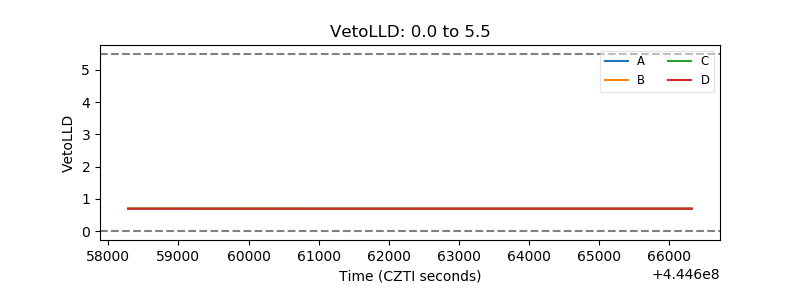 |
| Alpha Counter | 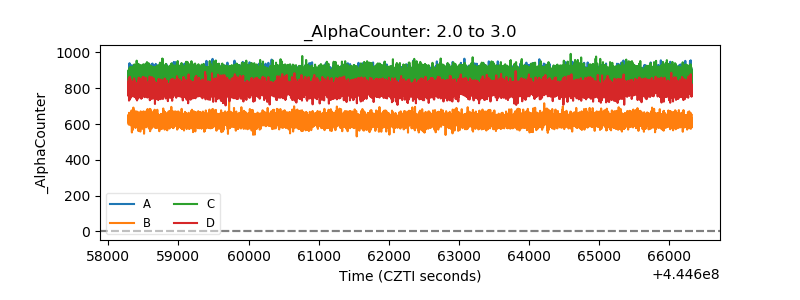 |
| _CPM_Rate | 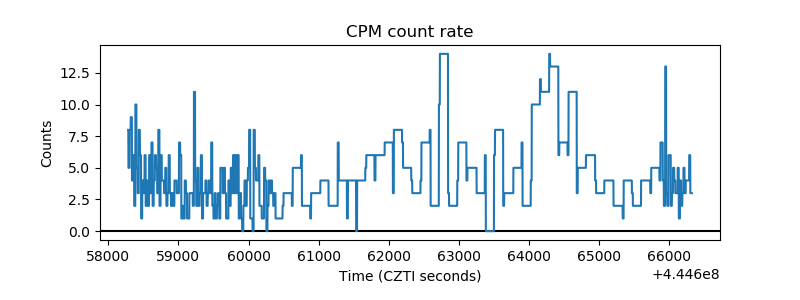 |
| CZT Counter | 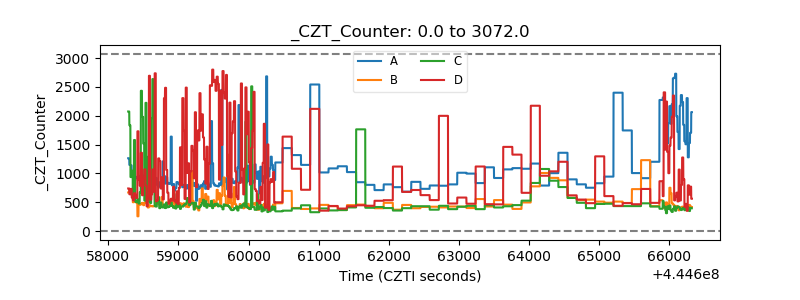 |
| +2.5 Volts monitor | 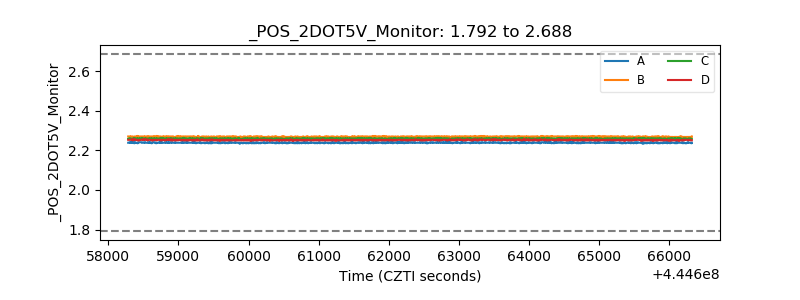 |
| +5 Volts monitor | 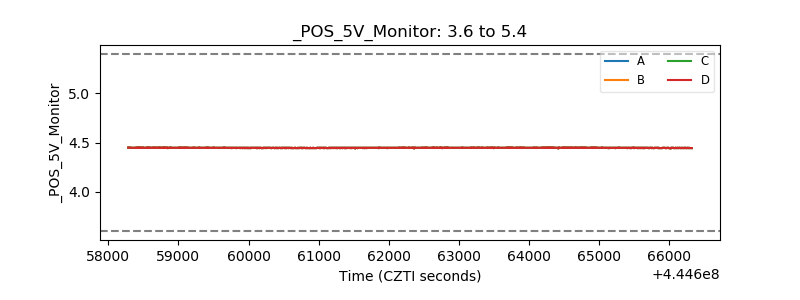 |
| _ROLL_ROT | 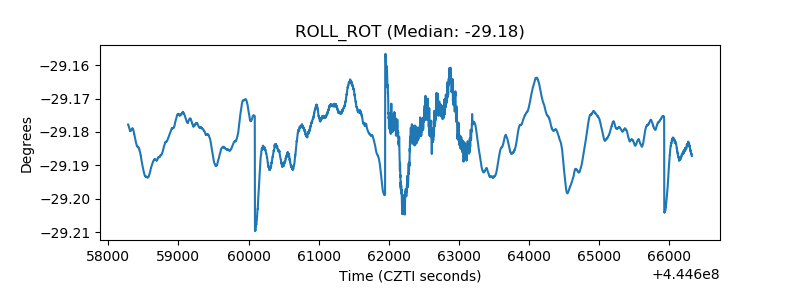 |
| _Roll_DEC | 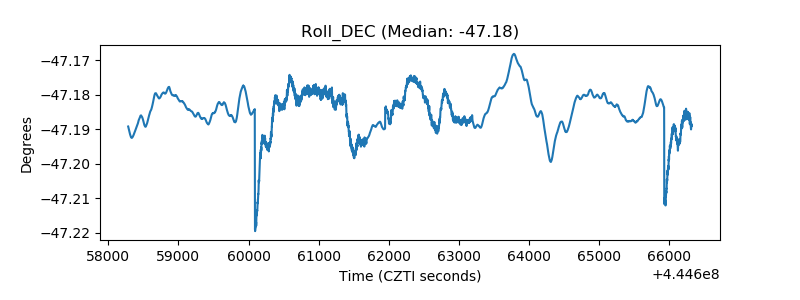 |
| _Roll_RA | 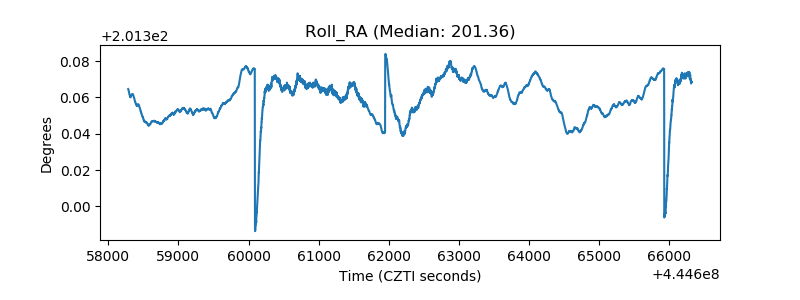 |
| Veto Counter | 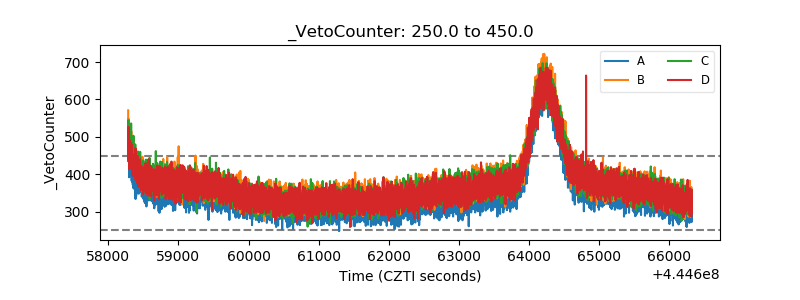 |