| Param | Original file | Final file |
|---|---|---|
| Filename | modeM0/AS1A13_049T04_9000006048_45160cztM0_level2.fits | modeM0/AS1A13_049T04_9000006048_45160cztM0_level2_quad_clean.evt |
| Size (bytes) | 733,124,160 | 121,366,080 |
| Size | 699.2 MB | 115.7 MB |
| Events in quadrant A | 11,835,558 | 655,898 |
| Events in quadrant B | 4,432,425 | 870,139 |
| Events in quadrant C | 3,639,838 | 863,876 |
| Events in quadrant D | 6,606,034 | 724,439 |
| Mode M0 | |||
|---|---|---|---|
| Quadrant | BADHDUFLAG | Total packets | Discarded packets |
| A | 0 | 40695 | 0 |
| B | 0 | 18630 | 0 |
| C | 0 | 16708 | 0 |
| D | 0 | 25191 | 0 |
| Mode SS | |||
|---|---|---|---|
| Quadrant | BADHDUFLAG | Total packets | Discarded packets |
| A | 0 | 162 | 0 |
| B | 0 | 162 | 0 |
| C | 0 | 162 | 0 |
| D | 0 | 162 | 0 |
| Quadrant | Total seconds | Saturated seconds | Saturation percentage |
|---|---|---|---|
| A | 8054 | 2292 | 28.457909% |
| B | 8055 | 262 | 3.252638% |
| C | 8055 | 8 | 0.099317% |
| D | 8055 | 804 | 9.981378% |
Noise dominated data is calculated using 1-second bins in cleaned event files. If a bin has >2000 counts, and if more than 50% of those come from <1% of pixels, then it is considered to be noise-dominated and hence unusable.
| Quadrant | # 1 sec bins | Bins with >0 counts | Bins with >2000 counts | High rate bins dominated by noise | Noise dominated (total time) | Noise dominated (detector-on time) | Marked lightcurve |
|---|---|---|---|---|---|---|---|
| A | 8054 | 8054 | 1511 | 1511 | 18.76% | 18.76% | 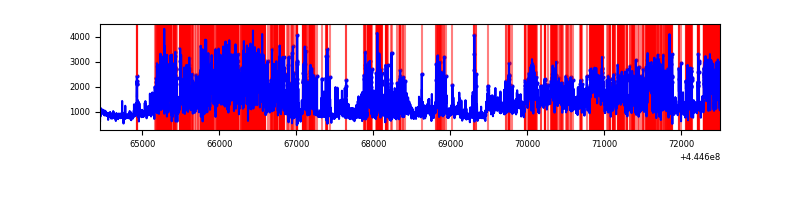 |
| B | 8055 | 8055 | 105 | 105 | 1.30% | 1.30% | 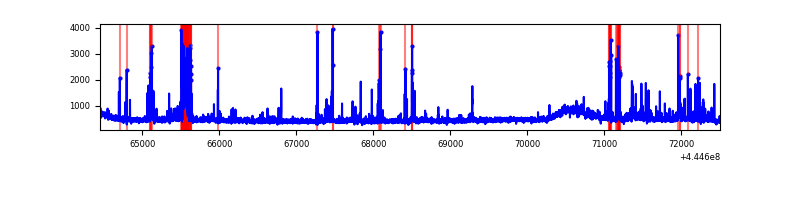 |
| C | 8055 | 8055 | 1 | 1 | 0.01% | 0.01% | 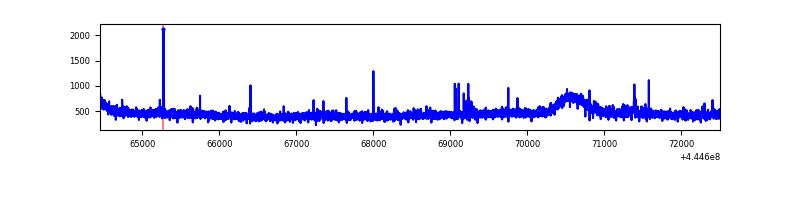 |
| D | 8054 | 8054 | 657 | 657 | 8.16% | 8.16% | 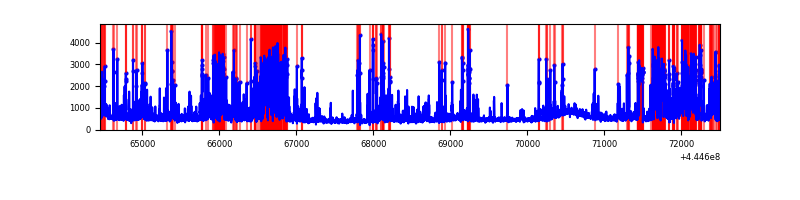 |
Top three noisy pixels from each quadrant. If the there are fewer than three noisy pixels in the level2.evt file, extra rows are filled as -1
| Pixel properties | Quadrant properties | ||||||
|---|---|---|---|---|---|---|---|
| Quadrant | DetID | PixID | Counts | Sigma | Mean | Median | Sigma |
| A | 15 | 223 | 5506877 | 30990.1 | 848 | 828 | 177.7 |
| A | 10 | 83 | 2600924 | 14634.31 | 848 | 828 | 177.7 |
| A | 13 | 248 | 279890 | 1570.67 | 848 | 828 | 177.7 |
| B | 5 | 172 | 406712 | 2195.77 | 922 | 891 | 184.8 |
| B | 0 | 155 | 66757 | 356.38 | 922 | 891 | 184.8 |
| B | 10 | 3 | 62264 | 332.07 | 922 | 891 | 184.8 |
| C | 3 | 233 | 18728 | 82.78 | 916 | 920 | 215.1 |
| C | 2 | 14 | 17069 | 75.07 | 916 | 920 | 215.1 |
| C | 12 | 250 | 11984 | 51.43 | 916 | 920 | 215.1 |
| D | 5 | 235 | 1210336 | 5433.01 | 879 | 850 | 222.6 |
| D | 13 | 249 | 832186 | 3734.36 | 879 | 850 | 222.6 |
| D | 1 | 52 | 275953 | 1235.76 | 879 | 850 | 222.6 |
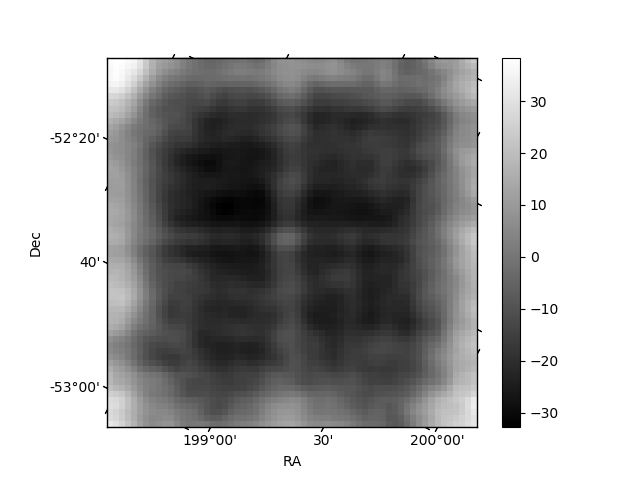
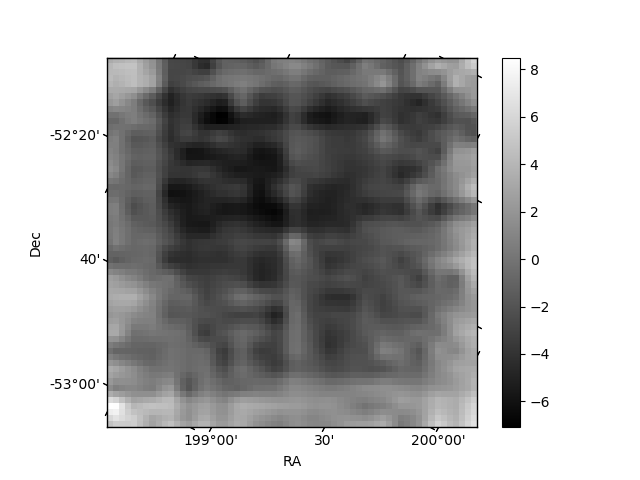
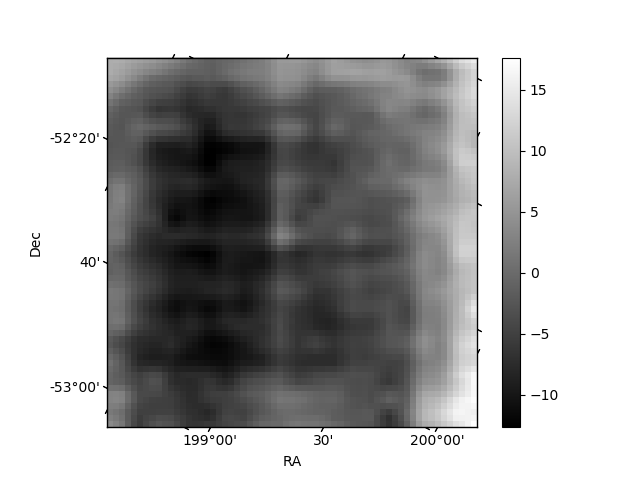
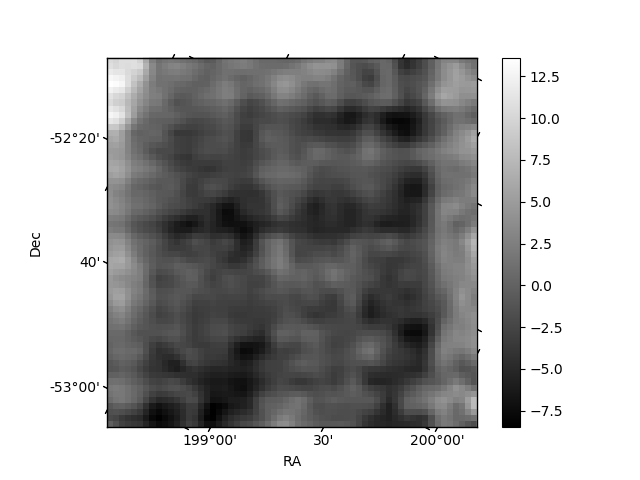
Histogram calculated using DETX and DETY for each event in the final _common_clean file
| Quadrant A | 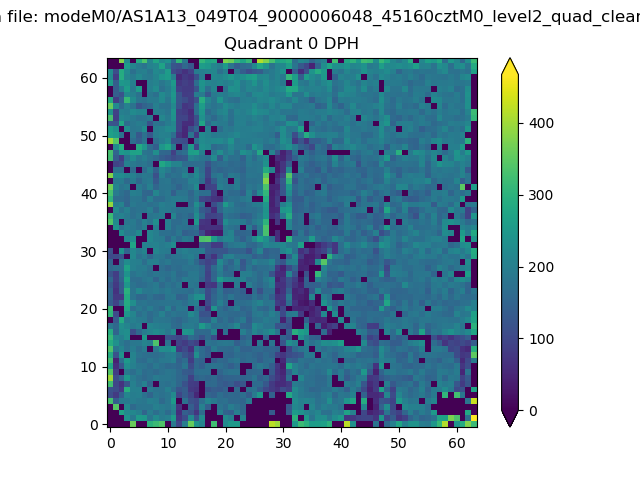 |
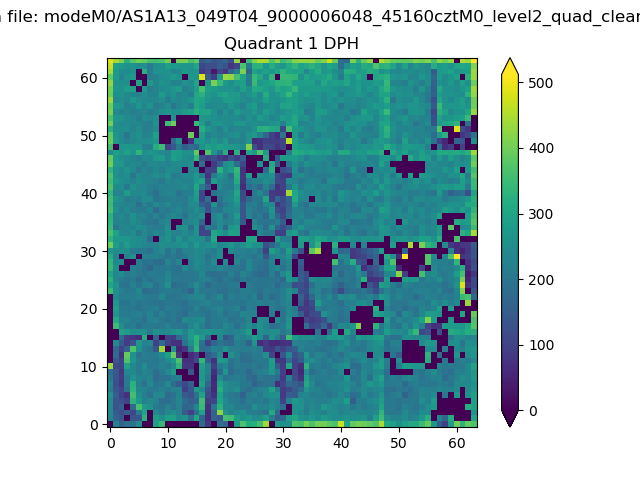 |
Quadrant B |
|---|---|---|---|
| Quadrant D | 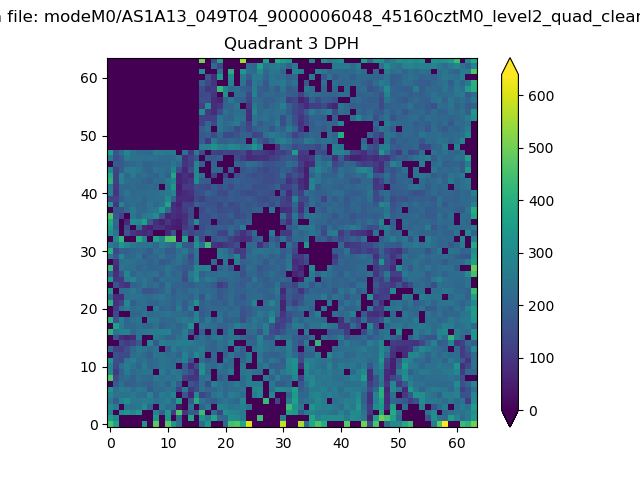 |
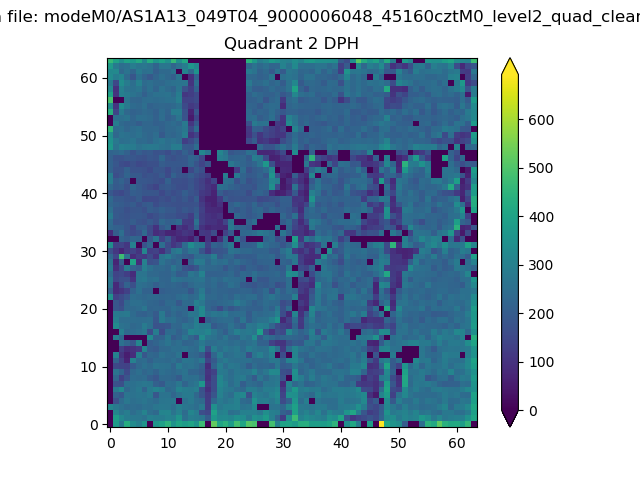 |
Quadrant C |
| Plot type | Count rate plots | Images |
|---|---|---|
| Comparison with Poisson distribution Blue bars denote a histogram of data divided into 1 sec bins. Red curve is a Poisson curve with rate = median count rate of data. |
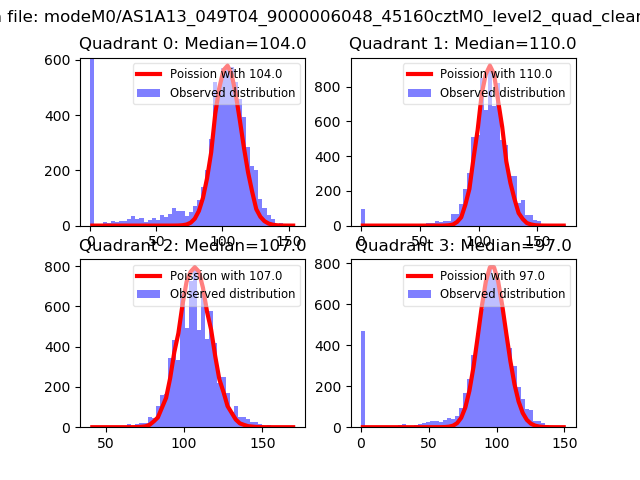 |
 |
| Quadrant-wise count rates Data is divided into 100 sec bins |
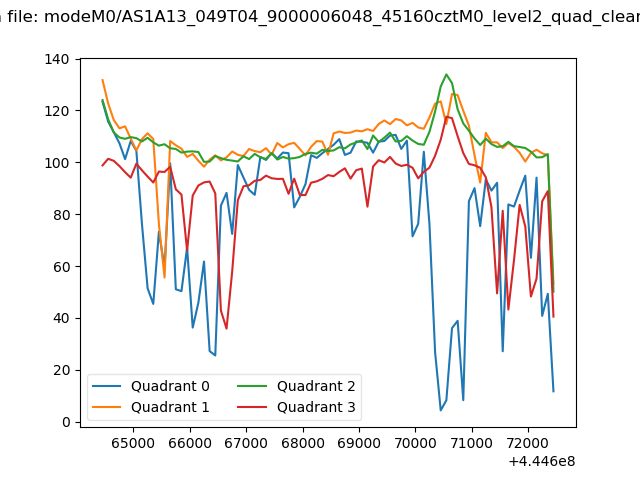 |
|
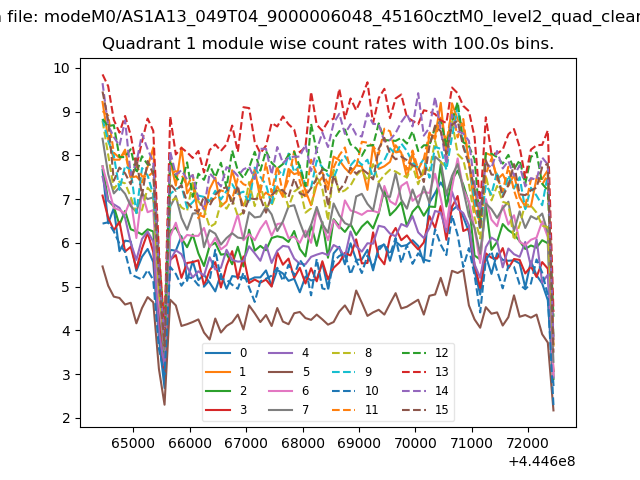
| Module-wise count rates for Quadrant A Data is divided into 100 sec bins |
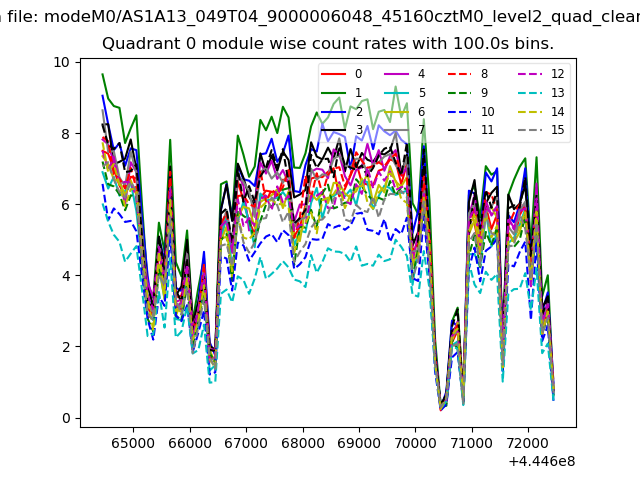 |
 |
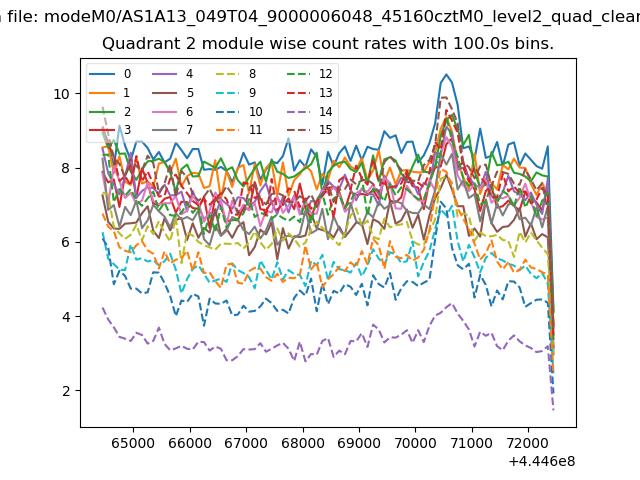
| Module-wise count rates for Quadrant B Data is divided into 100 sec bins |
 |
 |
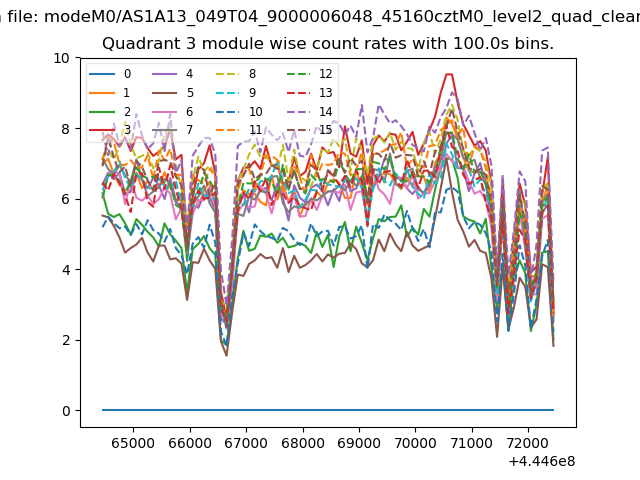
| Module-wise count rates for Quadrant C Data is divided into 100 sec bins |
 |
 |
| Module-wise count rates for Quadrant D Data is divided into 100 sec bins |
 |
 |
| Parameter | Plot |
|---|---|
| CZT HV Monitor | 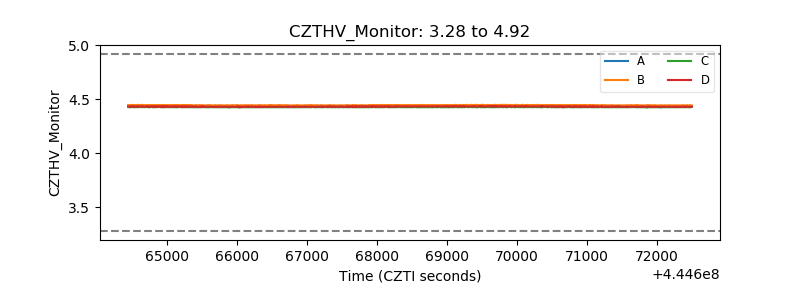 |
| D_VDD | 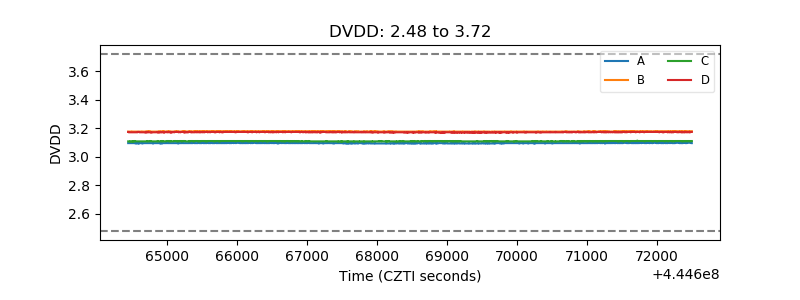 |
| Temperature 1 | 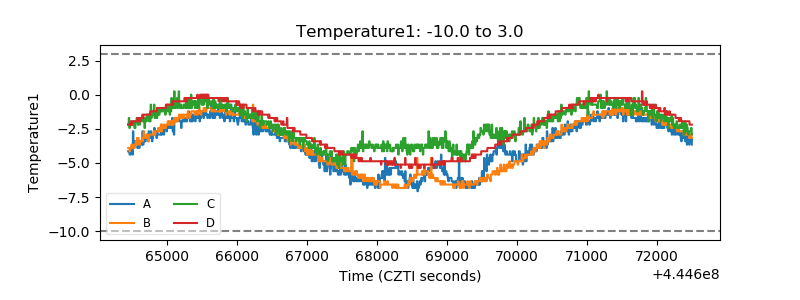 |
| Veto HV Monitor | 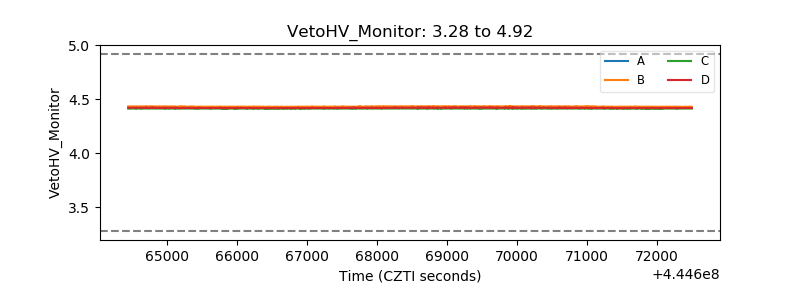 |
| Veto LLD | 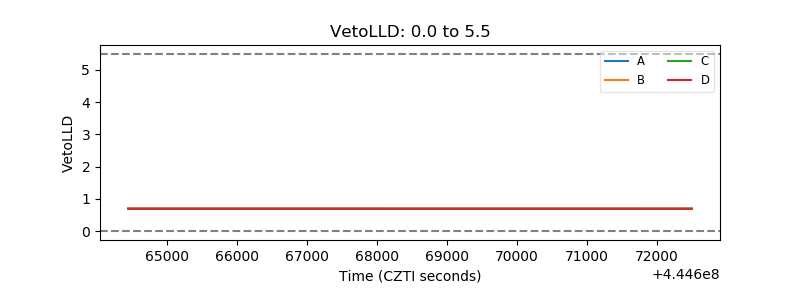 |
| Alpha Counter | 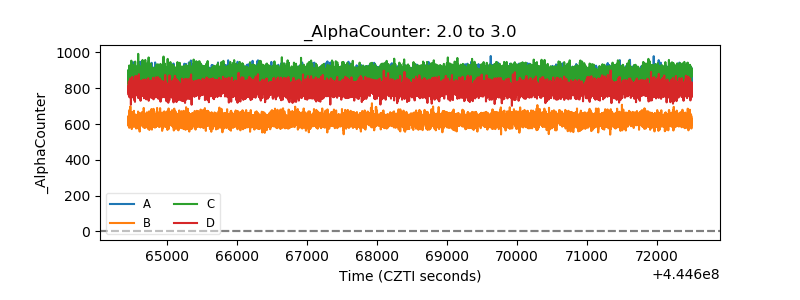 |
| _CPM_Rate | 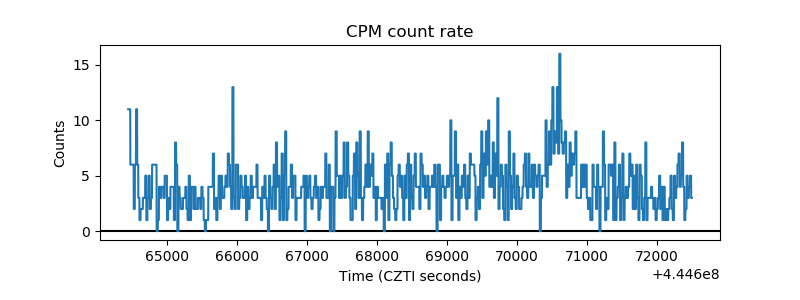 |
| CZT Counter | 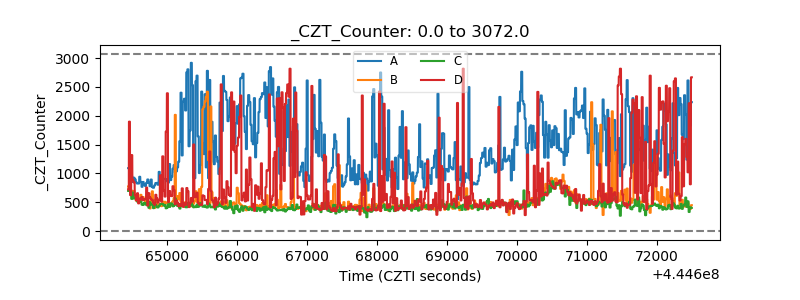 |
| +2.5 Volts monitor | 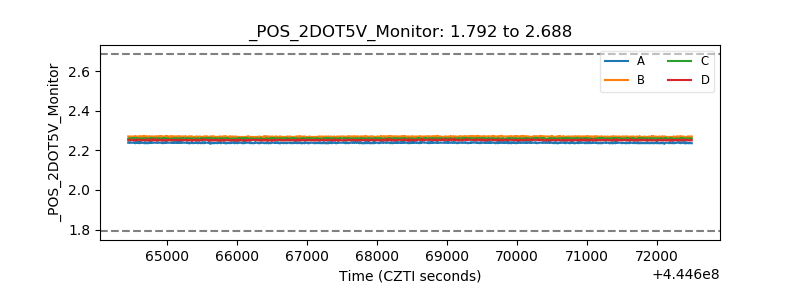 |
| +5 Volts monitor | 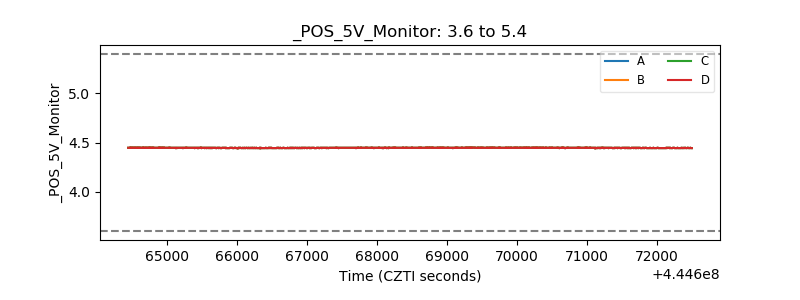 |
| _ROLL_ROT | 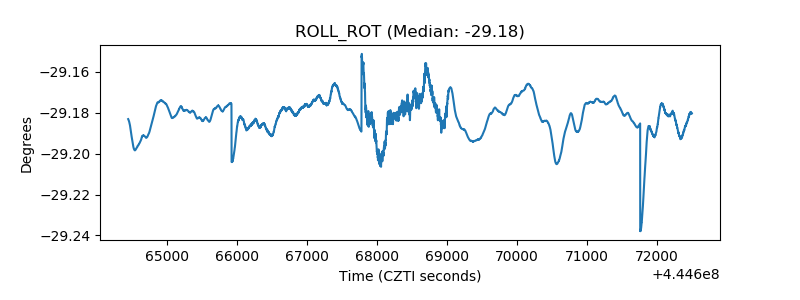 |
| _Roll_DEC | 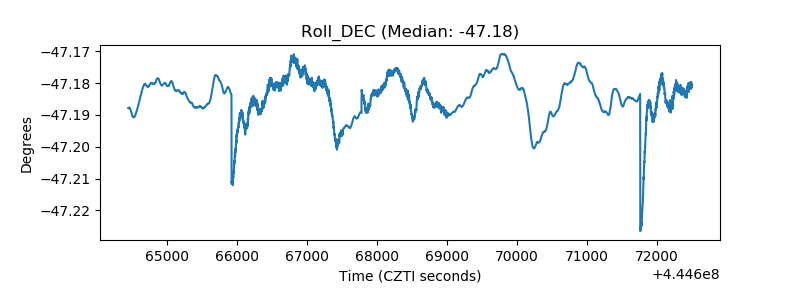 |
| _Roll_RA | 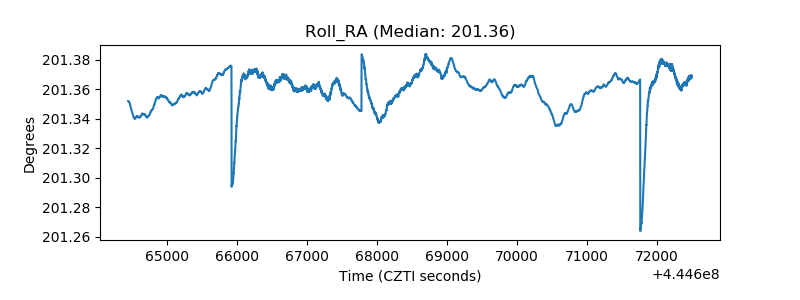 |
| Veto Counter | 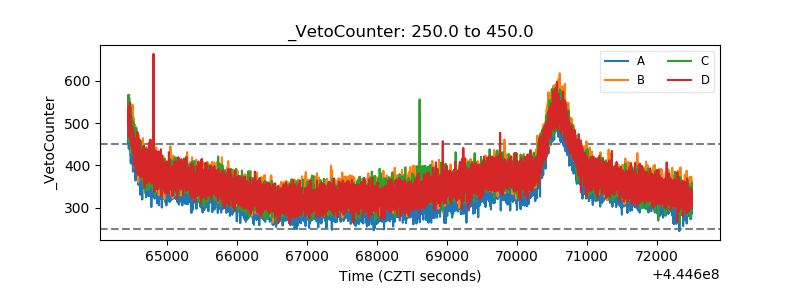 |