| Param | Original file | Final file |
|---|---|---|
| Filename | modeM0/AS1A13_049T04_9000006048_45161cztM0_level2.fits | modeM0/AS1A13_049T04_9000006048_45161cztM0_level2_quad_clean.evt |
| Size (bytes) | 719,242,560 | 117,840,960 |
| Size | 685.9 MB | 112.4 MB |
| Events in quadrant A | 12,327,131 | 613,641 |
| Events in quadrant B | 4,267,194 | 844,510 |
| Events in quadrant C | 3,749,748 | 836,279 |
| Events in quadrant D | 5,666,953 | 723,263 |
| Mode M9 | |||
|---|---|---|---|
| Quadrant | BADHDUFLAG | Total packets | Discarded packets |
| A | 0 | 1 | 0 |
| B | 0 | 1 | 0 |
| C | 0 | 1 | 0 |
| D | 0 | 1 | 0 |
| Mode M0 | |||
|---|---|---|---|
| Quadrant | BADHDUFLAG | Total packets | Discarded packets |
| A | 0 | 42159 | 1 |
| B | 0 | 17894 | 1 |
| C | 0 | 16811 | 1 |
| D | 0 | 22293 | 1 |
| Mode SS | |||
|---|---|---|---|
| Quadrant | BADHDUFLAG | Total packets | Discarded packets |
| A | 0 | 160 | 0 |
| B | 0 | 160 | 0 |
| C | 0 | 160 | 0 |
| D | 0 | 160 | 0 |
| Quadrant | Total seconds | Saturated seconds | Saturation percentage |
|---|---|---|---|
| A | 7908 | 2635 | 33.320688% |
| B | 7908 | 302 | 3.818918% |
| C | 7908 | 117 | 1.479514% |
| D | 7908 | 587 | 7.422863% |
Noise dominated data is calculated using 1-second bins in cleaned event files. If a bin has >2000 counts, and if more than 50% of those come from <1% of pixels, then it is considered to be noise-dominated and hence unusable.
| Quadrant | # 1 sec bins | Bins with >0 counts | Bins with >2000 counts | High rate bins dominated by noise | Noise dominated (total time) | Noise dominated (detector-on time) | Marked lightcurve |
|---|---|---|---|---|---|---|---|
| A | 7968 | 7909 | 1799 | 1799 | 22.58% | 22.75% | 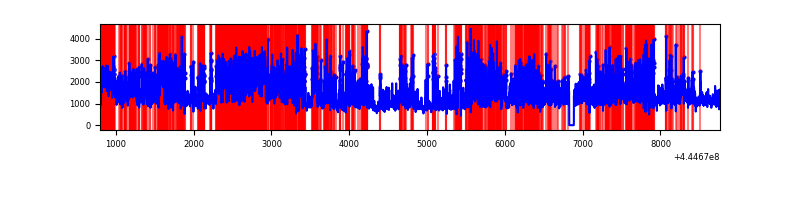 |
| B | 7968 | 7909 | 46 | 46 | 0.58% | 0.58% | 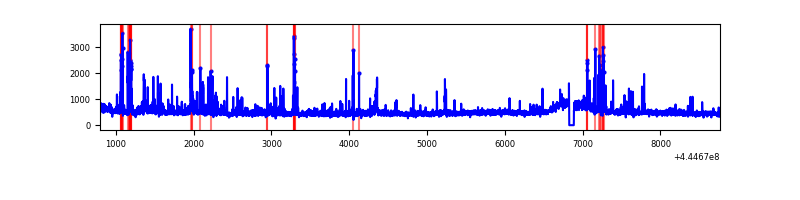 |
| C | 7968 | 7909 | 39 | 39 | 0.49% | 0.49% | 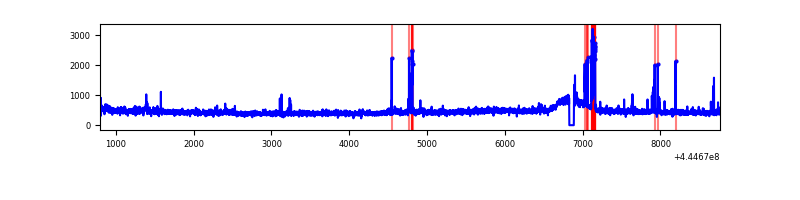 |
| D | 7968 | 7909 | 456 | 456 | 5.72% | 5.77% | 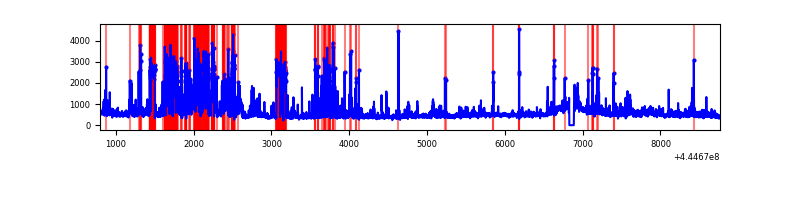 |
Top three noisy pixels from each quadrant. If the there are fewer than three noisy pixels in the level2.evt file, extra rows are filled as -1
| Pixel properties | Quadrant properties | ||||||
|---|---|---|---|---|---|---|---|
| Quadrant | DetID | PixID | Counts | Sigma | Mean | Median | Sigma |
| A | 15 | 223 | 6313106 | 36600.97 | 822 | 801 | 172.5 |
| A | 10 | 83 | 2538362 | 14713.67 | 822 | 801 | 172.5 |
| A | 13 | 248 | 125205 | 721.34 | 822 | 801 | 172.5 |
| B | 5 | 172 | 220894 | 1218.59 | 902 | 871 | 180.6 |
| B | 0 | 155 | 92091 | 505.22 | 902 | 871 | 180.6 |
| B | 0 | 183 | 90603 | 496.98 | 902 | 871 | 180.6 |
| C | 1 | 3 | 109081 | 515.07 | 893 | 897 | 210.0 |
| C | 12 | 2 | 61889 | 290.39 | 893 | 897 | 210.0 |
| C | 3 | 233 | 58547 | 274.48 | 893 | 897 | 210.0 |
| D | 13 | 249 | 565569 | 2583.76 | 869 | 842 | 218.6 |
| D | 13 | 171 | 431308 | 1969.48 | 869 | 842 | 218.6 |
| D | 5 | 235 | 399537 | 1824.13 | 869 | 842 | 218.6 |
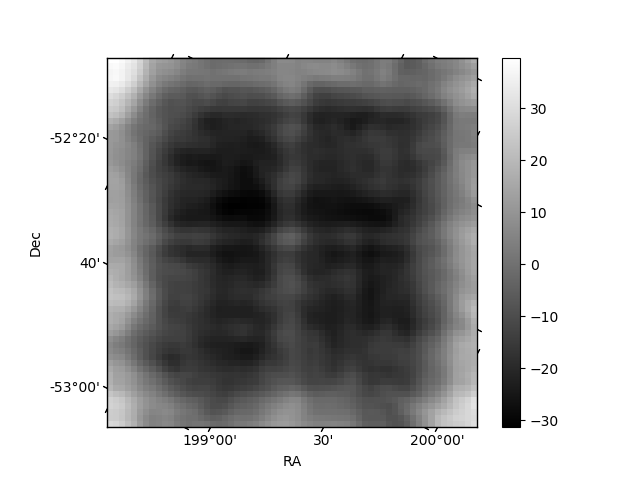
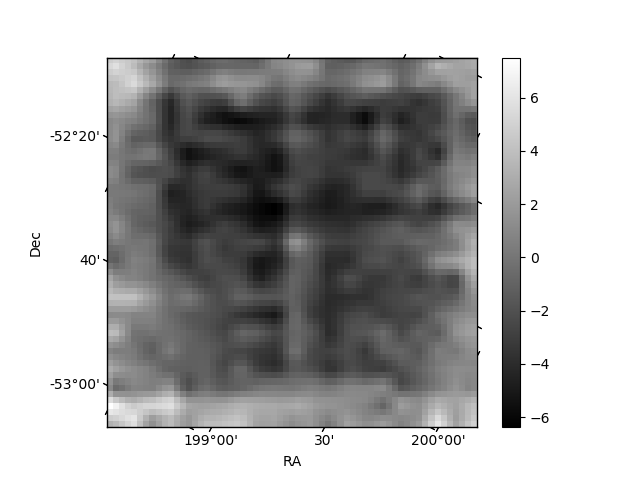
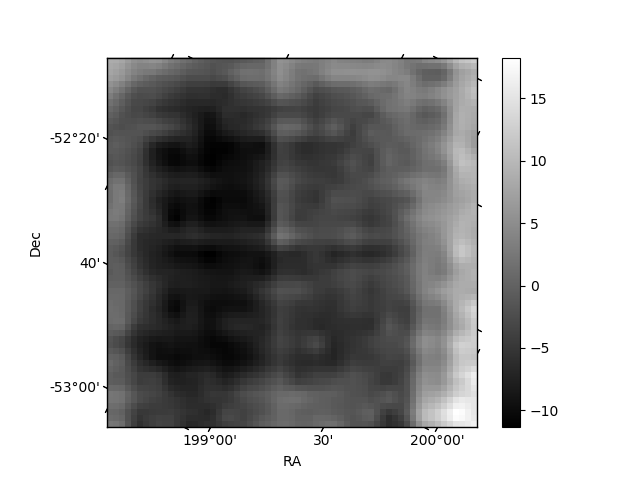
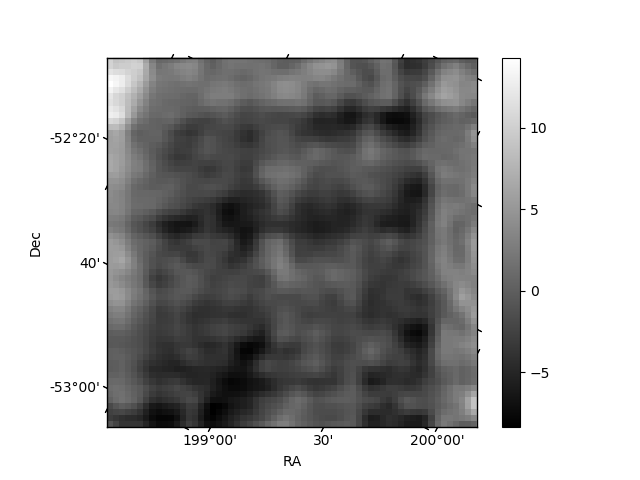
Histogram calculated using DETX and DETY for each event in the final _common_clean file
| Quadrant A | 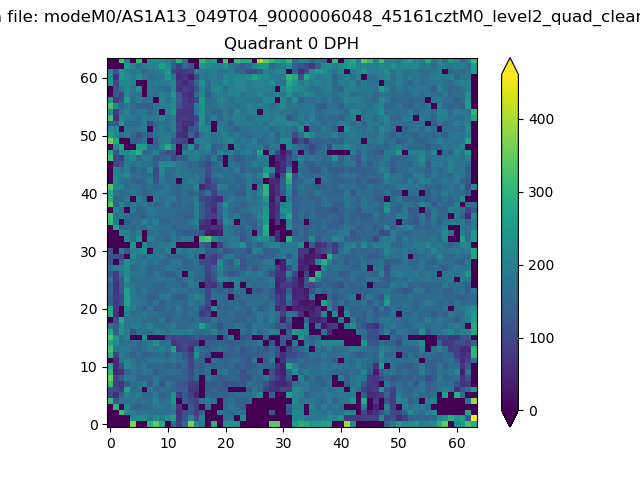 |
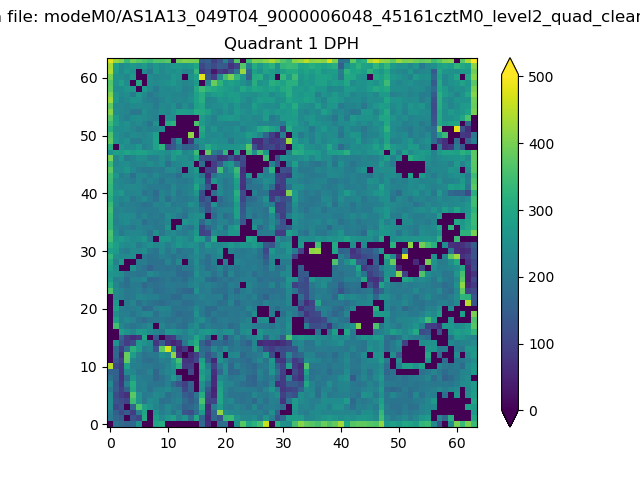 |
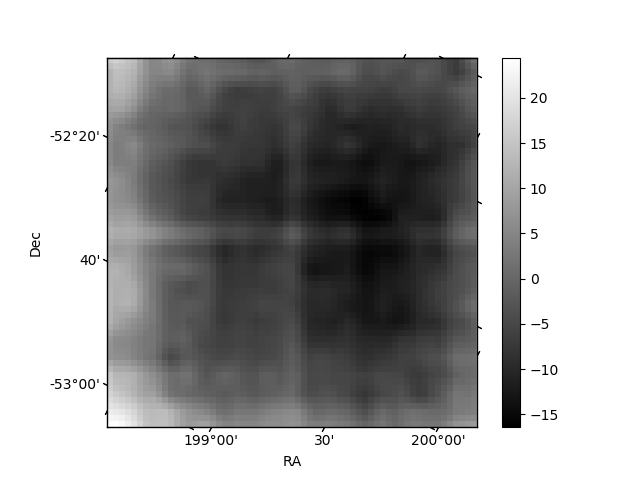
Quadrant B |
|---|---|---|---|
| Quadrant D | 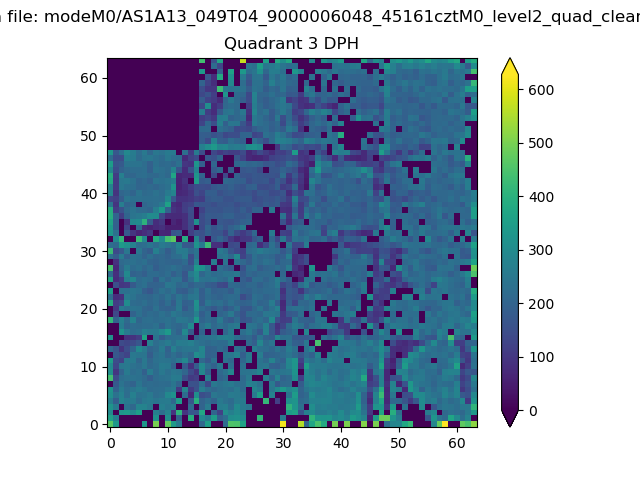 |
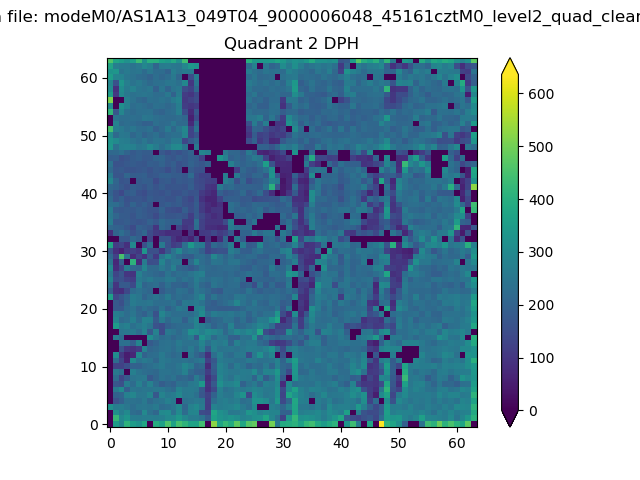 |
Quadrant C |
| Plot type | Count rate plots | Images |
|---|---|---|
| Comparison with Poisson distribution Blue bars denote a histogram of data divided into 1 sec bins. Red curve is a Poisson curve with rate = median count rate of data. |
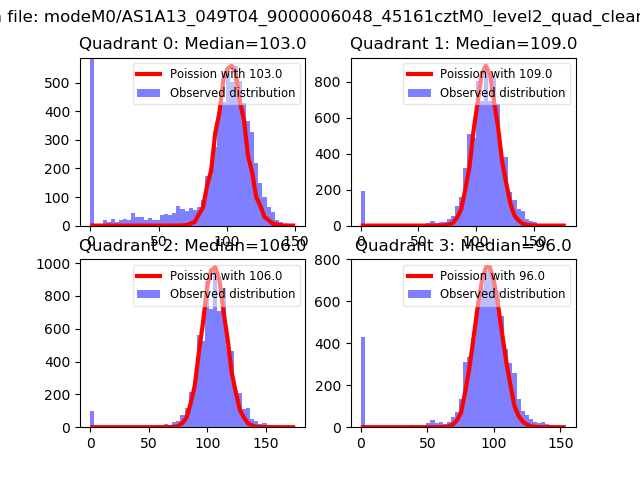 |
 |
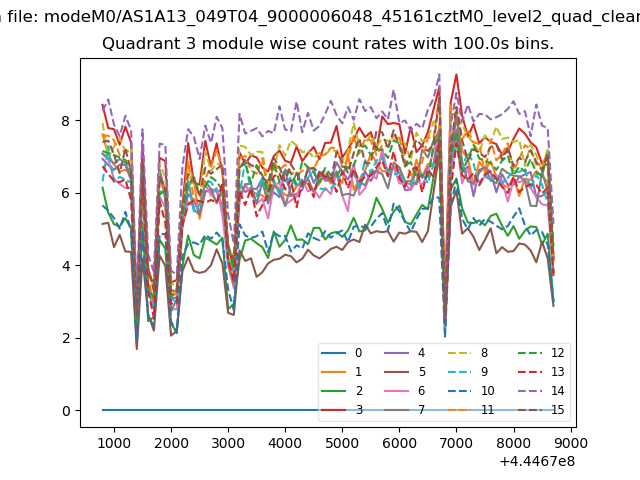
| Quadrant-wise count rates Data is divided into 100 sec bins |
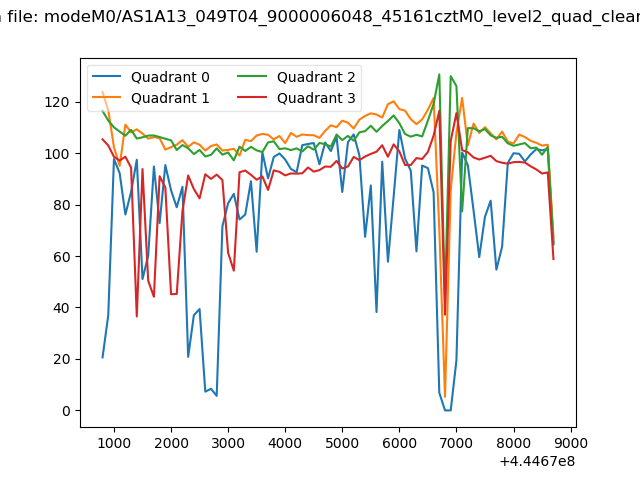 |
|
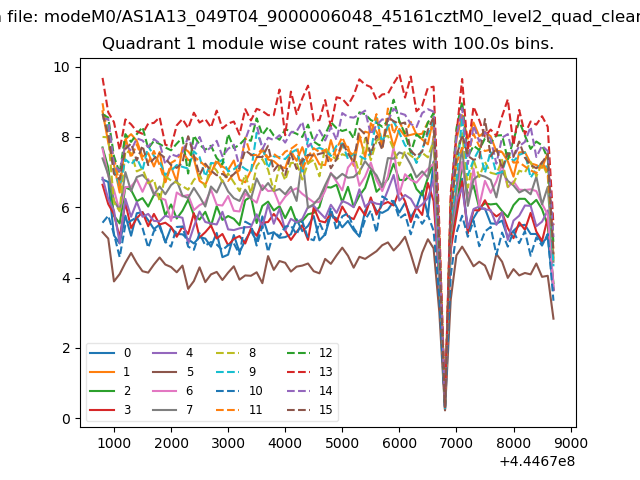
| Module-wise count rates for Quadrant A Data is divided into 100 sec bins |
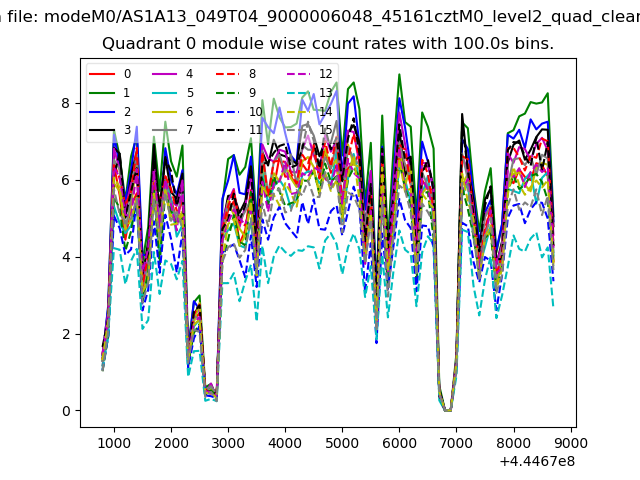 |
 |
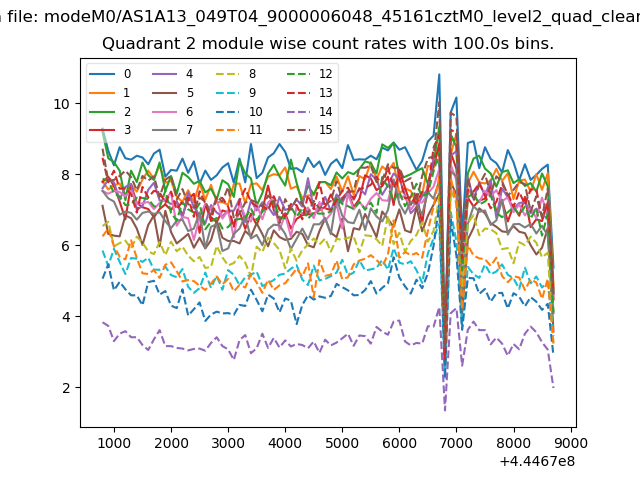
| Module-wise count rates for Quadrant B Data is divided into 100 sec bins |
 |
 |
| Module-wise count rates for Quadrant C Data is divided into 100 sec bins |
 |
 |
| Module-wise count rates for Quadrant D Data is divided into 100 sec bins |
 |
 |
| Parameter | Plot |
|---|---|
| CZT HV Monitor | 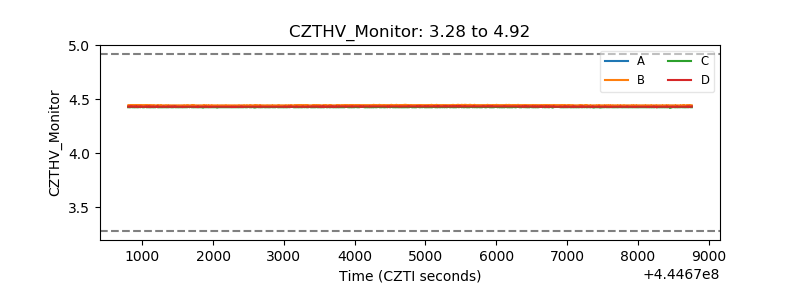 |
| D_VDD | 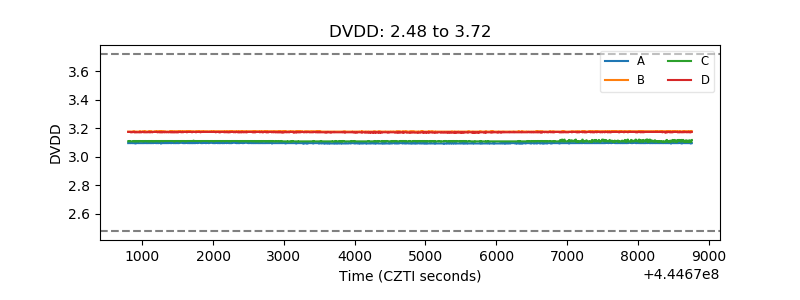 |
| Temperature 1 | 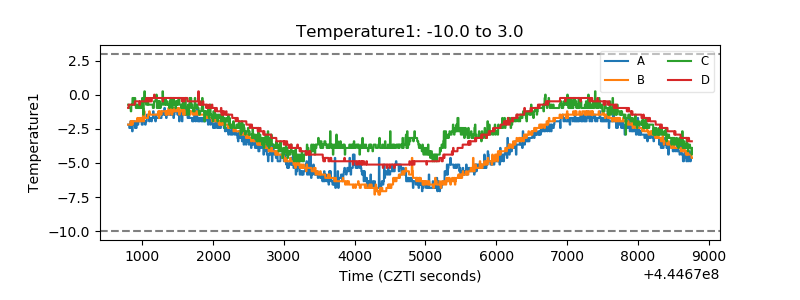 |
| Veto HV Monitor | 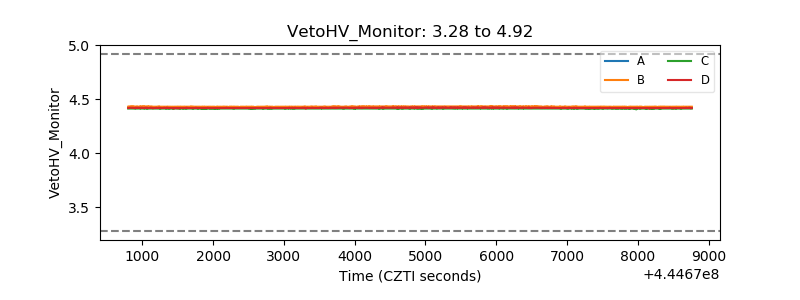 |
| Veto LLD | 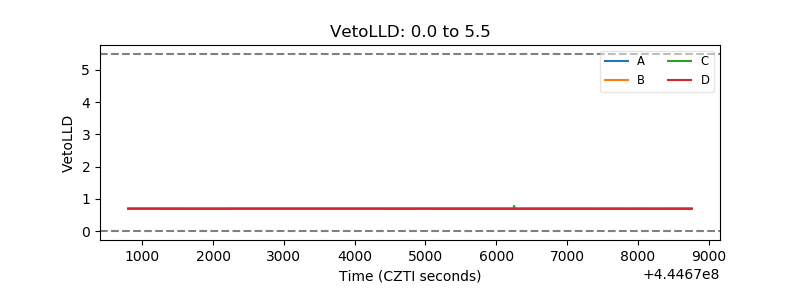 |
| Alpha Counter | 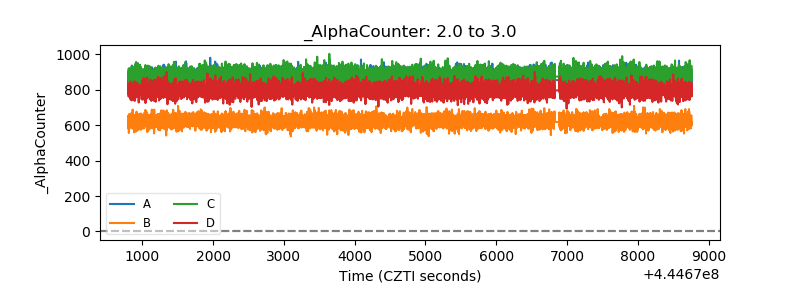 |
| _CPM_Rate | 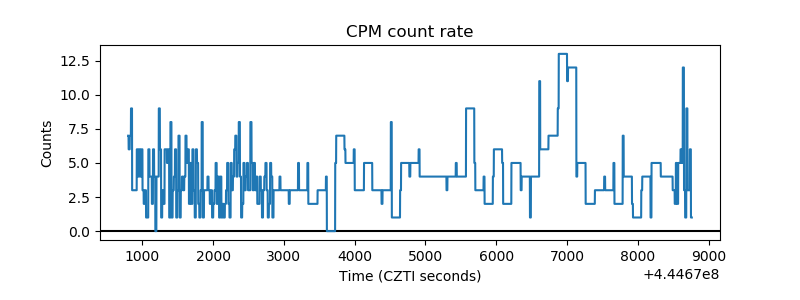 |
| CZT Counter | 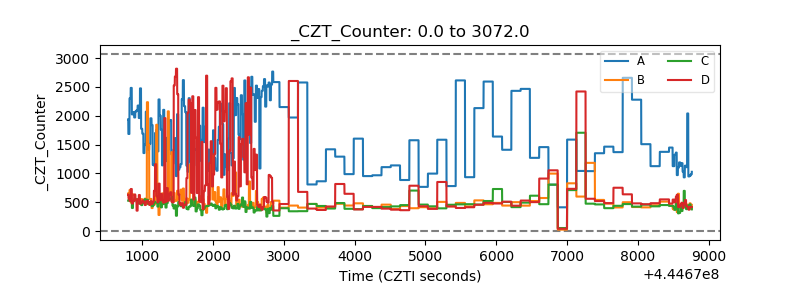 |
| +2.5 Volts monitor | 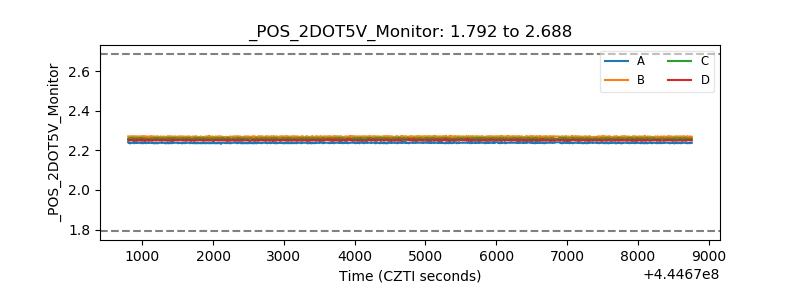 |
| +5 Volts monitor | 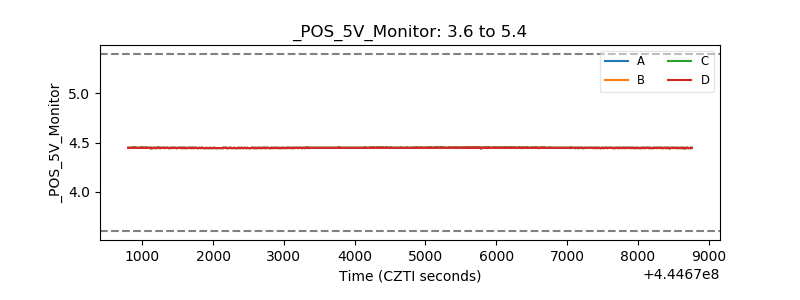 |
| _ROLL_ROT | 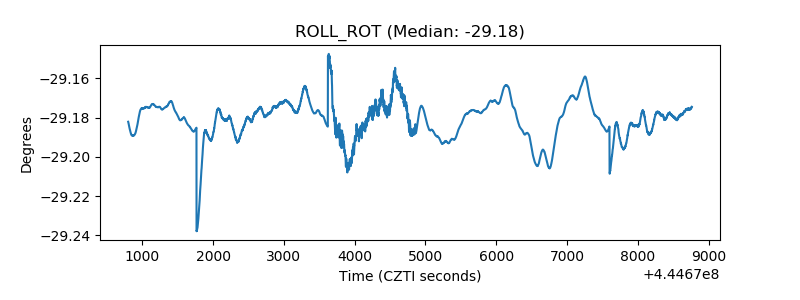 |
| _Roll_DEC | 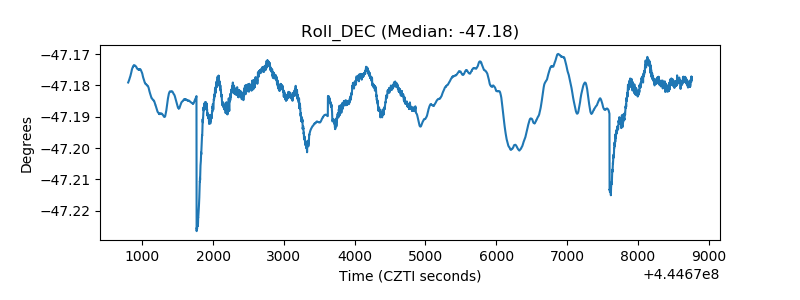 |
| _Roll_RA | 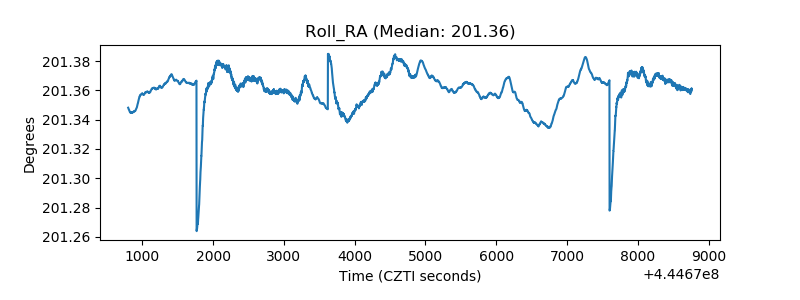 |
| Veto Counter | 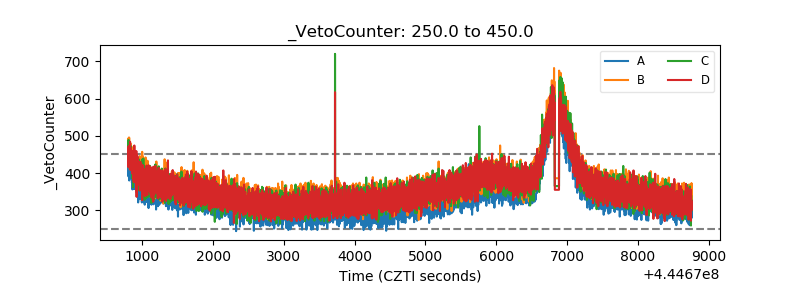 |