| Param | Original file | Final file |
|---|---|---|
| Filename | modeM0/AS1A13_049T04_9000006048_45165cztM0_level2.fits | modeM0/AS1A13_049T04_9000006048_45165cztM0_level2_quad_clean.evt |
| Size (bytes) | 1,301,394,240 | 214,790,400 |
| Size | 1.2 GB | 204.8 MB |
| Events in quadrant A | 20,886,881 | 1,205,807 |
| Events in quadrant B | 7,262,960 | 1,554,082 |
| Events in quadrant C | 7,178,578 | 1,504,022 |
| Events in quadrant D | 11,721,339 | 1,234,845 |
| Mode M9 | |||
|---|---|---|---|
| Quadrant | BADHDUFLAG | Total packets | Discarded packets |
| A | 0 | 11 | 0 |
| B | 0 | 11 | 0 |
| C | 0 | 11 | 0 |
| D | 0 | 11 | 0 |
| Mode M0 | |||
|---|---|---|---|
| Quadrant | BADHDUFLAG | Total packets | Discarded packets |
| A | 0 | 72115 | 3 |
| B | 0 | 31553 | 6 |
| C | 0 | 31828 | 2 |
| D | 0 | 45093 | 11 |
| Mode SS | |||
|---|---|---|---|
| Quadrant | BADHDUFLAG | Total packets | Discarded packets |
| A | 0 | 294 | 0 |
| B | 0 | 294 | 0 |
| C | 0 | 294 | 0 |
| D | 0 | 293 | 1 |
| Quadrant | Total seconds | Saturated seconds | Saturation percentage |
|---|---|---|---|
| A | 14546 | 3434 | 23.607865% |
| B | 14543 | 242 | 1.664031% |
| C | 14547 | 175 | 1.202997% |
| D | 14544 | 1549 | 10.650440% |
Noise dominated data is calculated using 1-second bins in cleaned event files. If a bin has >2000 counts, and if more than 50% of those come from <1% of pixels, then it is considered to be noise-dominated and hence unusable.
| Quadrant | # 1 sec bins | Bins with >0 counts | Bins with >2000 counts | High rate bins dominated by noise | Noise dominated (total time) | Noise dominated (detector-on time) | Marked lightcurve |
|---|---|---|---|---|---|---|---|
| A | 15611 | 14547 | 2725 | 2725 | 17.46% | 18.73% | 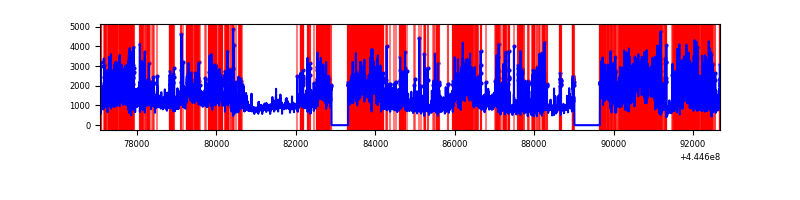 |
| B | 15611 | 14547 | 99 | 99 | 0.63% | 0.68% | 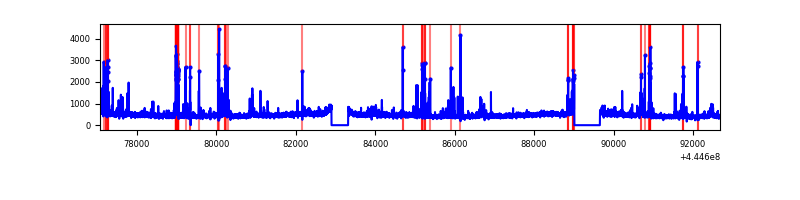 |
| C | 15612 | 14549 | 116 | 116 | 0.74% | 0.80% | 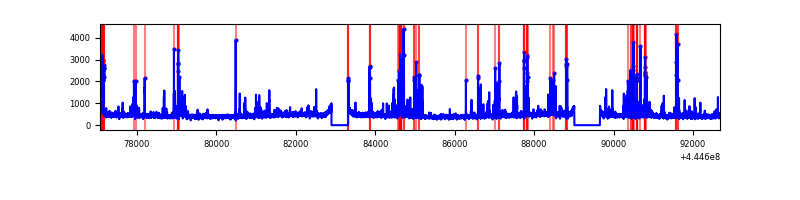 |
| D | 15612 | 14547 | 1326 | 1326 | 8.49% | 9.12% | 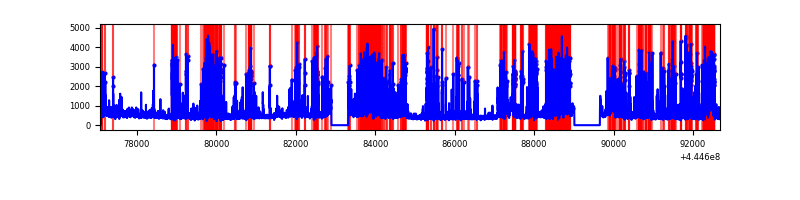 |
Top three noisy pixels from each quadrant. If the there are fewer than three noisy pixels in the level2.evt file, extra rows are filled as -1
| Pixel properties | Quadrant properties | ||||||
|---|---|---|---|---|---|---|---|
| Quadrant | DetID | PixID | Counts | Sigma | Mean | Median | Sigma |
| A | 15 | 223 | 10109682 | 33446.78 | 1455 | 1424 | 302.2 |
| A | 10 | 83 | 4742007 | 15685.91 | 1455 | 1424 | 302.2 |
| A | 13 | 248 | 253261 | 833.29 | 1455 | 1424 | 302.2 |
| B | 5 | 172 | 423012 | 1345.4 | 1594 | 1543 | 313.3 |
| B | 0 | 183 | 101216 | 318.17 | 1594 | 1543 | 313.3 |
| B | 0 | 246 | 98429 | 309.27 | 1594 | 1543 | 313.3 |
| C | 1 | 3 | 322248 | 872.46 | 1568 | 1577 | 367.5 |
| C | 14 | 254 | 185761 | 501.11 | 1568 | 1577 | 367.5 |
| C | 12 | 2 | 166344 | 448.29 | 1568 | 1577 | 367.5 |
| D | 13 | 249 | 3713777 | 9874.95 | 1484 | 1438 | 375.9 |
| D | 5 | 235 | 1103265 | 2930.9 | 1484 | 1438 | 375.9 |
| D | 11 | 241 | 221997 | 586.69 | 1484 | 1438 | 375.9 |
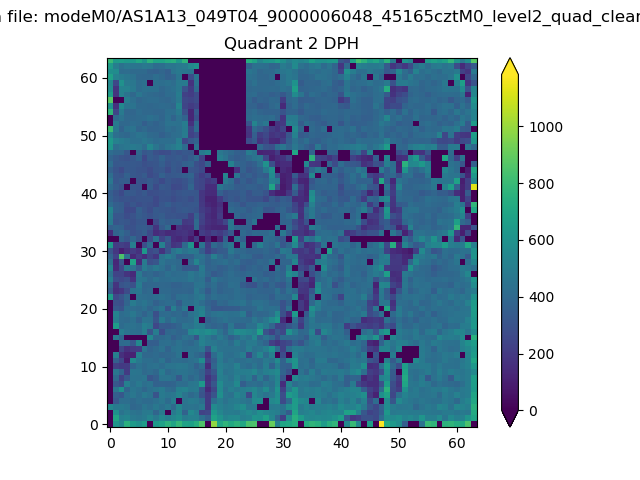
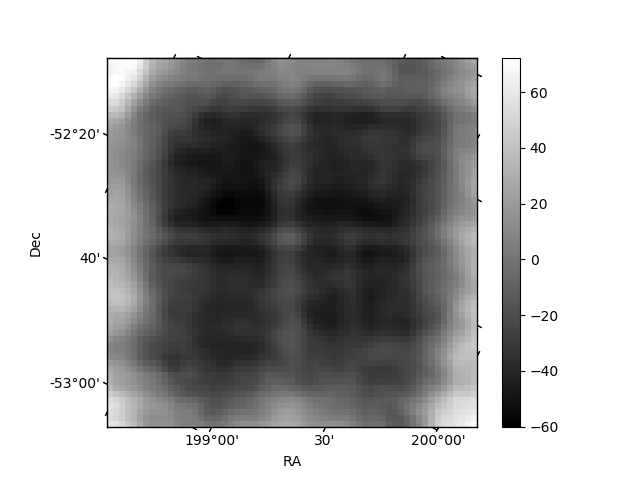
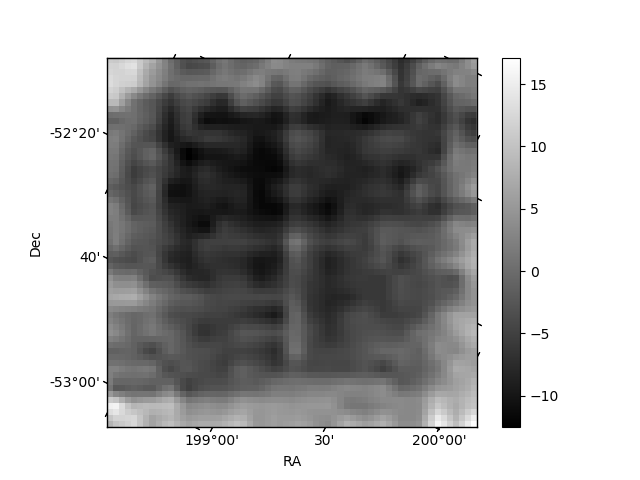
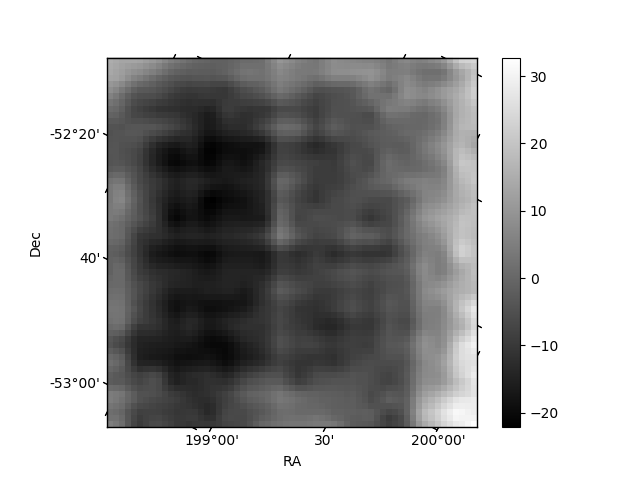
Histogram calculated using DETX and DETY for each event in the final _common_clean file
| Quadrant A | 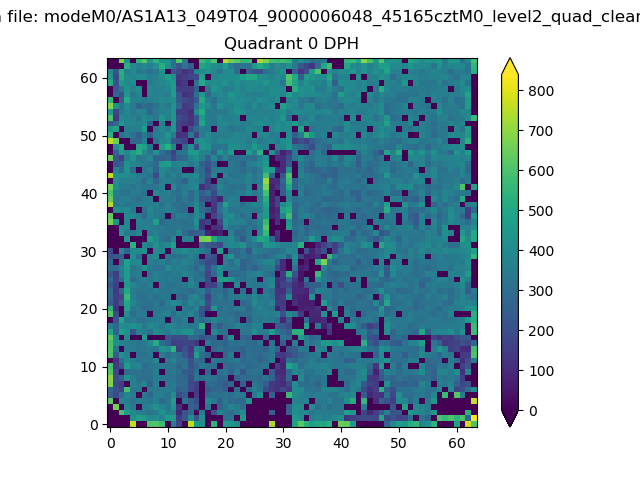 |
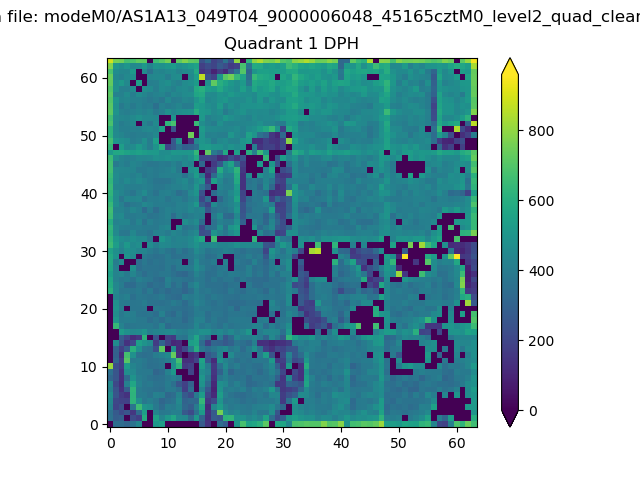 |
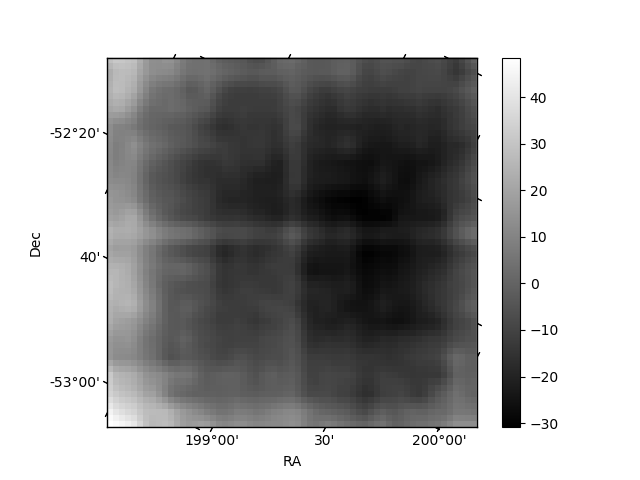
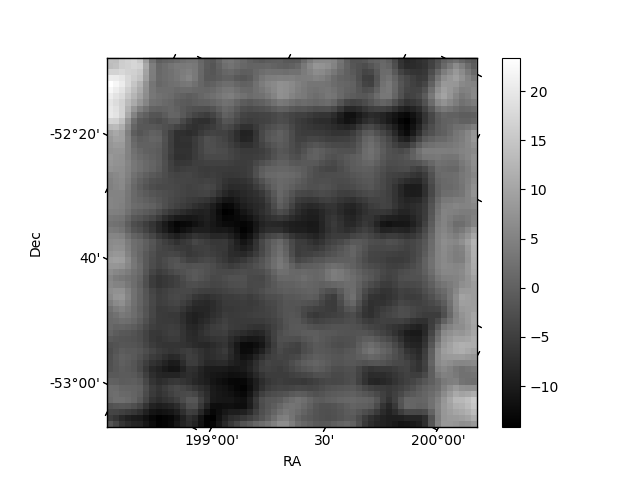
Quadrant B |
|---|---|---|---|
| Quadrant D | 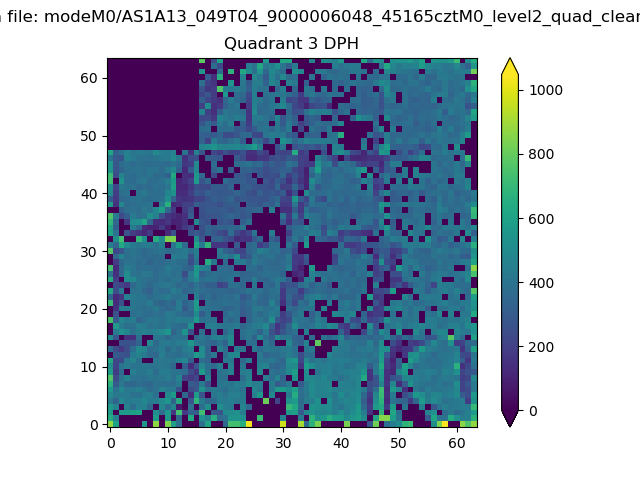 |
 |
Quadrant C |
| Plot type | Count rate plots | Images |
|---|---|---|
| Comparison with Poisson distribution Blue bars denote a histogram of data divided into 1 sec bins. Red curve is a Poisson curve with rate = median count rate of data. |
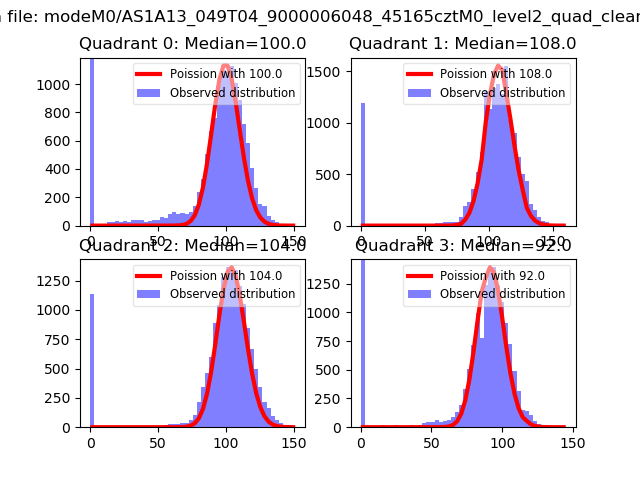 |
 |
| Quadrant-wise count rates Data is divided into 100 sec bins |
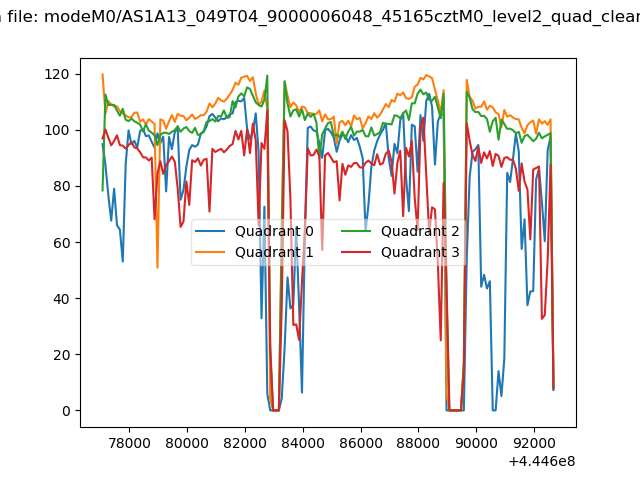 |
|
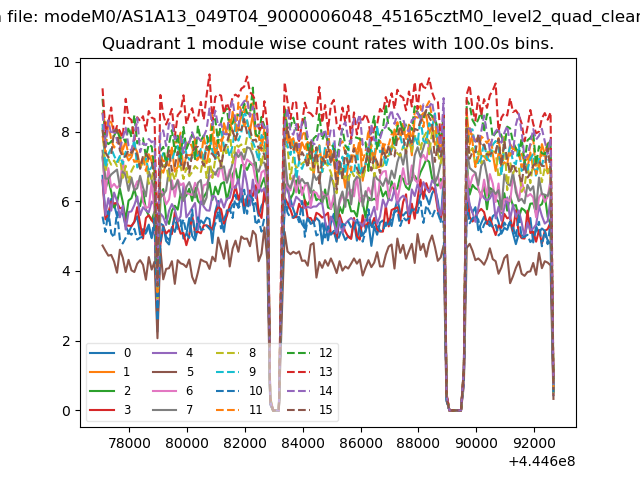
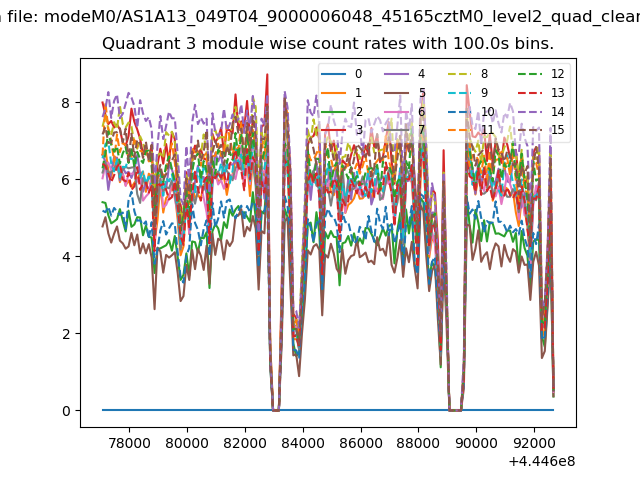
| Module-wise count rates for Quadrant A Data is divided into 100 sec bins |
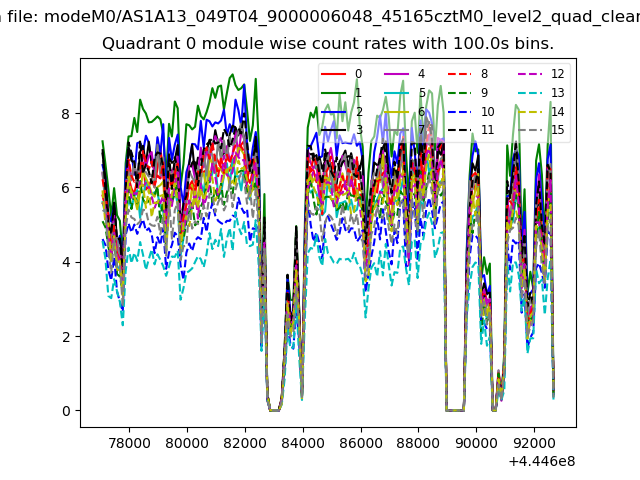 |
 |
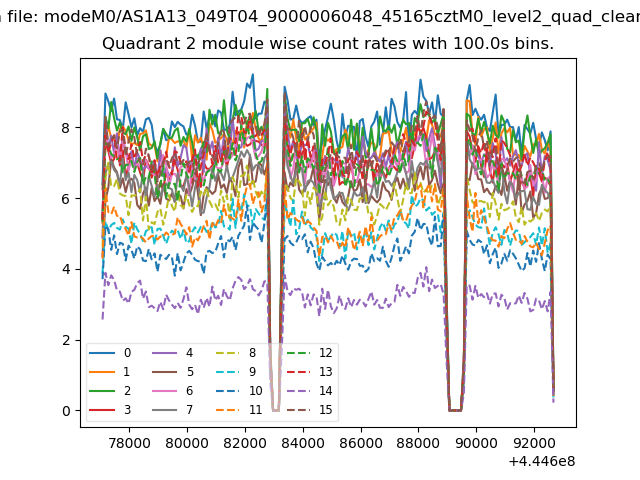
| Module-wise count rates for Quadrant B Data is divided into 100 sec bins |
 |
 |
| Module-wise count rates for Quadrant C Data is divided into 100 sec bins |
 |
 |
| Module-wise count rates for Quadrant D Data is divided into 100 sec bins |
 |
 |
| Parameter | Plot |
|---|---|
| CZT HV Monitor | 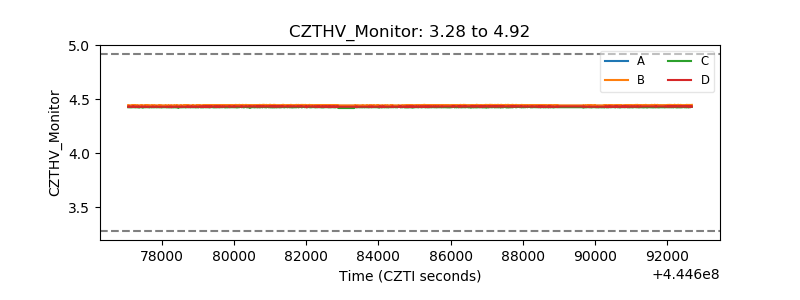 |
| D_VDD | 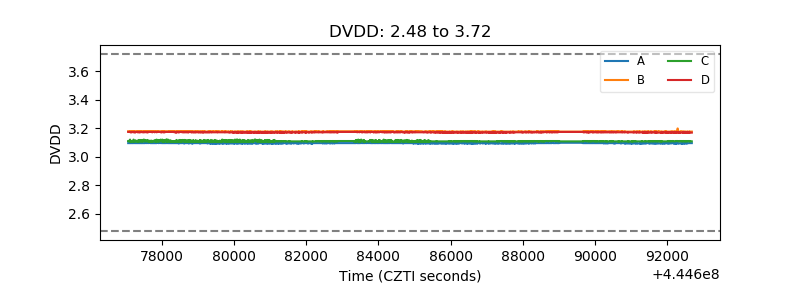 |
| Temperature 1 | 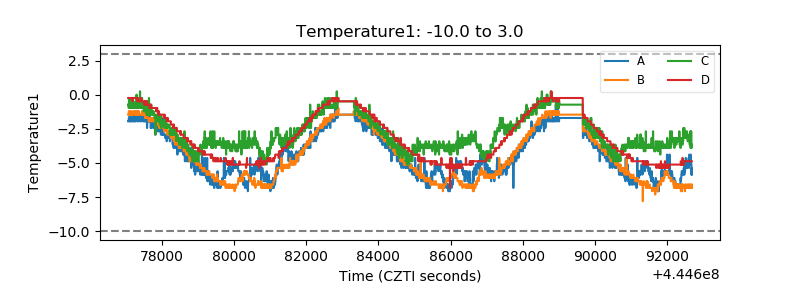 |
| Veto HV Monitor | 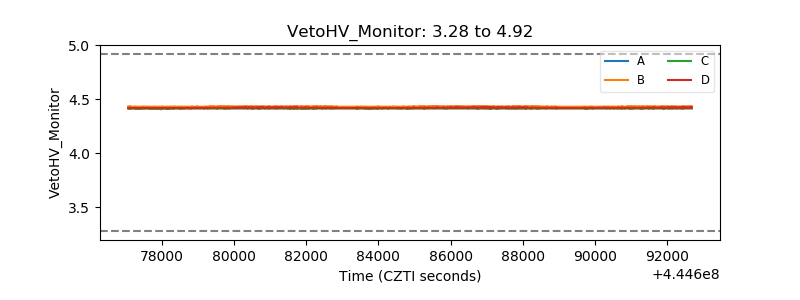 |
| Veto LLD | 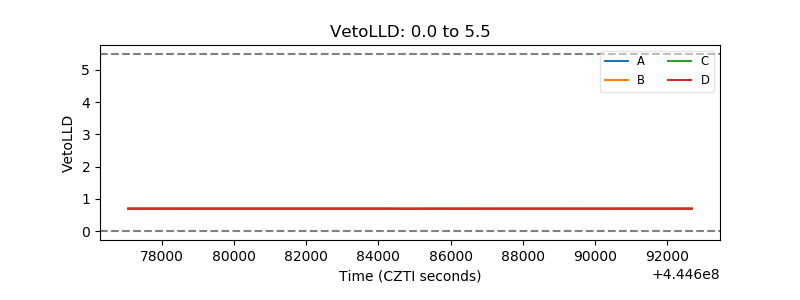 |
| Alpha Counter | 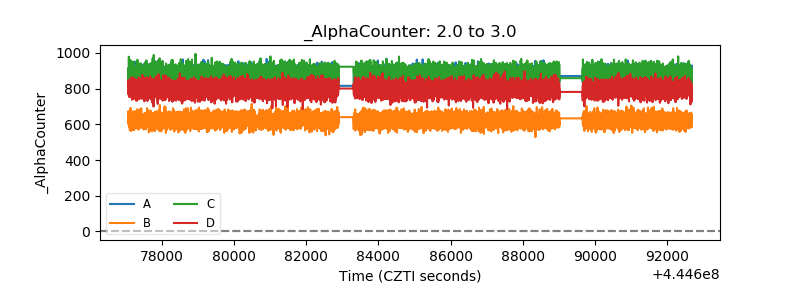 |
| _CPM_Rate | 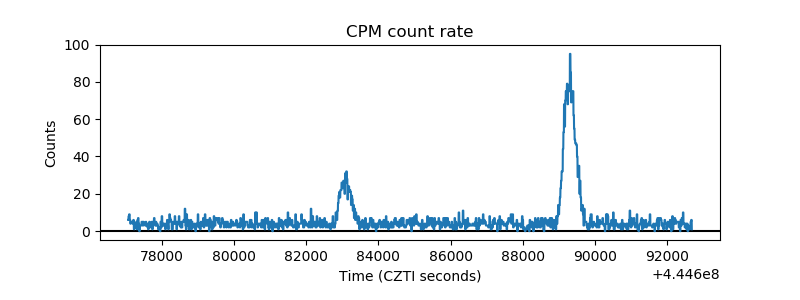 |
| CZT Counter | 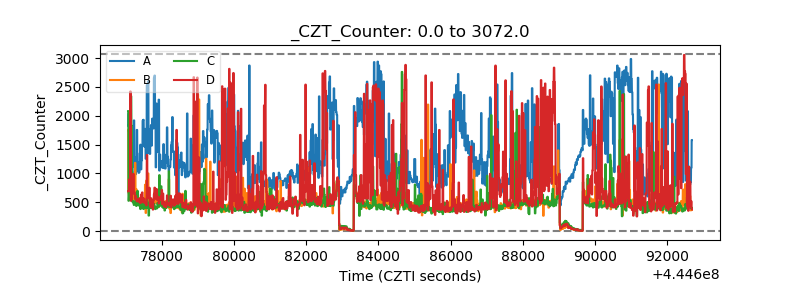 |
| +2.5 Volts monitor | 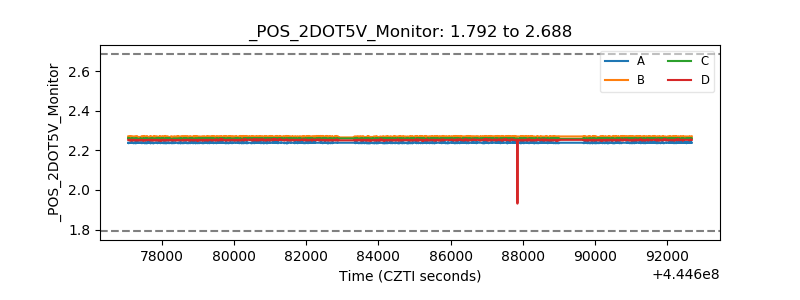 |
| +5 Volts monitor | 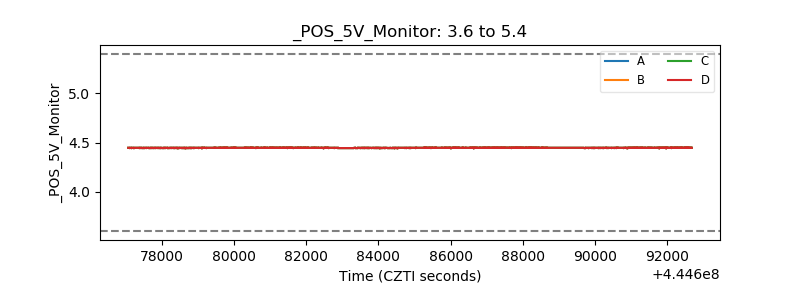 |
| _ROLL_ROT | 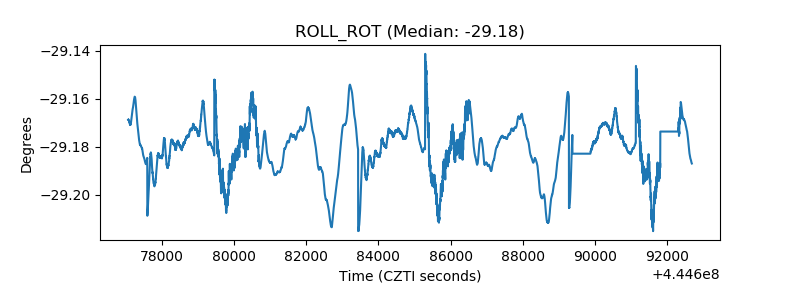 |
| _Roll_DEC | 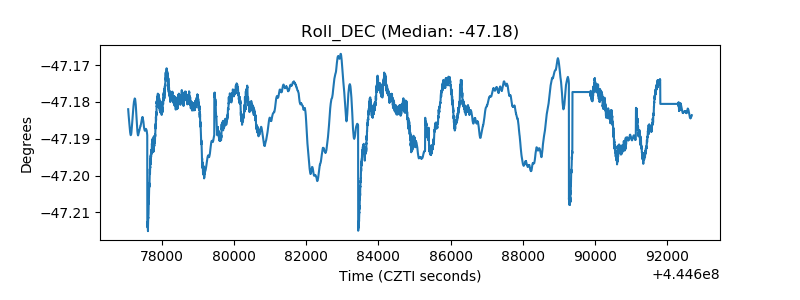 |
| _Roll_RA | 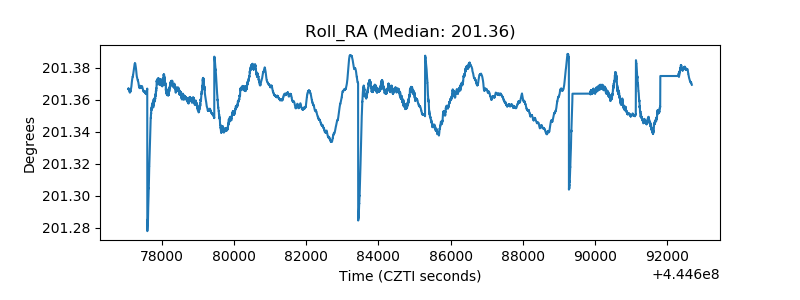 |
| Veto Counter | 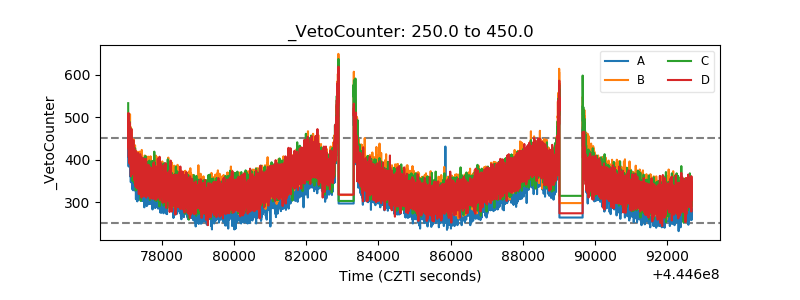 |