| Param | Original file | Final file |
|---|---|---|
| Filename | modeM0/AS1A13_049T04_9000006048_45167cztM0_level2.fits | modeM0/AS1A13_049T04_9000006048_45167cztM0_level2_quad_clean.evt |
| Size (bytes) | 293,774,400 | 55,258,560 |
| Size | 280.2 MB | 52.7 MB |
| Events in quadrant A | 4,258,342 | 345,104 |
| Events in quadrant B | 1,843,101 | 387,634 |
| Events in quadrant C | 1,719,565 | 375,118 |
| Events in quadrant D | 2,779,549 | 316,097 |
| Mode M9 | |||
|---|---|---|---|
| Quadrant | BADHDUFLAG | Total packets | Discarded packets |
| A | 0 | 7 | 0 |
| B | 0 | 7 | 0 |
| C | 0 | 7 | 0 |
| D | 0 | 7 | 0 |
| Mode M0 | |||
|---|---|---|---|
| Quadrant | BADHDUFLAG | Total packets | Discarded packets |
| A | 0 | 15034 | 2 |
| B | 0 | 7720 | 2 |
| C | 0 | 7440 | 2 |
| D | 0 | 10653 | 2 |
| Mode SS | |||
|---|---|---|---|
| Quadrant | BADHDUFLAG | Total packets | Discarded packets |
| A | 0 | 74 | 0 |
| B | 0 | 74 | 0 |
| C | 0 | 74 | 0 |
| D | 0 | 74 | 0 |
| Quadrant | Total seconds | Saturated seconds | Saturation percentage |
|---|---|---|---|
| A | 3510 | 474 | 13.504274% |
| B | 3510 | 95 | 2.706553% |
| C | 3511 | 28 | 0.797494% |
| D | 3511 | 367 | 10.452862% |
Noise dominated data is calculated using 1-second bins in cleaned event files. If a bin has >2000 counts, and if more than 50% of those come from <1% of pixels, then it is considered to be noise-dominated and hence unusable.
| Quadrant | # 1 sec bins | Bins with >0 counts | Bins with >2000 counts | High rate bins dominated by noise | Noise dominated (total time) | Noise dominated (detector-on time) | Marked lightcurve |
|---|---|---|---|---|---|---|---|
| A | 4315 | 3511 | 296 | 296 | 6.86% | 8.43% | 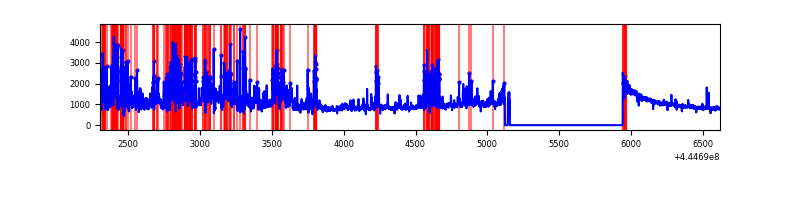 |
| B | 4315 | 3512 | 40 | 40 | 0.93% | 1.14% |  |
| C | 4316 | 3513 | 4 | 4 | 0.09% | 0.11% |  |
| D | 4316 | 3513 | 305 | 305 | 7.07% | 8.68% | 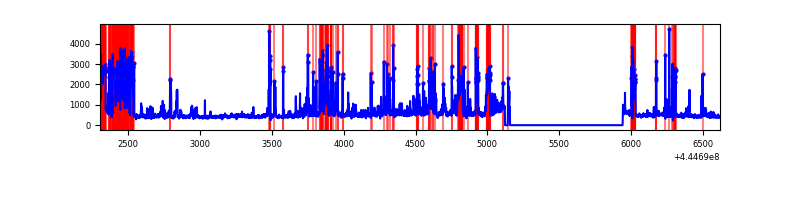 |
Top three noisy pixels from each quadrant. If the there are fewer than three noisy pixels in the level2.evt file, extra rows are filled as -1
| Pixel properties | Quadrant properties | ||||||
|---|---|---|---|---|---|---|---|
| Quadrant | DetID | PixID | Counts | Sigma | Mean | Median | Sigma |
| A | 15 | 223 | 1382536 | 16929.73 | 389 | 381 | 81.6 |
| A | 10 | 83 | 1235387 | 15127.33 | 389 | 381 | 81.6 |
| A | 15 | 174 | 98464 | 1201.4 | 389 | 381 | 81.6 |
| B | 5 | 172 | 161669 | 1976.42 | 402 | 388 | 81.6 |
| B | 0 | 155 | 46760 | 568.26 | 402 | 388 | 81.6 |
| B | 0 | 246 | 14063 | 167.58 | 402 | 388 | 81.6 |
| C | 5 | 4 | 41207 | 423.32 | 402 | 404 | 96.4 |
| C | 1 | 3 | 40812 | 419.22 | 402 | 404 | 96.4 |
| C | 12 | 2 | 23928 | 244.06 | 402 | 404 | 96.4 |
| D | 13 | 249 | 1015271 | 10331.69 | 384 | 370 | 98.2 |
| D | 2 | 249 | 87698 | 889.0 | 384 | 370 | 98.2 |
| D | 13 | 29 | 58906 | 595.9 | 384 | 370 | 98.2 |
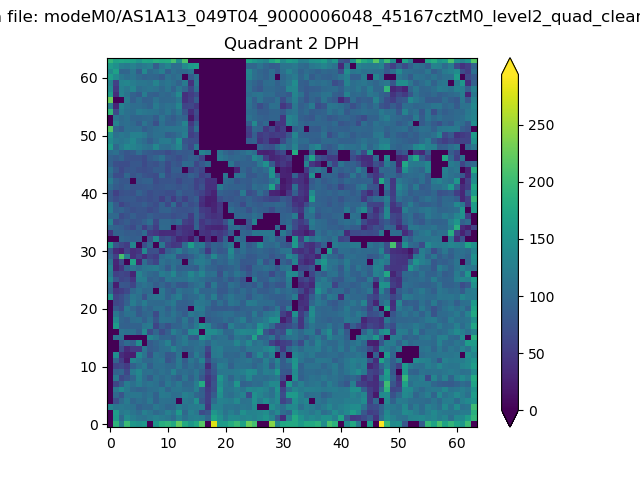
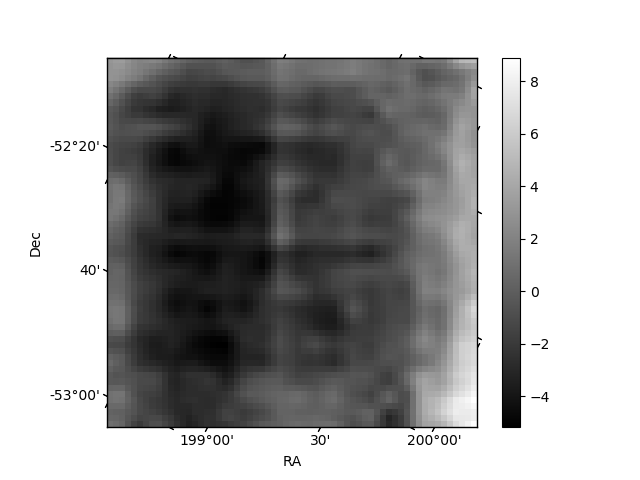
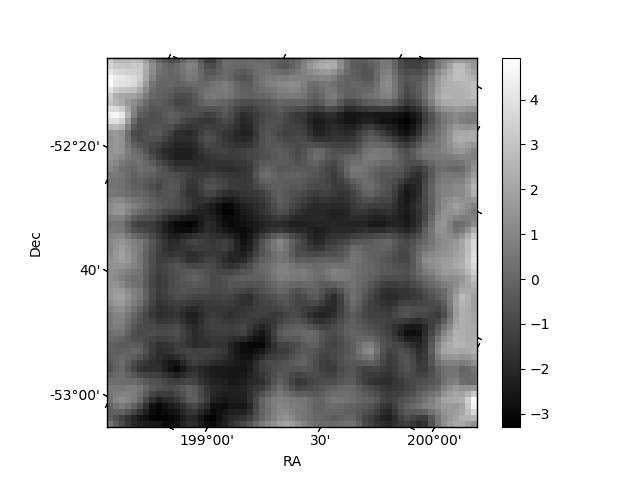
Histogram calculated using DETX and DETY for each event in the final _common_clean file
| Quadrant A | 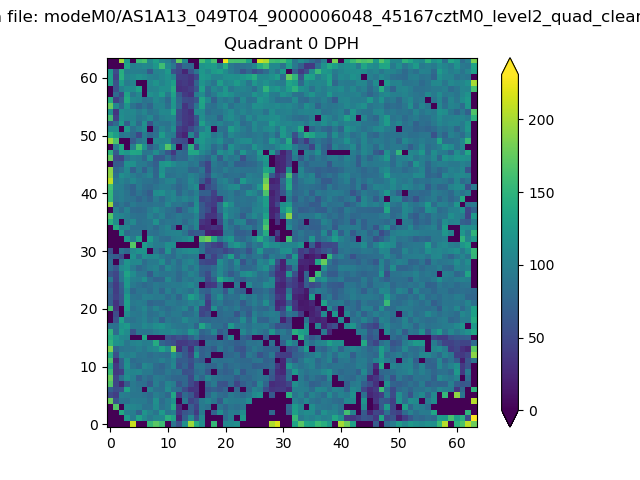 |
 |
Quadrant B |
|---|---|---|---|
| Quadrant D | 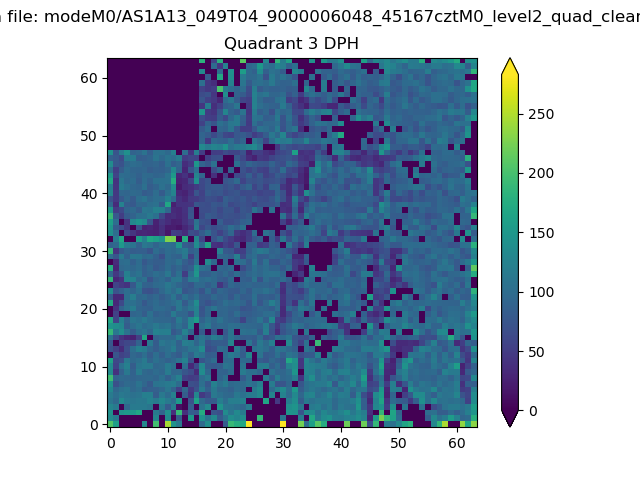 |
 |
Quadrant C |
| Plot type | Count rate plots | Images |
|---|---|---|
| Comparison with Poisson distribution Blue bars denote a histogram of data divided into 1 sec bins. Red curve is a Poisson curve with rate = median count rate of data. |
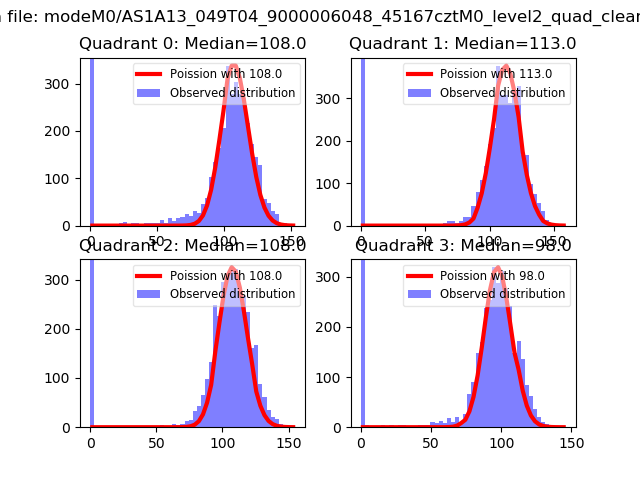 |
 |
| Quadrant-wise count rates Data is divided into 100 sec bins |
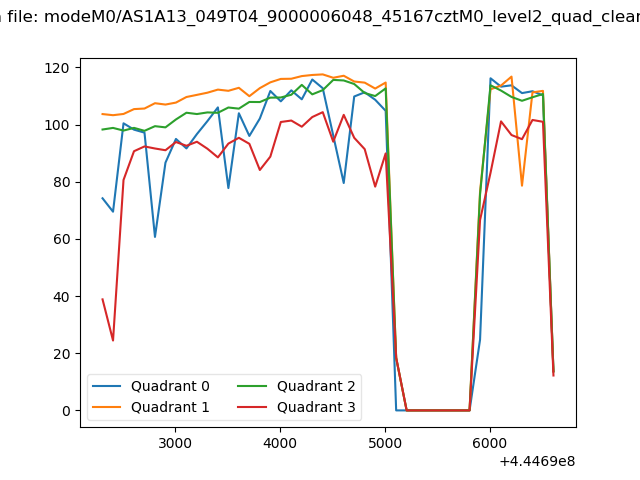 |
|
| Module-wise count rates for Quadrant A Data is divided into 100 sec bins |
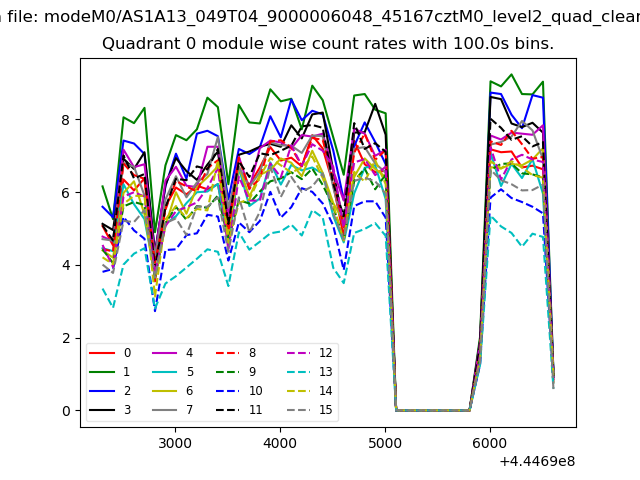 |
 |
| Module-wise count rates for Quadrant B Data is divided into 100 sec bins |
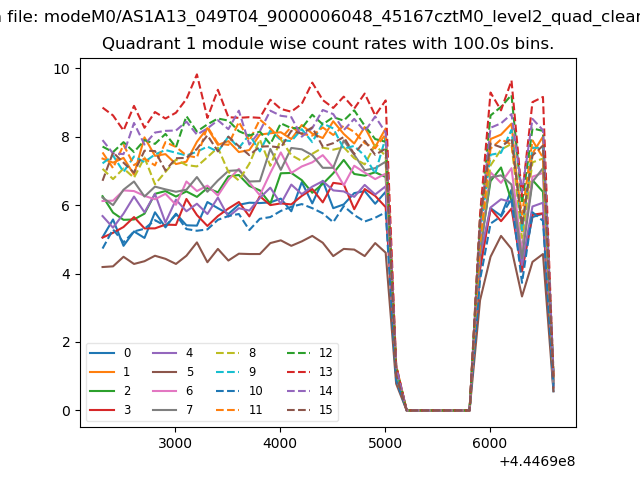 |
 |
| Module-wise count rates for Quadrant C Data is divided into 100 sec bins |
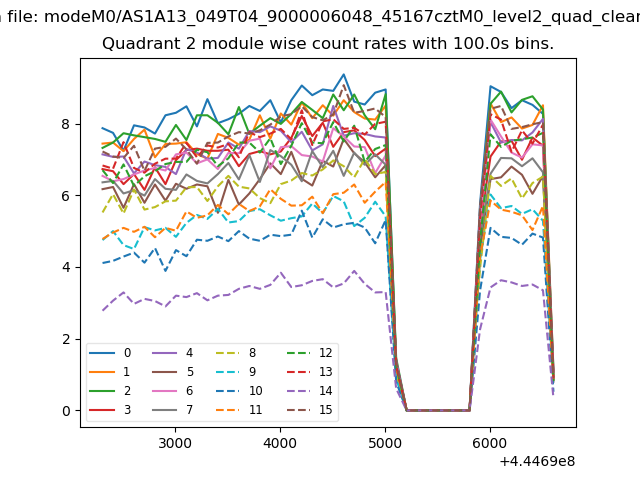 |
 |
| Module-wise count rates for Quadrant D Data is divided into 100 sec bins |
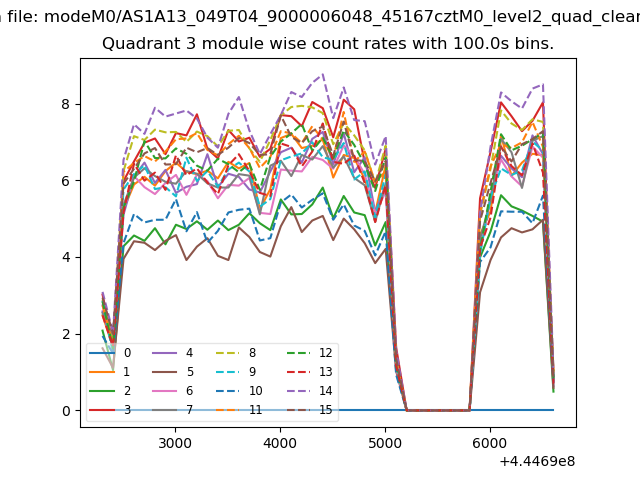 |
 |
| Parameter | Plot |
|---|---|
| CZT HV Monitor | 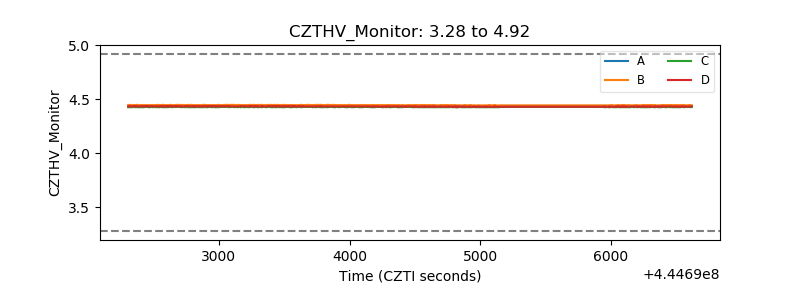 |
| D_VDD | 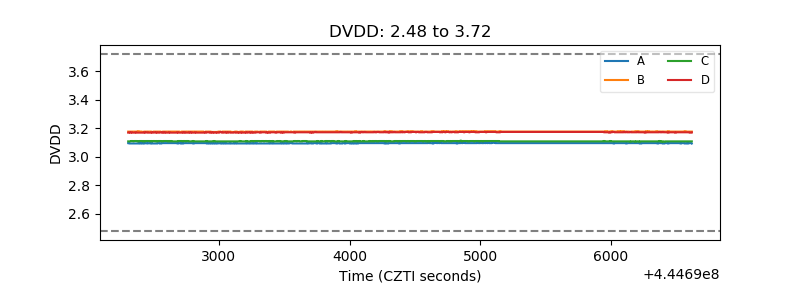 |
| Temperature 1 | 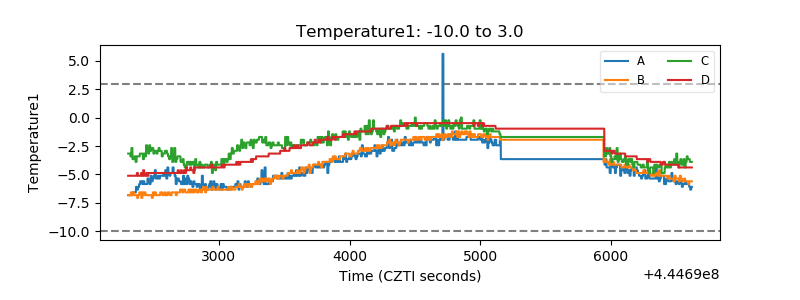 |
| Veto HV Monitor | 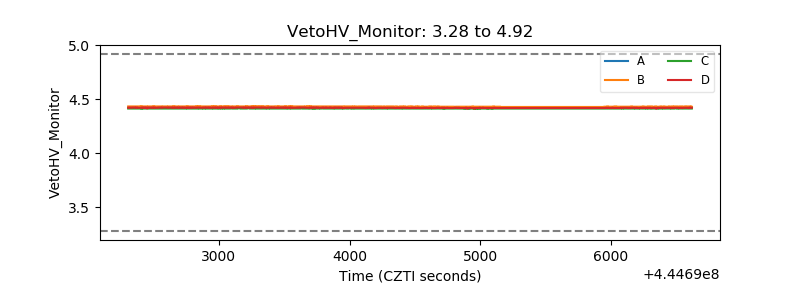 |
| Veto LLD | 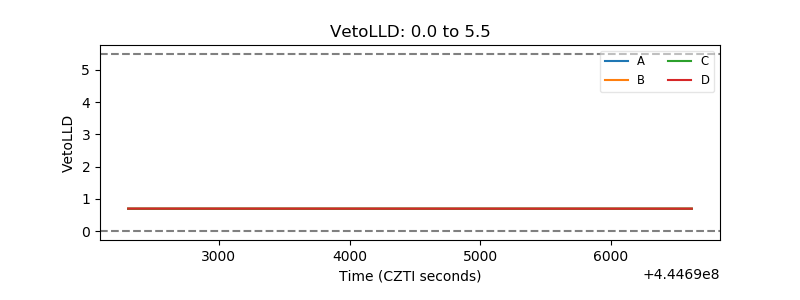 |
| Alpha Counter | 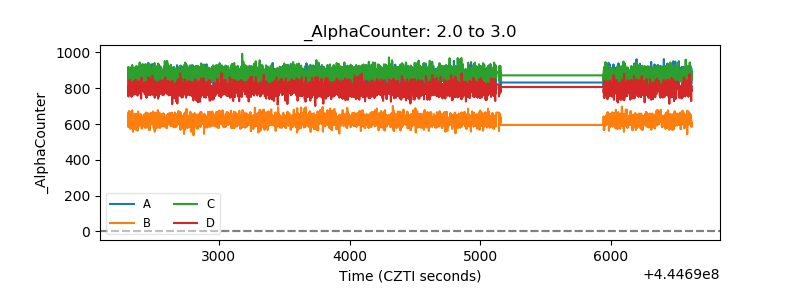 |
| _CPM_Rate | 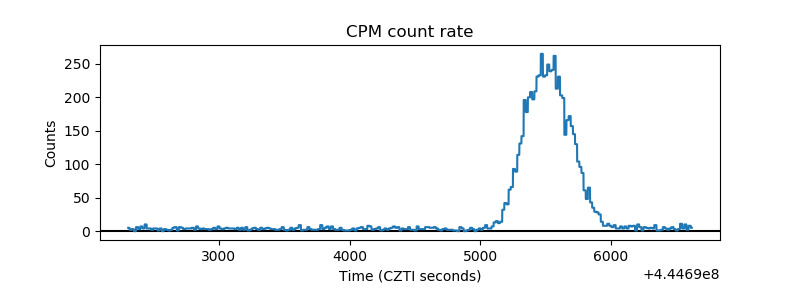 |
| CZT Counter | 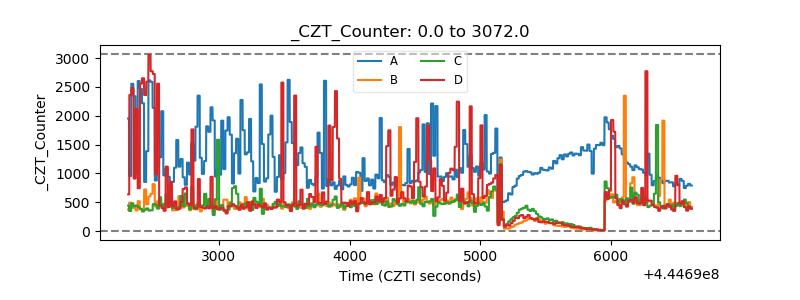 |
| +2.5 Volts monitor | 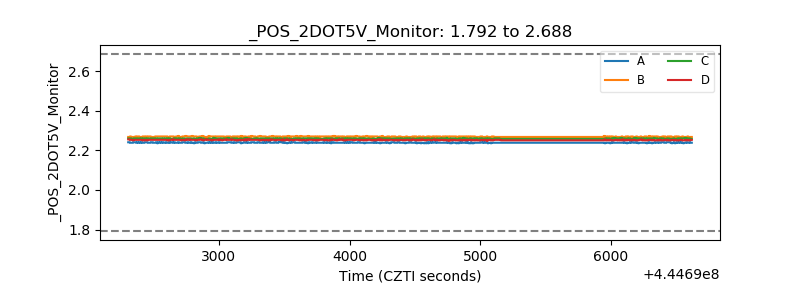 |
| +5 Volts monitor | 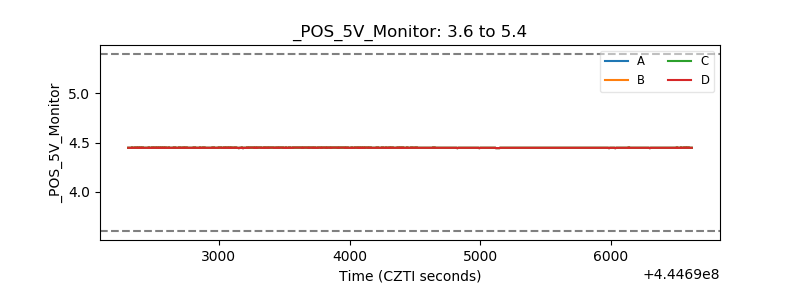 |
| _ROLL_ROT | 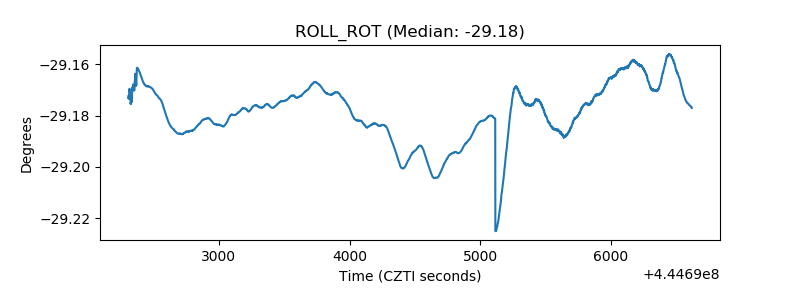 |
| _Roll_DEC | 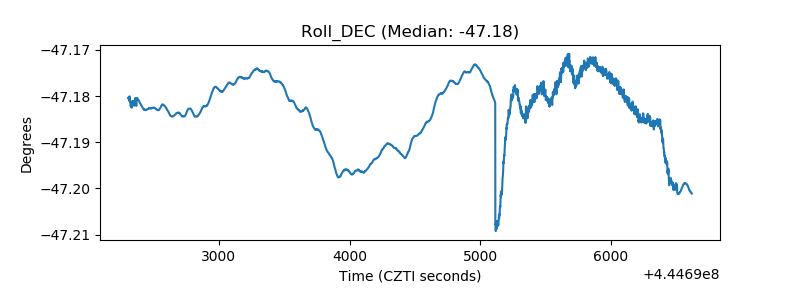 |
| _Roll_RA | 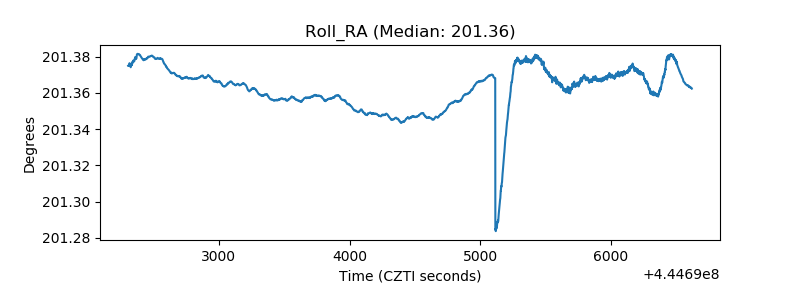 |
| Veto Counter | 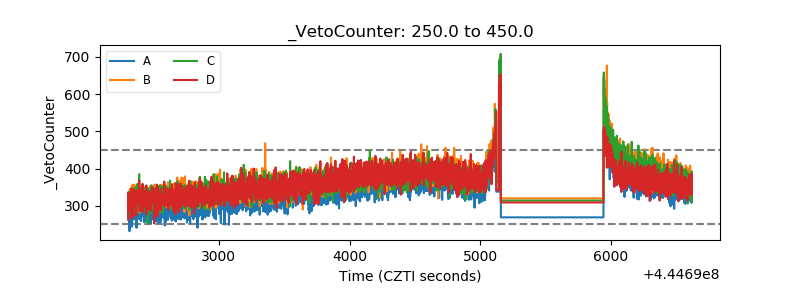 |