| Param | Original file | Final file |
|---|---|---|
| Filename | modeM0/AS1A13_049T05_9000006050_45168cztM0_level2.fits | modeM0/AS1A13_049T05_9000006050_45168cztM0_level2_quad_clean.evt |
| Size (bytes) | 417,464,640 | 100,506,240 |
| Size | 398.1 MB | 95.9 MB |
| Events in quadrant A | 4,827,294 | 667,095 |
| Events in quadrant B | 3,215,477 | 697,510 |
| Events in quadrant C | 2,832,071 | 673,297 |
| Events in quadrant D | 4,124,730 | 597,057 |
| Mode M0 | |||
|---|---|---|---|
| Quadrant | BADHDUFLAG | Total packets | Discarded packets |
| A | 0 | 18547 | 1 |
| B | 0 | 13352 | 1 |
| C | 0 | 12383 | 1 |
| D | 0 | 16238 | 1 |
| Mode M9 | |||
|---|---|---|---|
| Quadrant | BADHDUFLAG | Total packets | Discarded packets |
| A | 0 | 11 | 0 |
| B | 0 | 11 | 0 |
| C | 0 | 11 | 0 |
| D | 0 | 11 | 0 |
| Mode SS | |||
|---|---|---|---|
| Quadrant | BADHDUFLAG | Total packets | Discarded packets |
| A | 0 | 120 | 0 |
| B | 0 | 120 | 0 |
| C | 0 | 120 | 0 |
| D | 0 | 120 | 0 |
| Quadrant | Total seconds | Saturated seconds | Saturation percentage |
|---|---|---|---|
| A | 5840 | 87 | 1.489726% |
| B | 5840 | 99 | 1.695205% |
| C | 5841 | 33 | 0.564972% |
| D | 5841 | 238 | 4.074645% |
Noise dominated data is calculated using 1-second bins in cleaned event files. If a bin has >2000 counts, and if more than 50% of those come from <1% of pixels, then it is considered to be noise-dominated and hence unusable.
| Quadrant | # 1 sec bins | Bins with >0 counts | Bins with >2000 counts | High rate bins dominated by noise | Noise dominated (total time) | Noise dominated (detector-on time) | Marked lightcurve |
|---|---|---|---|---|---|---|---|
| A | 7010 | 5841 | 7 | 7 | 0.10% | 0.12% | 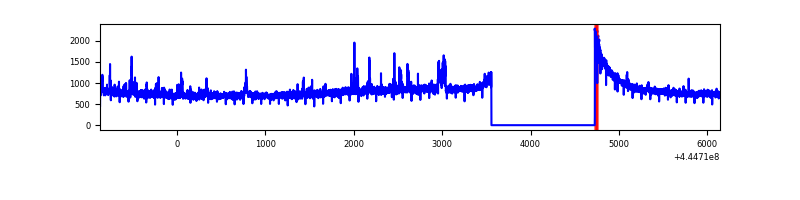 |
| B | 7010 | 5841 | 55 | 55 | 0.78% | 0.94% | 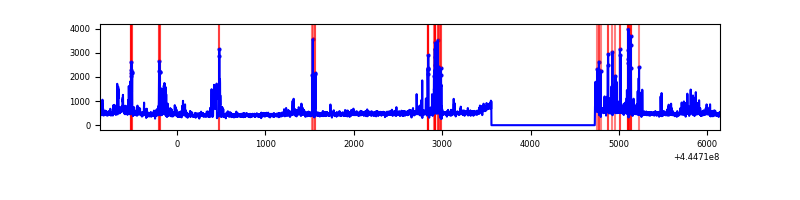 |
| C | 7011 | 5842 | 16 | 16 | 0.23% | 0.27% | 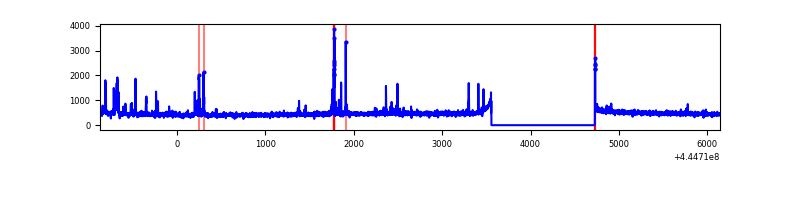 |
| D | 7011 | 5842 | 194 | 194 | 2.77% | 3.32% | 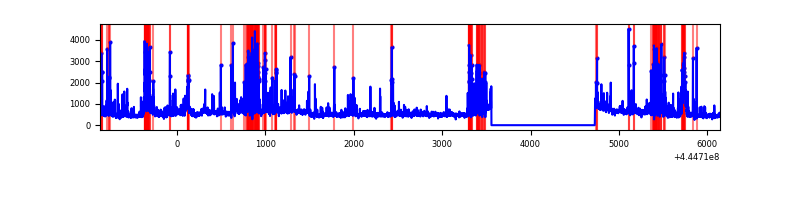 |
Top three noisy pixels from each quadrant. If the there are fewer than three noisy pixels in the level2.evt file, extra rows are filled as -1
| Pixel properties | Quadrant properties | ||||||
|---|---|---|---|---|---|---|---|
| Quadrant | DetID | PixID | Counts | Sigma | Mean | Median | Sigma |
| A | 10 | 83 | 2089771 | 15143.62 | 668 | 654 | 138.0 |
| A | 13 | 248 | 75833 | 544.96 | 668 | 654 | 138.0 |
| A | 15 | 223 | 56451 | 404.46 | 668 | 654 | 138.0 |
| B | 3 | 112 | 170410 | 1295.12 | 671 | 650 | 131.1 |
| B | 4 | 171 | 168137 | 1277.77 | 671 | 650 | 131.1 |
| B | 0 | 246 | 58969 | 444.92 | 671 | 650 | 131.1 |
| C | 12 | 2 | 60292 | 377.38 | 674 | 679 | 158.0 |
| C | 15 | 208 | 54743 | 342.25 | 674 | 679 | 158.0 |
| C | 14 | 254 | 35593 | 221.02 | 674 | 679 | 158.0 |
| D | 5 | 235 | 631278 | 3873.52 | 657 | 638 | 162.8 |
| D | 1 | 52 | 386756 | 2371.61 | 657 | 638 | 162.8 |
| D | 13 | 249 | 273756 | 1677.55 | 657 | 638 | 162.8 |
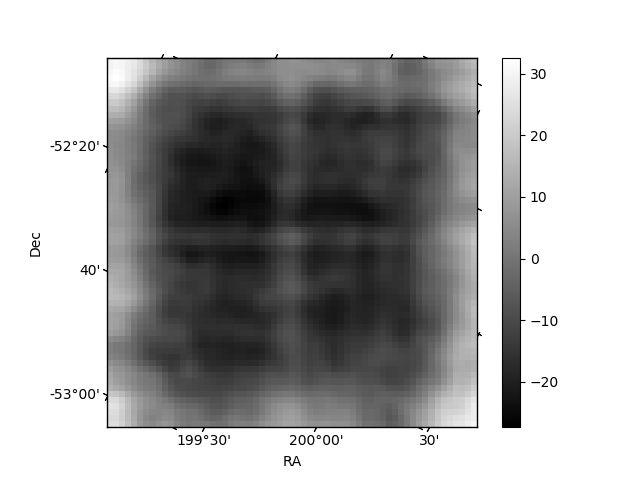
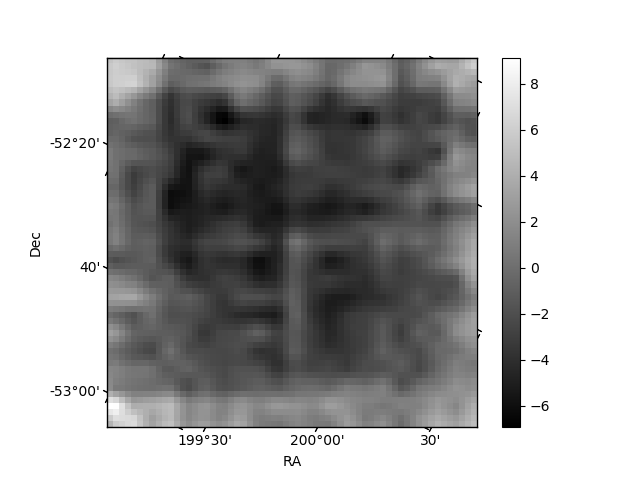
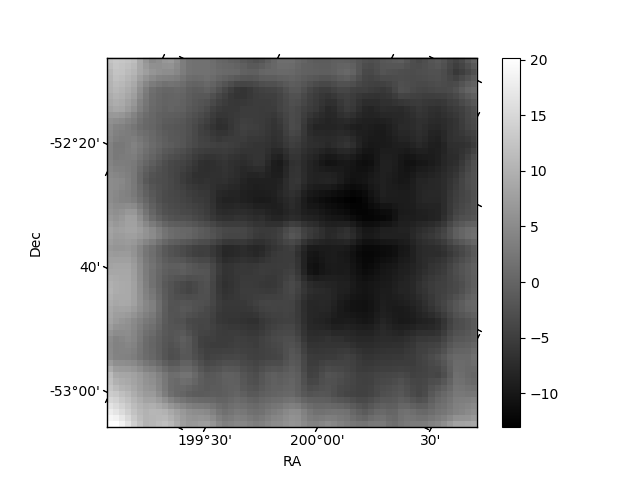
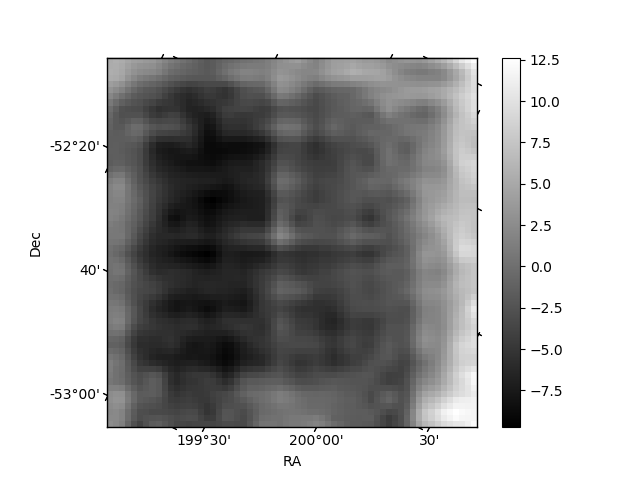
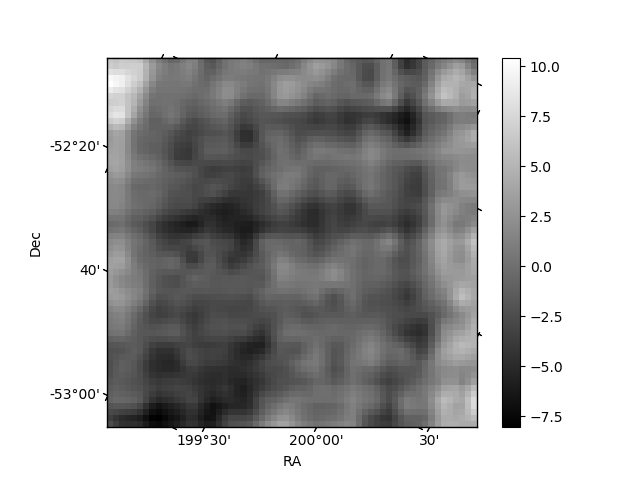
Histogram calculated using DETX and DETY for each event in the final _common_clean file
| Quadrant A | 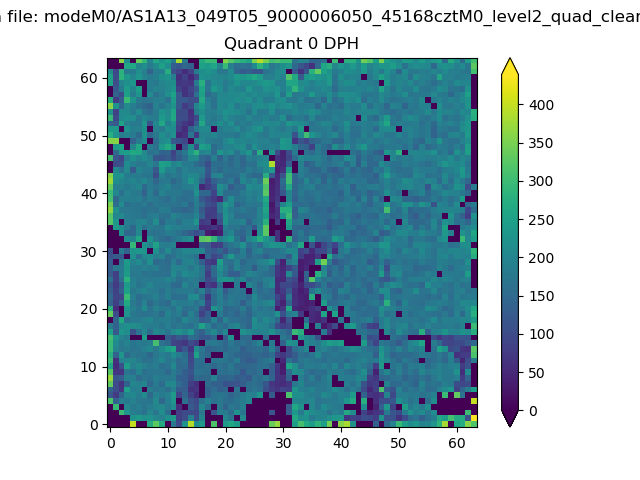 |
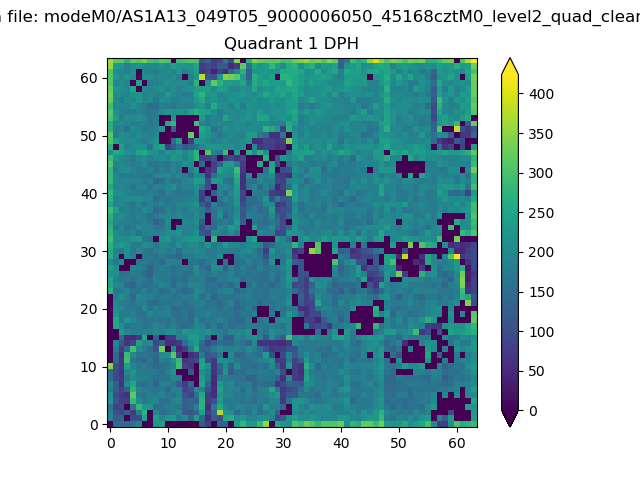 |
Quadrant B |
|---|---|---|---|
| Quadrant D | 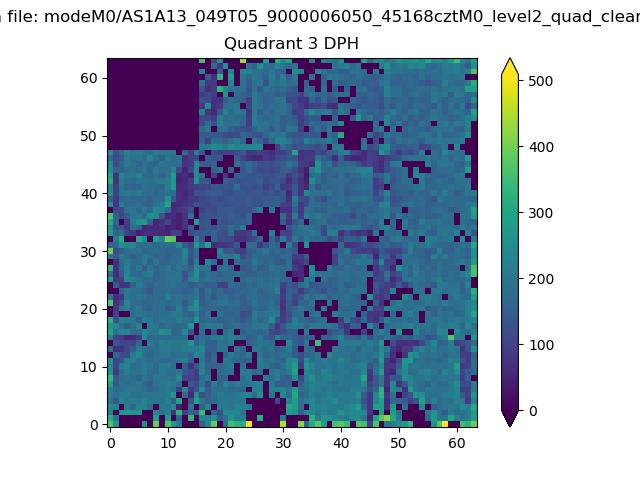 |
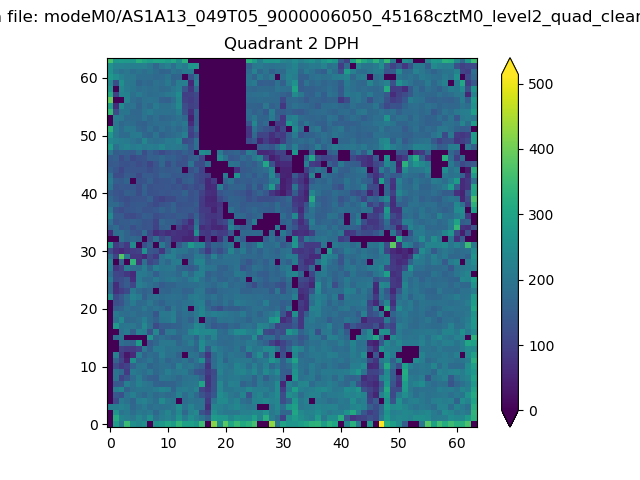 |
Quadrant C |
| Plot type | Count rate plots | Images |
|---|---|---|
| Comparison with Poisson distribution Blue bars denote a histogram of data divided into 1 sec bins. Red curve is a Poisson curve with rate = median count rate of data. |
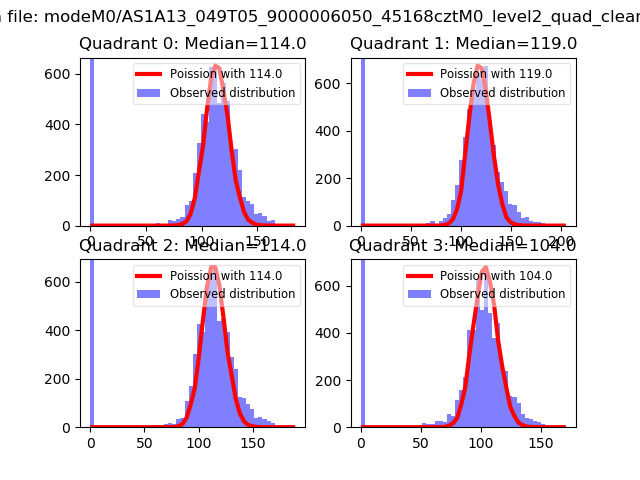 |
 |
| Quadrant-wise count rates Data is divided into 100 sec bins |
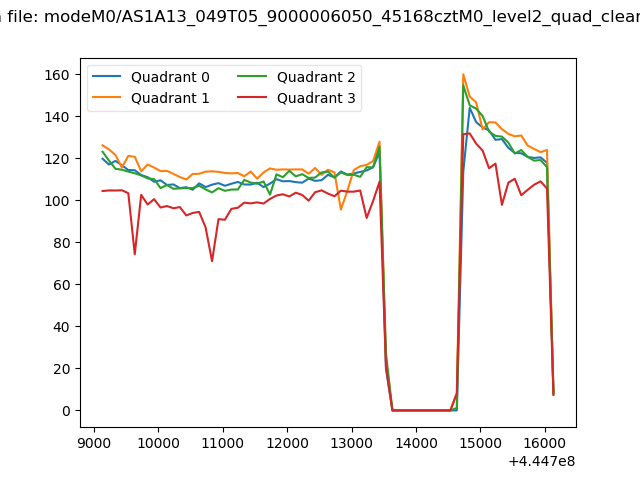 |
|
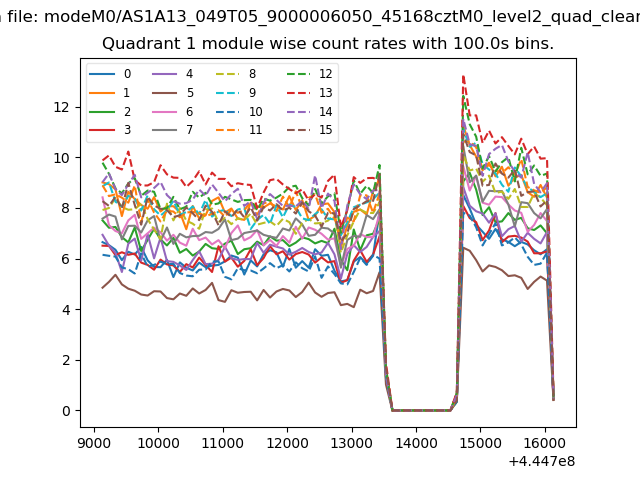
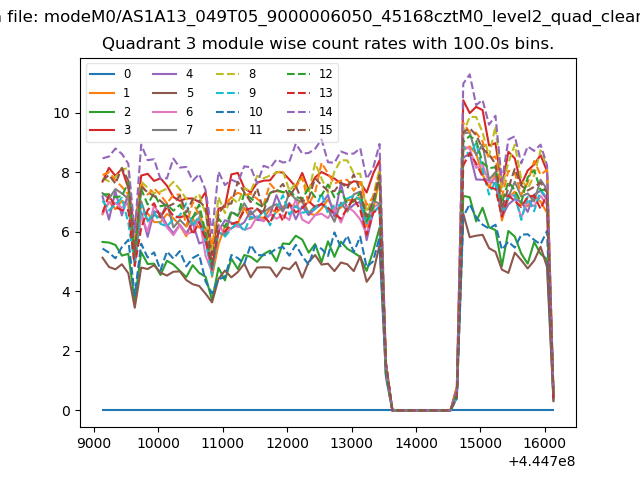
| Module-wise count rates for Quadrant A Data is divided into 100 sec bins |
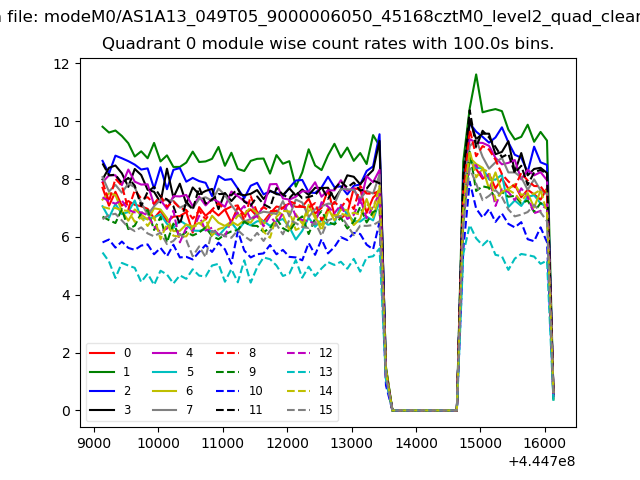 |
 |
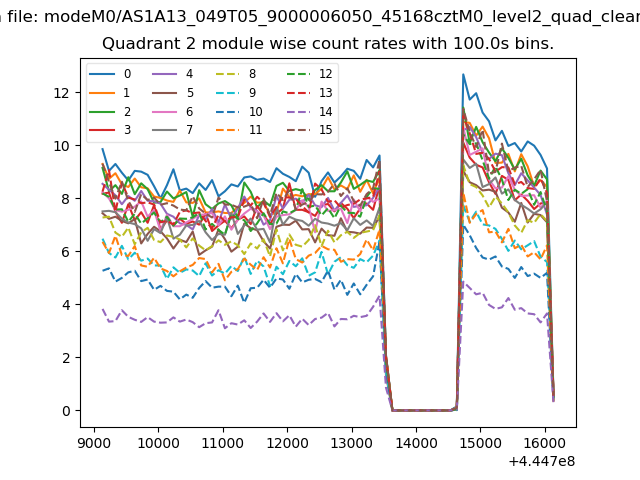
| Module-wise count rates for Quadrant B Data is divided into 100 sec bins |
 |
 |
| Module-wise count rates for Quadrant C Data is divided into 100 sec bins |
 |
 |
| Module-wise count rates for Quadrant D Data is divided into 100 sec bins |
 |
 |
| Parameter | Plot |
|---|---|
| CZT HV Monitor | 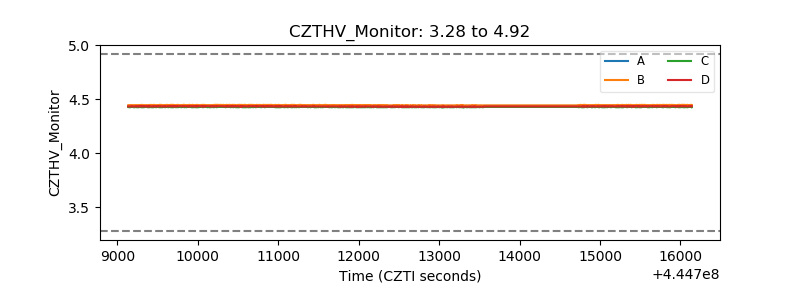 |
| D_VDD | 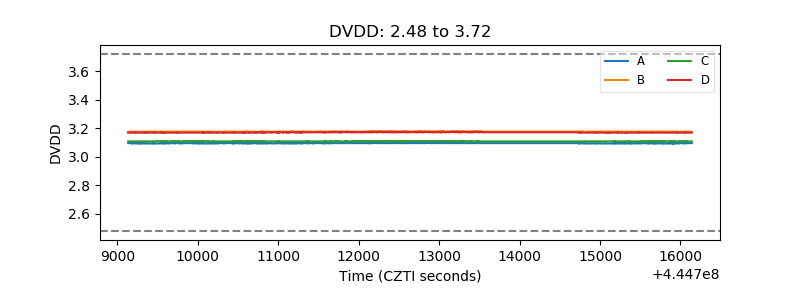 |
| Temperature 1 | 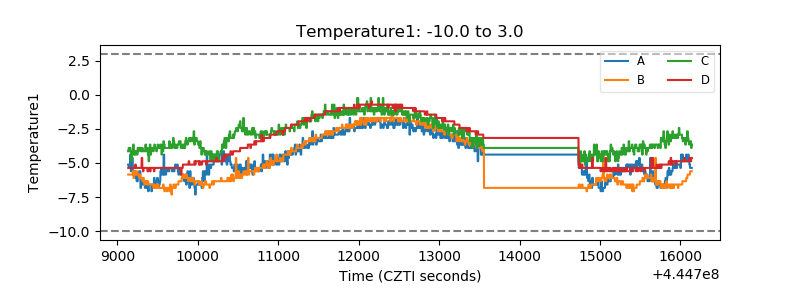 |
| Veto HV Monitor |  |
| Veto LLD | 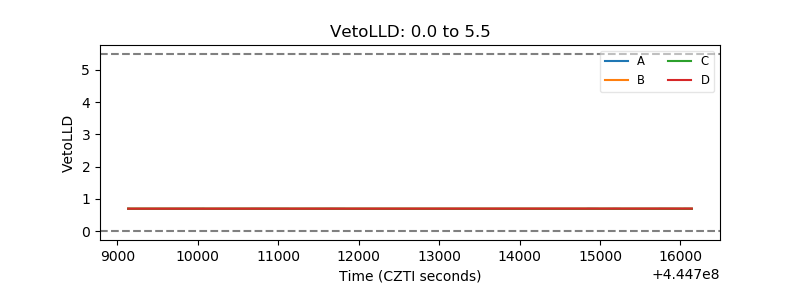 |
| Alpha Counter | 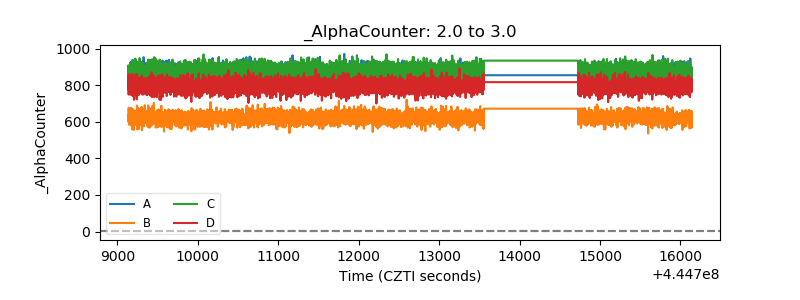 |
| _CPM_Rate | 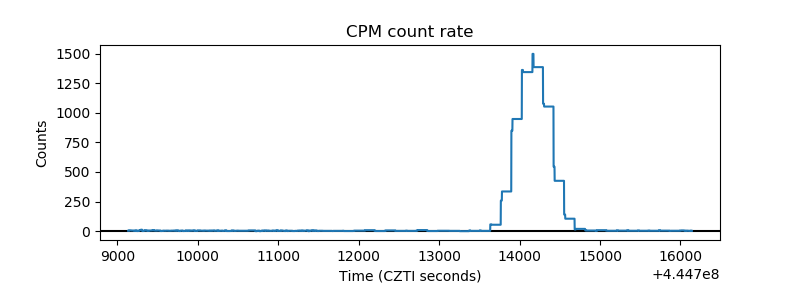 |
| CZT Counter | 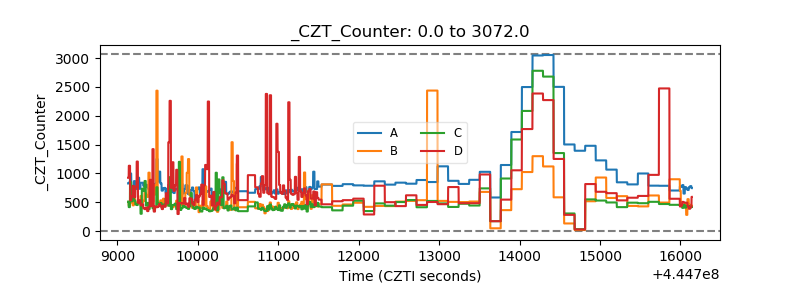 |
| +2.5 Volts monitor | 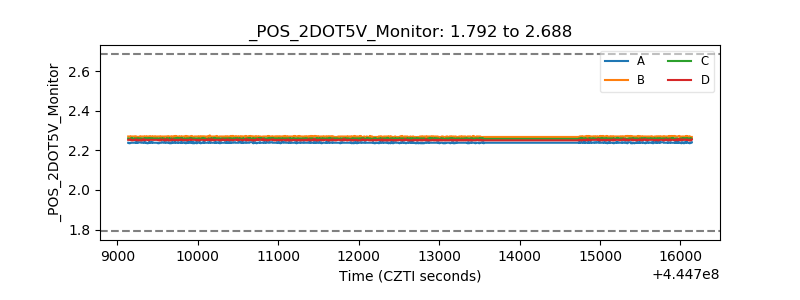 |
| +5 Volts monitor | 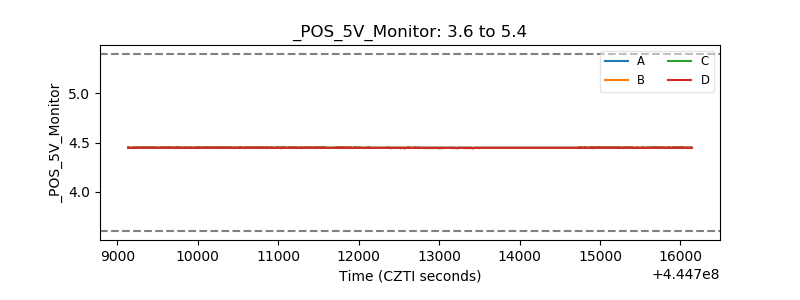 |
| _ROLL_ROT | 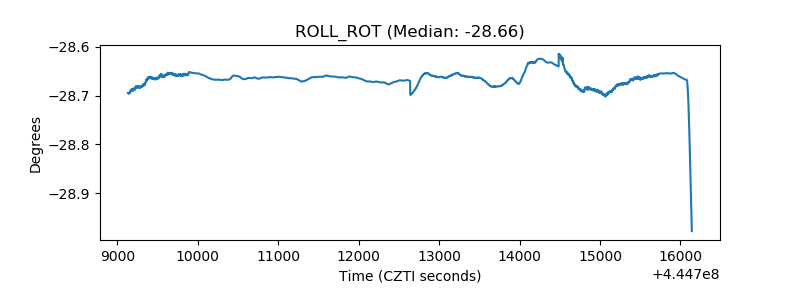 |
| _Roll_DEC | 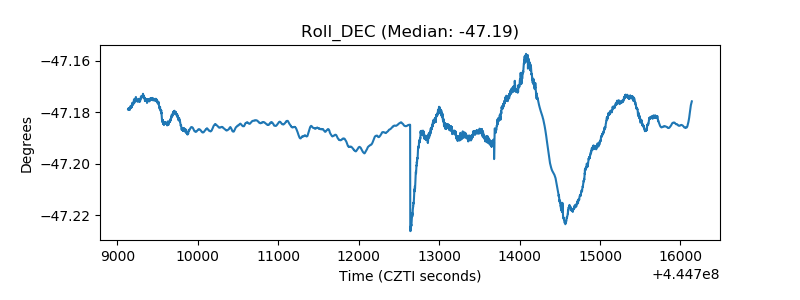 |
| _Roll_RA | 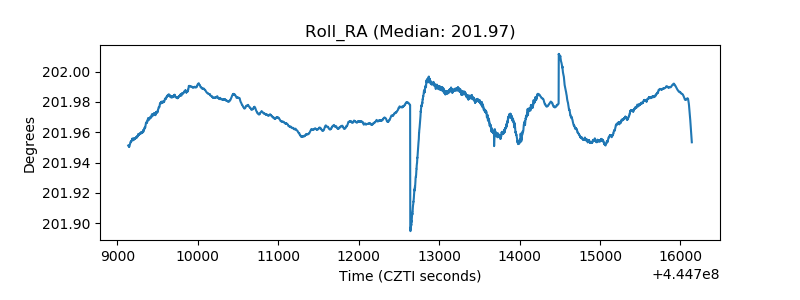 |
| Veto Counter | 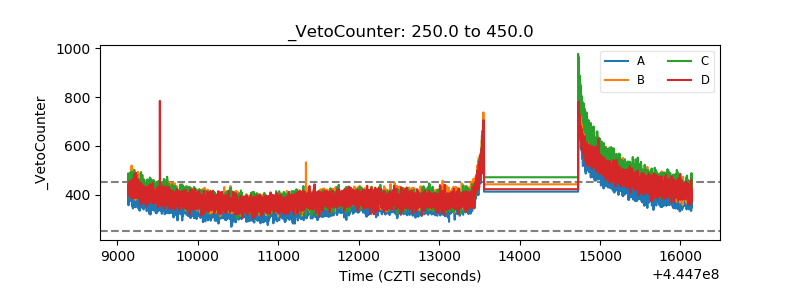 |