| Param | Original file | Final file |
|---|---|---|
| Filename | modeM0/AS1A13_049T05_9000006050_45169cztM0_level2.fits | modeM0/AS1A13_049T05_9000006050_45169cztM0_level2_quad_clean.evt |
| Size (bytes) | 510,575,040 | 112,268,160 |
| Size | 486.9 MB | 107.1 MB |
| Events in quadrant A | 6,195,238 | 724,572 |
| Events in quadrant B | 4,251,795 | 777,641 |
| Events in quadrant C | 3,050,677 | 773,269 |
| Events in quadrant D | 4,908,093 | 679,389 |
| Mode M0 | |||
|---|---|---|---|
| Quadrant | BADHDUFLAG | Total packets | Discarded packets |
| A | 0 | 23041 | 2 |
| B | 0 | 16930 | 2 |
| C | 0 | 13204 | 2 |
| D | 0 | 19045 | 2 |
| Mode M9 | |||
|---|---|---|---|
| Quadrant | BADHDUFLAG | Total packets | Discarded packets |
| A | 0 | 14 | 0 |
| B | 0 | 14 | 0 |
| C | 0 | 15 | 0 |
| D | 0 | 15 | 0 |
| Mode SS | |||
|---|---|---|---|
| Quadrant | BADHDUFLAG | Total packets | Discarded packets |
| A | 0 | 130 | 0 |
| B | 0 | 130 | 0 |
| C | 0 | 130 | 0 |
| D | 0 | 130 | 0 |
| Quadrant | Total seconds | Saturated seconds | Saturation percentage |
|---|---|---|---|
| A | 6371 | 422 | 6.623764% |
| B | 6371 | 276 | 4.332130% |
| C | 6371 | 24 | 0.376707% |
| D | 6371 | 299 | 4.693141% |
Noise dominated data is calculated using 1-second bins in cleaned event files. If a bin has >2000 counts, and if more than 50% of those come from <1% of pixels, then it is considered to be noise-dominated and hence unusable.
| Quadrant | # 1 sec bins | Bins with >0 counts | Bins with >2000 counts | High rate bins dominated by noise | Noise dominated (total time) | Noise dominated (detector-on time) | Marked lightcurve |
|---|---|---|---|---|---|---|---|
| A | 7586 | 6371 | 258 | 258 | 3.40% | 4.05% | 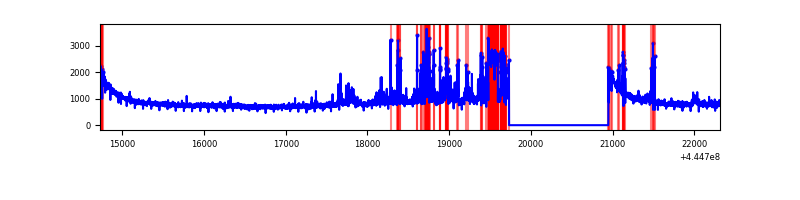 |
| B | 7586 | 6372 | 125 | 125 | 1.65% | 1.96% | 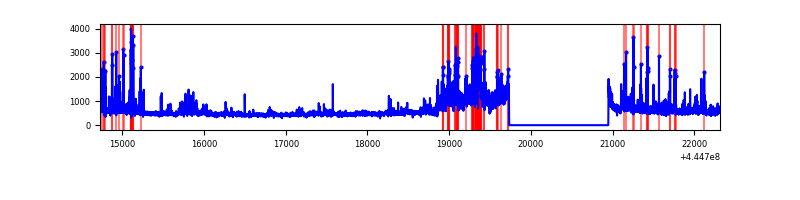 |
| C | 7586 | 6372 | 5 | 5 | 0.07% | 0.08% | 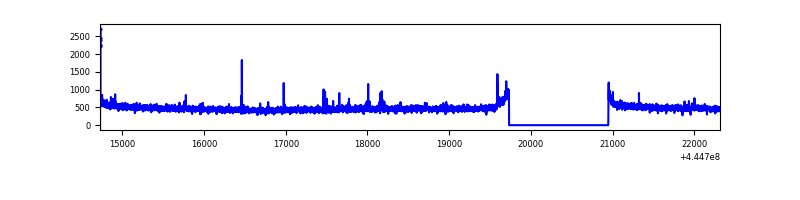 |
| D | 7586 | 6372 | 251 | 251 | 3.31% | 3.94% | 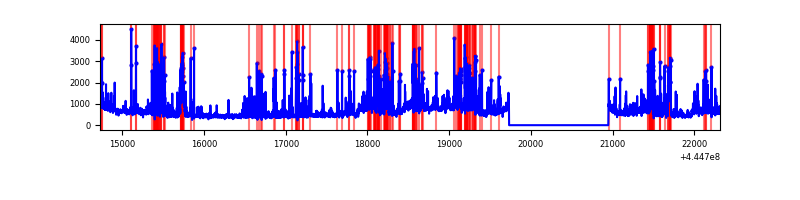 |
Top three noisy pixels from each quadrant. If the there are fewer than three noisy pixels in the level2.evt file, extra rows are filled as -1
| Pixel properties | Quadrant properties | ||||||
|---|---|---|---|---|---|---|---|
| Quadrant | DetID | PixID | Counts | Sigma | Mean | Median | Sigma |
| A | 10 | 83 | 2413187 | 15941.74 | 732 | 718 | 151.3 |
| A | 15 | 223 | 917349 | 6057.15 | 732 | 718 | 151.3 |
| A | 2 | 79 | 27028 | 173.86 | 732 | 718 | 151.3 |
| B | 3 | 112 | 612479 | 4264.52 | 750 | 726 | 143.5 |
| B | 4 | 171 | 408418 | 2842.02 | 750 | 726 | 143.5 |
| B | 0 | 183 | 76274 | 526.64 | 750 | 726 | 143.5 |
| C | 12 | 2 | 21339 | 115.42 | 764 | 770 | 178.2 |
| C | 2 | 14 | 20667 | 111.65 | 764 | 770 | 178.2 |
| C | 7 | 206 | 11435 | 59.85 | 764 | 770 | 178.2 |
| D | 13 | 249 | 584852 | 3224.68 | 740 | 720 | 181.1 |
| D | 1 | 52 | 563917 | 3109.11 | 740 | 720 | 181.1 |
| D | 5 | 235 | 426017 | 2347.84 | 740 | 720 | 181.1 |
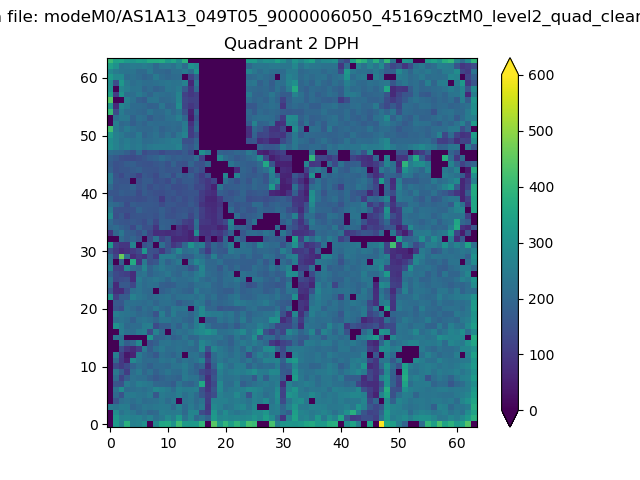
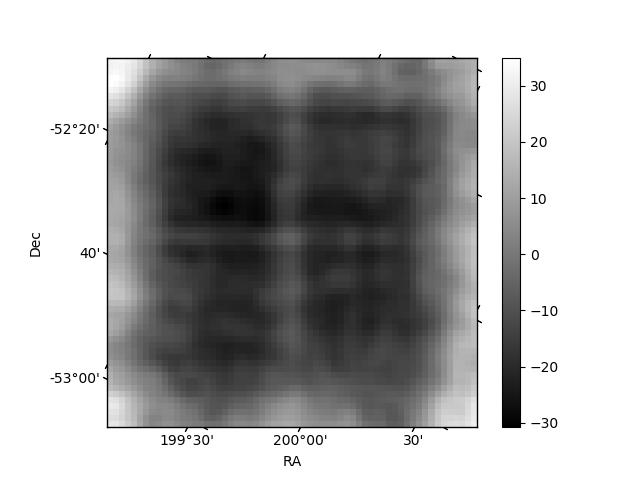
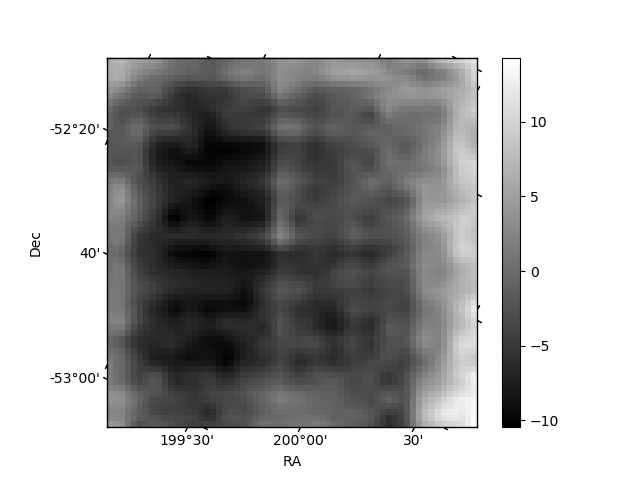
Histogram calculated using DETX and DETY for each event in the final _common_clean file
| Quadrant A | 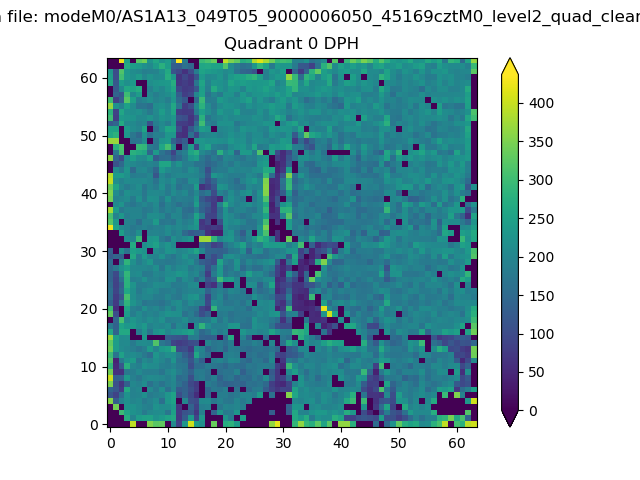 |
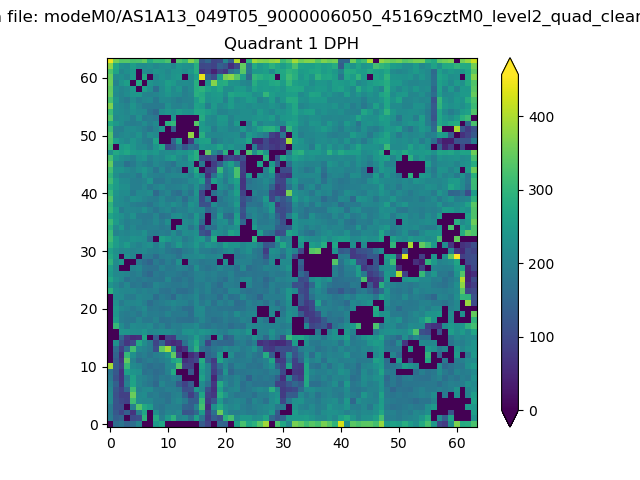 |
Quadrant B |
|---|---|---|---|
| Quadrant D | 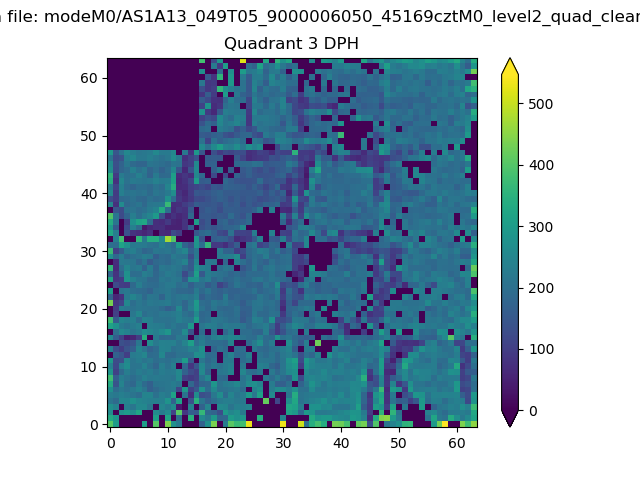 |
 |
Quadrant C |
| Plot type | Count rate plots | Images |
|---|---|---|
| Comparison with Poisson distribution Blue bars denote a histogram of data divided into 1 sec bins. Red curve is a Poisson curve with rate = median count rate of data. |
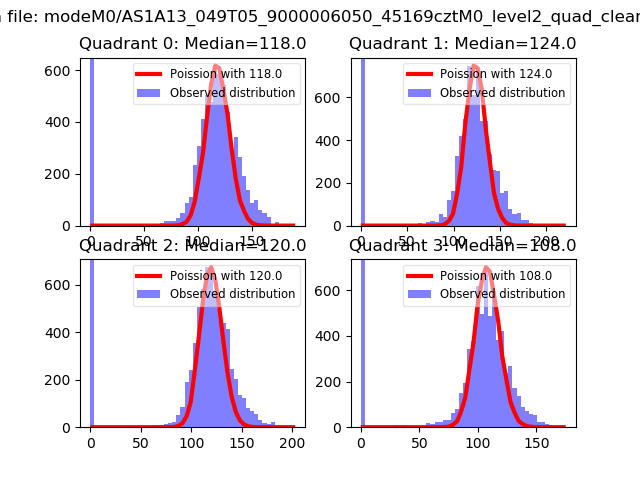 |
 |
| Quadrant-wise count rates Data is divided into 100 sec bins |
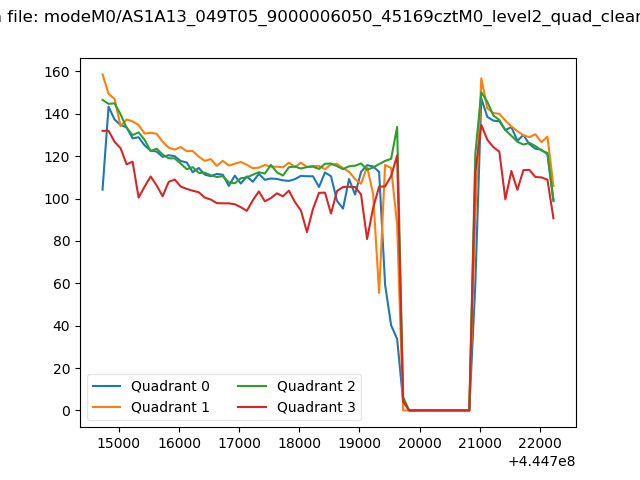 |
|
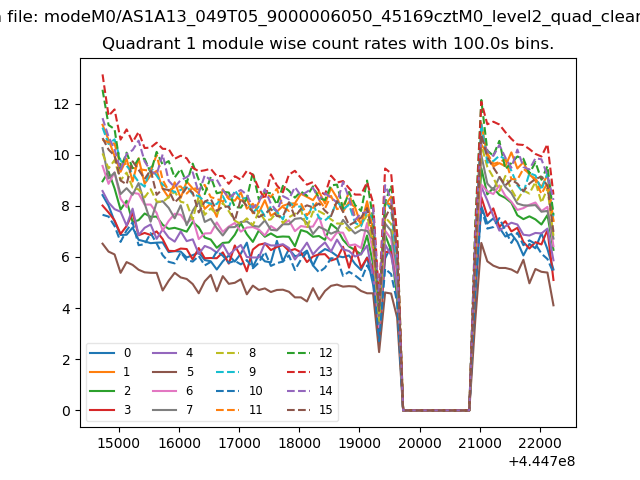
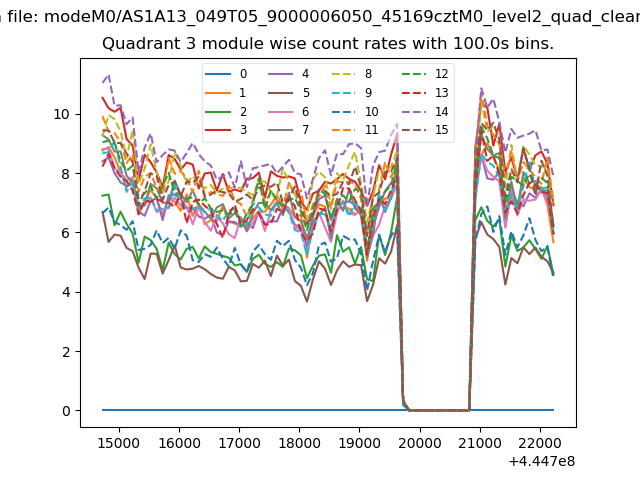
| Module-wise count rates for Quadrant A Data is divided into 100 sec bins |
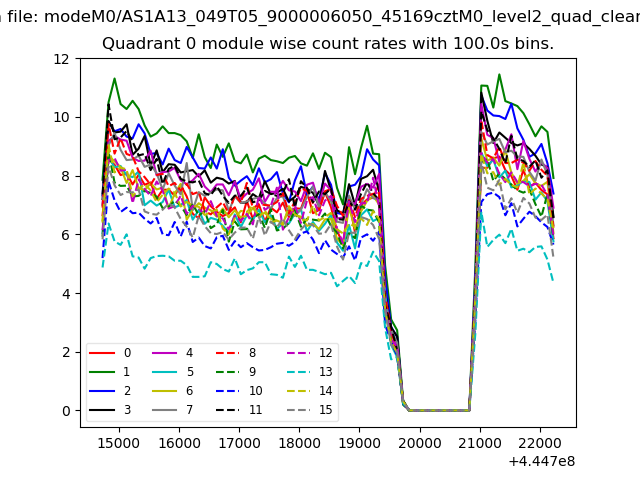 |
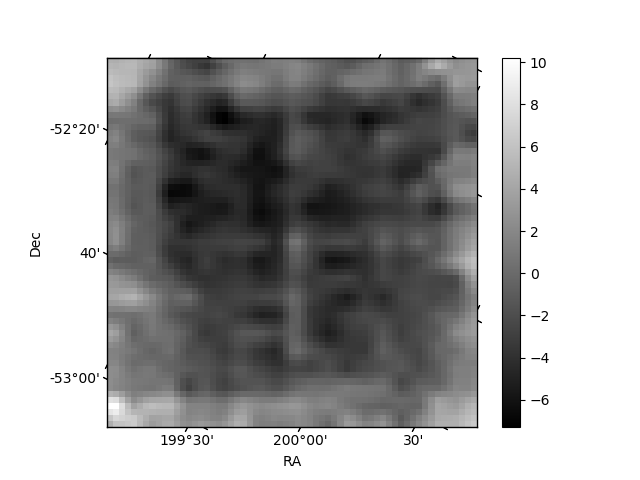 |
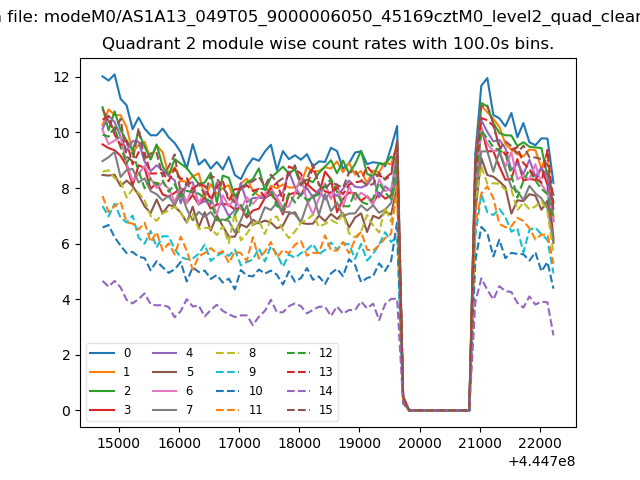
| Module-wise count rates for Quadrant B Data is divided into 100 sec bins |
 |
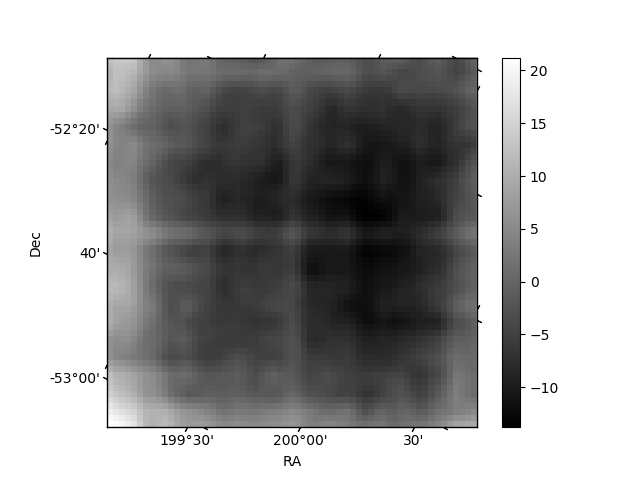 |
| Module-wise count rates for Quadrant C Data is divided into 100 sec bins |
 |
 |
| Module-wise count rates for Quadrant D Data is divided into 100 sec bins |
 |
 |
| Parameter | Plot |
|---|---|
| CZT HV Monitor | 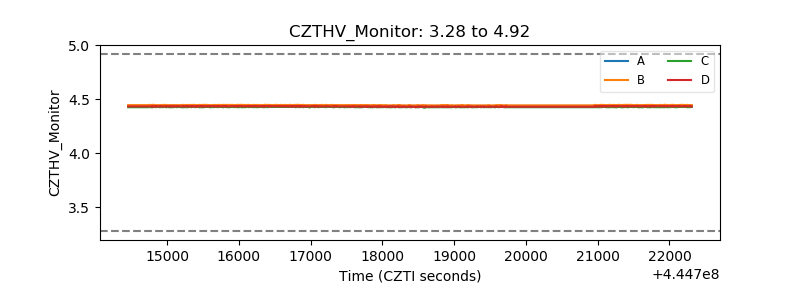 |
| D_VDD | 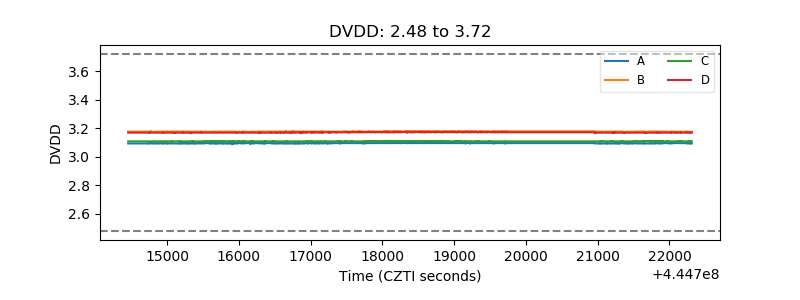 |
| Temperature 1 | 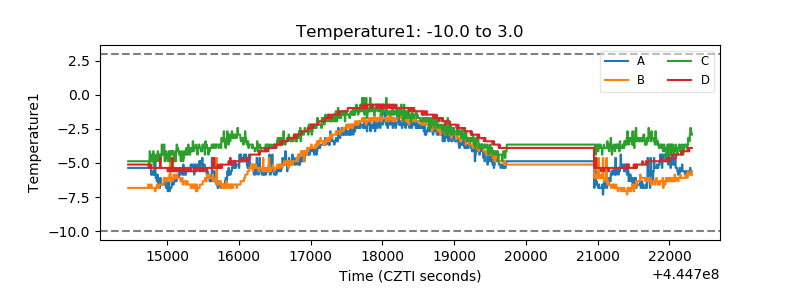 |
| Veto HV Monitor | 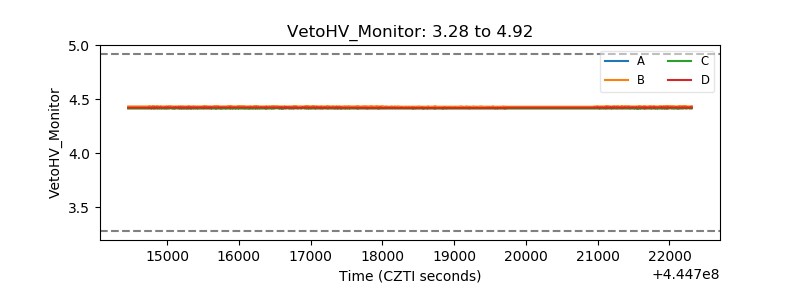 |
| Veto LLD | 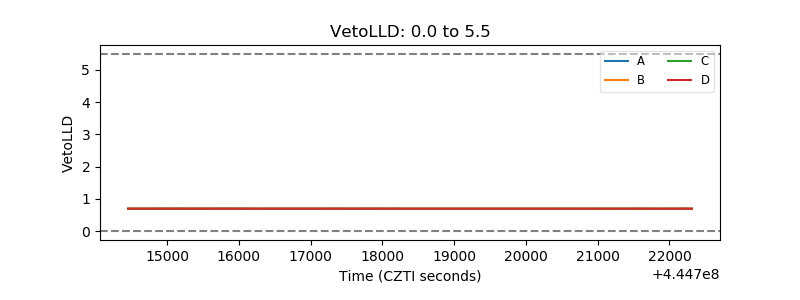 |
| Alpha Counter | 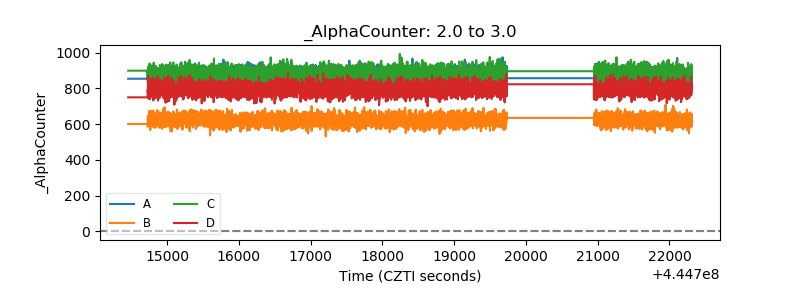 |
| _CPM_Rate | 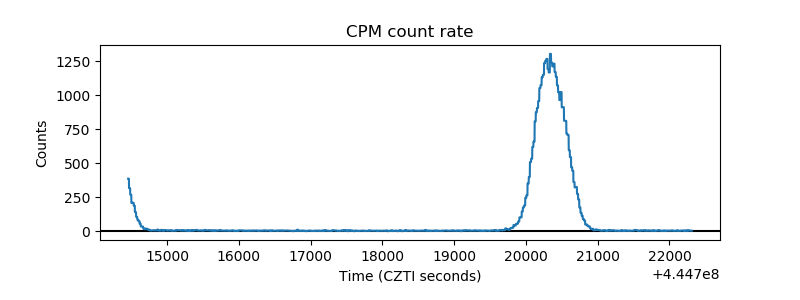 |
| CZT Counter | 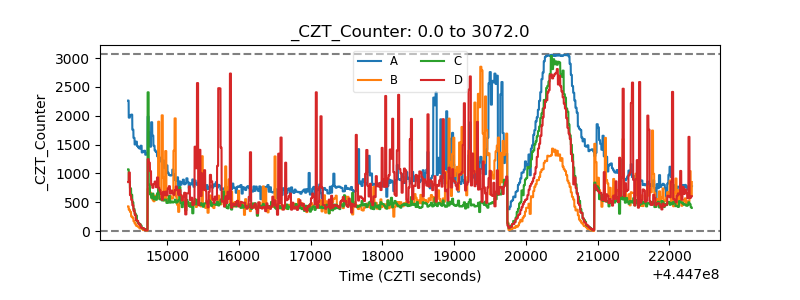 |
| +2.5 Volts monitor | 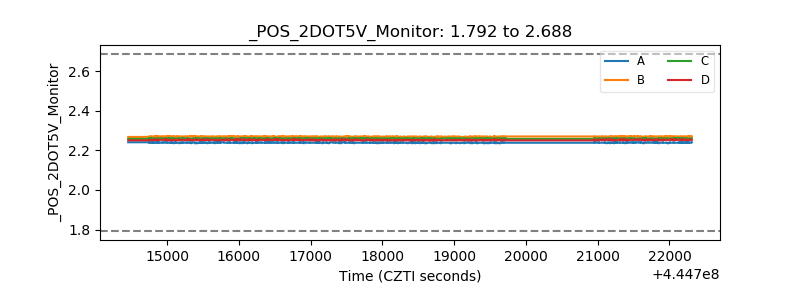 |
| +5 Volts monitor | 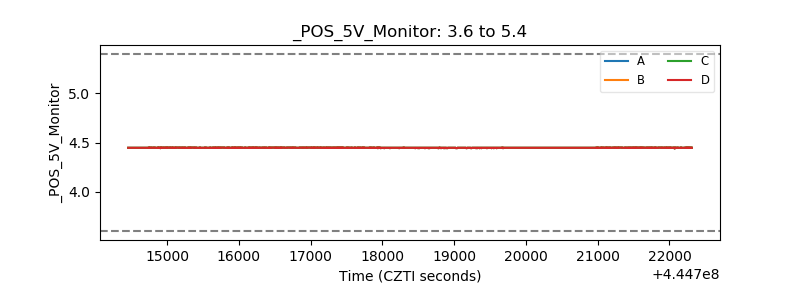 |
| _ROLL_ROT | 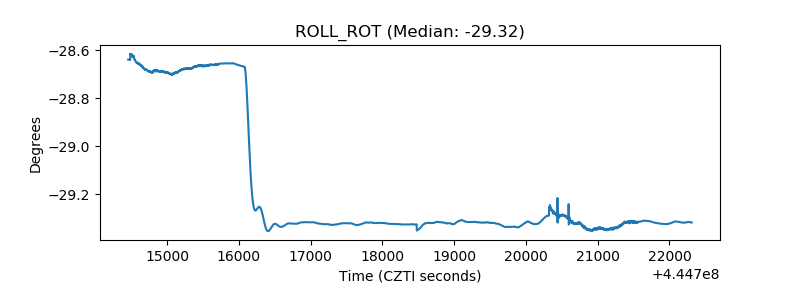 |
| _Roll_DEC | 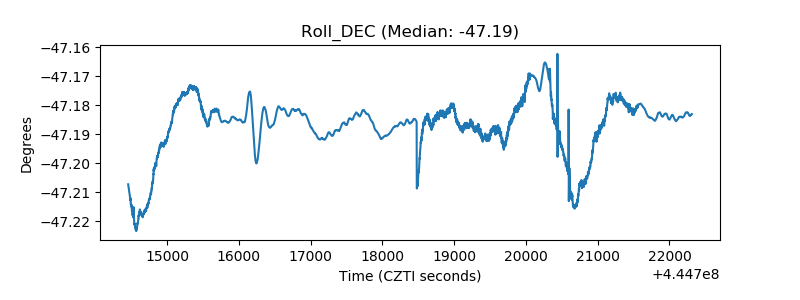 |
| _Roll_RA | 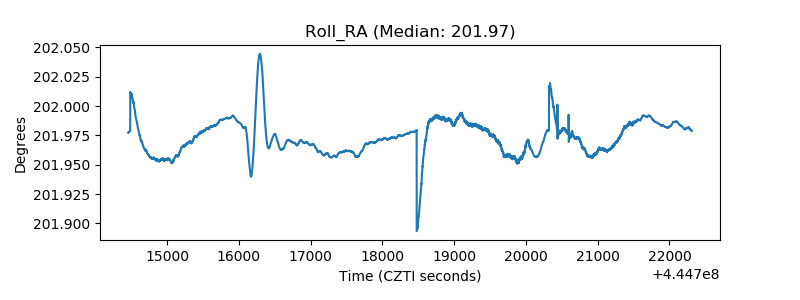 |
| Veto Counter | 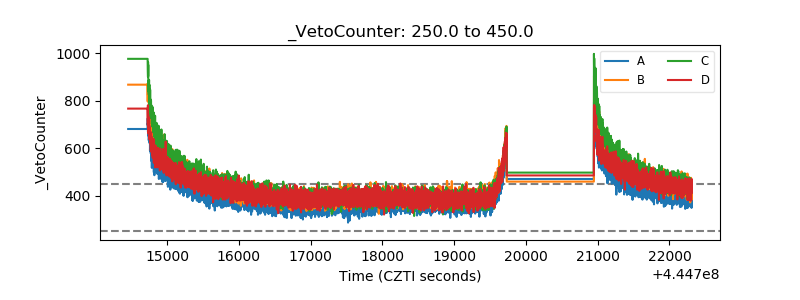 |