| Param | Original file | Final file |
|---|---|---|
| Filename | modeM0/AS1A13_049T05_9000006050_45170cztM0_level2.fits | modeM0/AS1A13_049T05_9000006050_45170cztM0_level2_quad_clean.evt |
| Size (bytes) | 534,093,120 | 106,554,240 |
| Size | 509.4 MB | 101.6 MB |
| Events in quadrant A | 6,207,796 | 687,887 |
| Events in quadrant B | 4,577,042 | 752,644 |
| Events in quadrant C | 3,024,615 | 733,683 |
| Events in quadrant D | 5,485,850 | 624,245 |
| Mode M0 | |||
|---|---|---|---|
| Quadrant | BADHDUFLAG | Total packets | Discarded packets |
| A | 0 | 22669 | 4 |
| B | 0 | 17883 | 1 |
| C | 0 | 12906 | 2 |
| D | 0 | 20512 | 1 |
| Mode M9 | |||
|---|---|---|---|
| Quadrant | BADHDUFLAG | Total packets | Discarded packets |
| A | 0 | 12 | 0 |
| B | 0 | 12 | 0 |
| C | 0 | 12 | 0 |
| D | 0 | 12 | 0 |
| Mode SS | |||
|---|---|---|---|
| Quadrant | BADHDUFLAG | Total packets | Discarded packets |
| A | 0 | 124 | 0 |
| B | 0 | 124 | 0 |
| C | 0 | 124 | 0 |
| D | 0 | 124 | 0 |
| Quadrant | Total seconds | Saturated seconds | Saturation percentage |
|---|---|---|---|
| A | 6131 | 490 | 7.992171% |
| B | 6132 | 140 | 2.283105% |
| C | 6132 | 40 | 0.652316% |
| D | 6133 | 509 | 8.299364% |
Noise dominated data is calculated using 1-second bins in cleaned event files. If a bin has >2000 counts, and if more than 50% of those come from <1% of pixels, then it is considered to be noise-dominated and hence unusable.
| Quadrant | # 1 sec bins | Bins with >0 counts | Bins with >2000 counts | High rate bins dominated by noise | Noise dominated (total time) | Noise dominated (detector-on time) | Marked lightcurve |
|---|---|---|---|---|---|---|---|
| A | 7347 | 6133 | 284 | 284 | 3.87% | 4.63% | 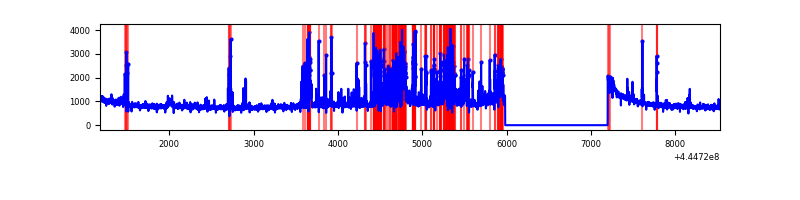 |
| B | 7347 | 6133 | 40 | 40 | 0.54% | 0.65% | 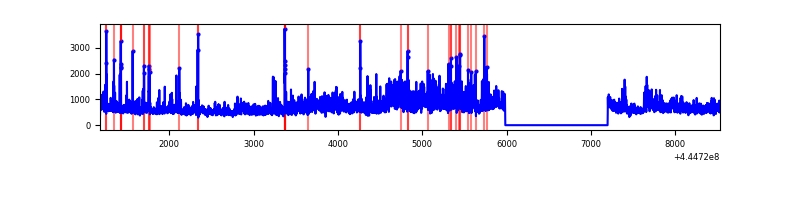 |
| C | 7348 | 6134 | 19 | 19 | 0.26% | 0.31% | 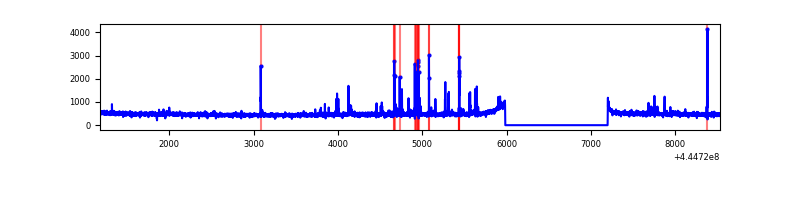 |
| D | 7348 | 6134 | 461 | 461 | 6.27% | 7.52% | 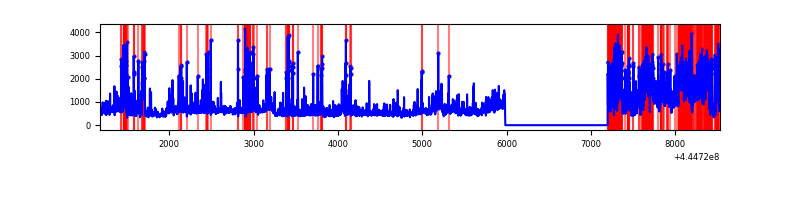 |
Top three noisy pixels from each quadrant. If the there are fewer than three noisy pixels in the level2.evt file, extra rows are filled as -1
| Pixel properties | Quadrant properties | ||||||
|---|---|---|---|---|---|---|---|
| Quadrant | DetID | PixID | Counts | Sigma | Mean | Median | Sigma |
| A | 10 | 83 | 2216528 | 15163.43 | 707 | 693 | 146.1 |
| A | 15 | 223 | 1117360 | 7641.59 | 707 | 693 | 146.1 |
| A | 15 | 174 | 76954 | 521.87 | 707 | 693 | 146.1 |
| B | 3 | 112 | 1350467 | 9676.57 | 722 | 700 | 139.5 |
| B | 4 | 171 | 100795 | 717.59 | 722 | 700 | 139.5 |
| B | 5 | 32 | 62276 | 441.44 | 722 | 700 | 139.5 |
| C | 12 | 2 | 48174 | 276.92 | 729 | 734 | 171.3 |
| C | 3 | 233 | 36716 | 210.04 | 729 | 734 | 171.3 |
| C | 2 | 14 | 33776 | 192.88 | 729 | 734 | 171.3 |
| D | 8 | 230 | 717085 | 4080.39 | 704 | 684 | 175.6 |
| D | 5 | 235 | 597896 | 3401.53 | 704 | 684 | 175.6 |
| D | 13 | 249 | 495264 | 2816.97 | 704 | 684 | 175.6 |
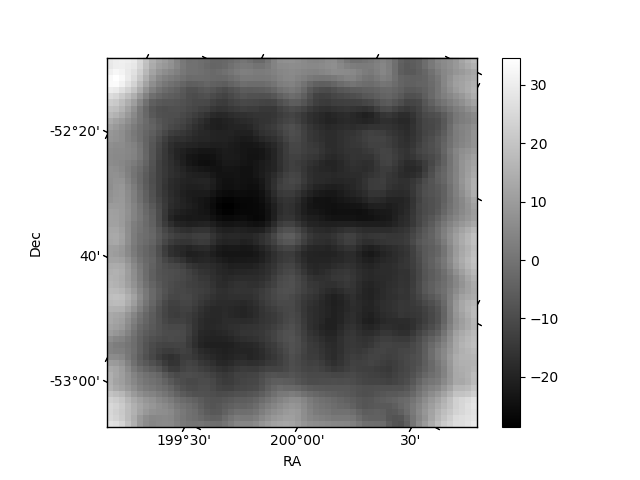
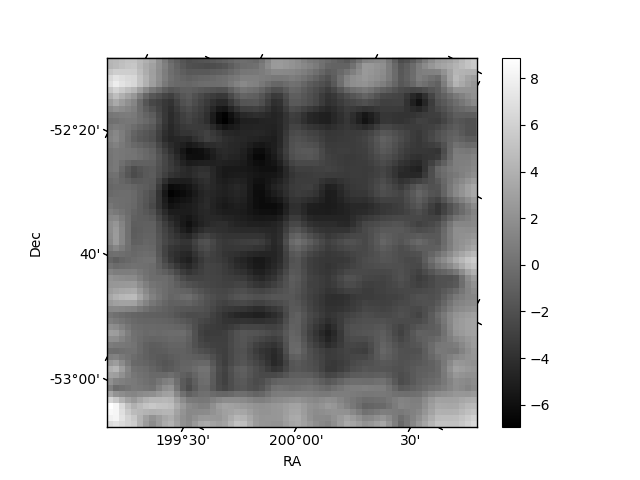
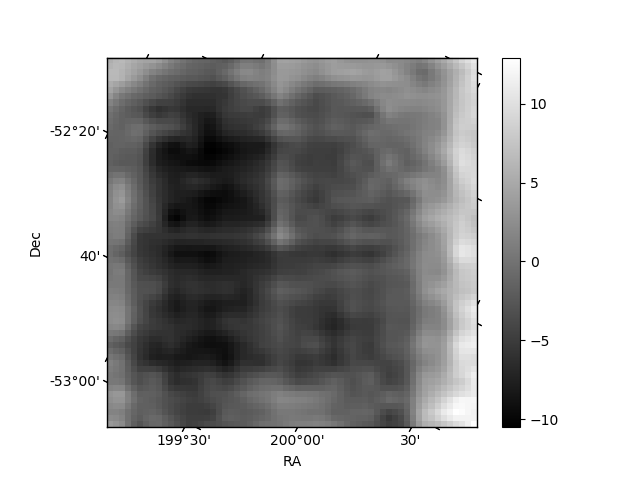
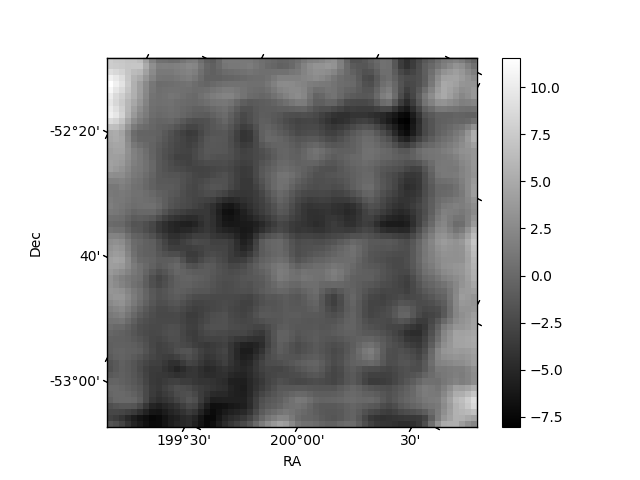
Histogram calculated using DETX and DETY for each event in the final _common_clean file
| Quadrant A | 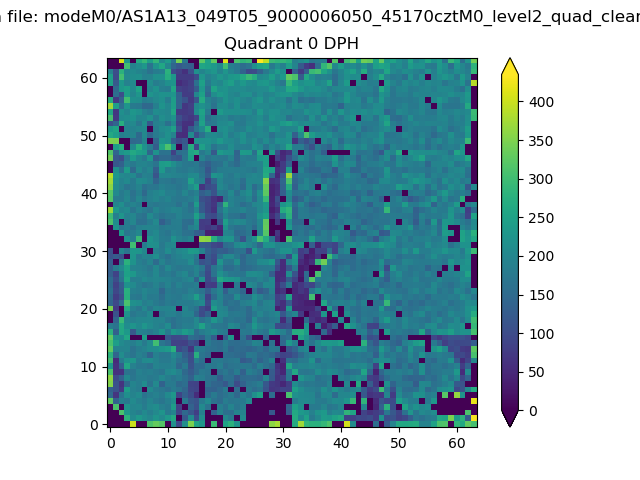 |
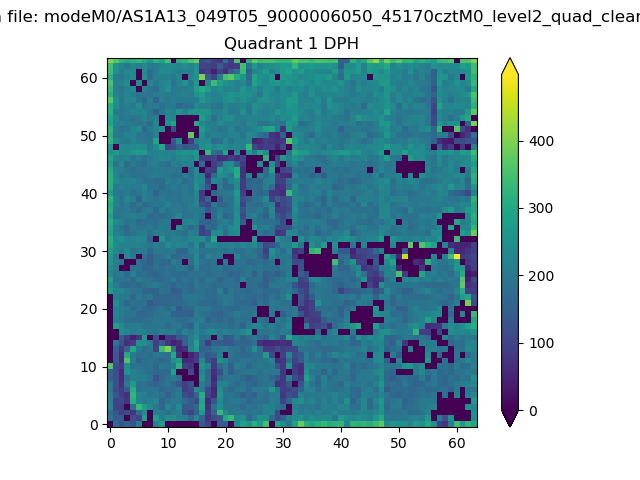 |
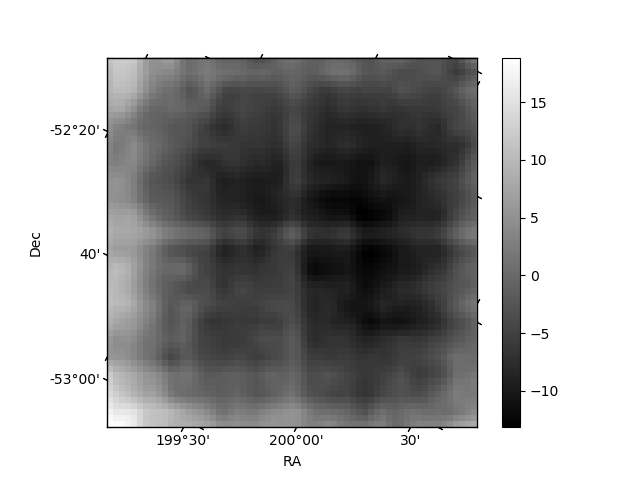
Quadrant B |
|---|---|---|---|
| Quadrant D | 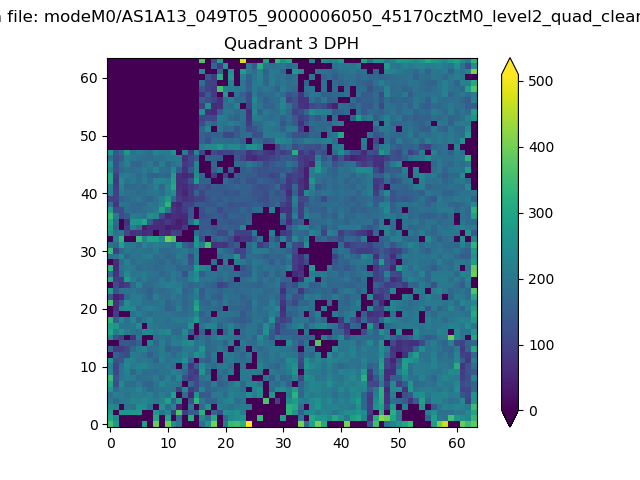 |
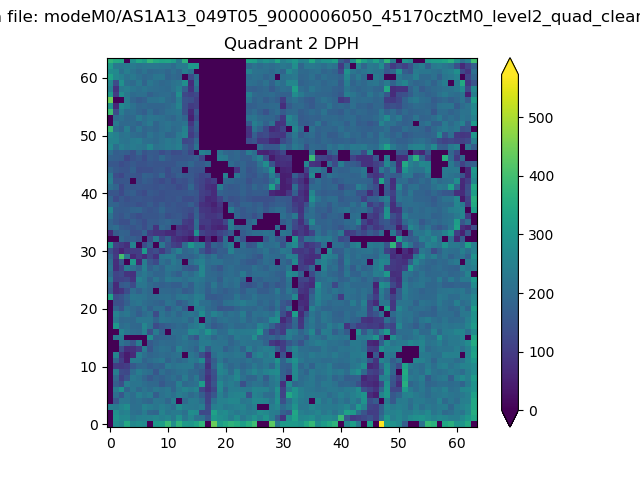 |
Quadrant C |
| Plot type | Count rate plots | Images |
|---|---|---|
| Comparison with Poisson distribution Blue bars denote a histogram of data divided into 1 sec bins. Red curve is a Poisson curve with rate = median count rate of data. |
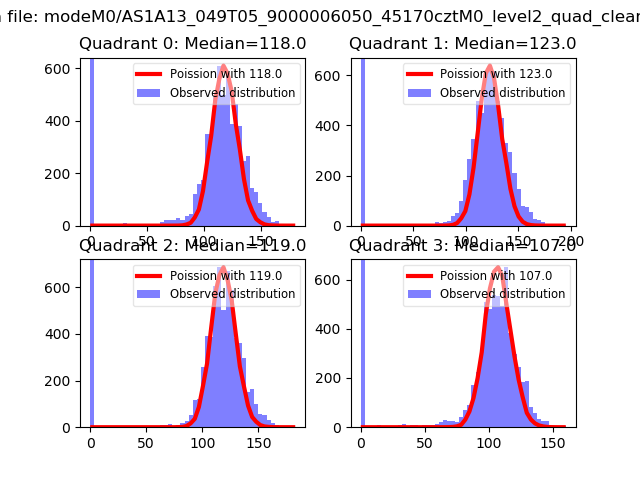 |
 |
| Quadrant-wise count rates Data is divided into 100 sec bins |
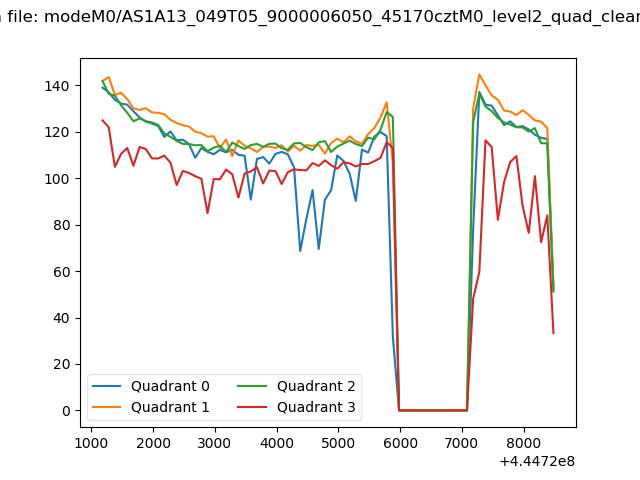 |
|
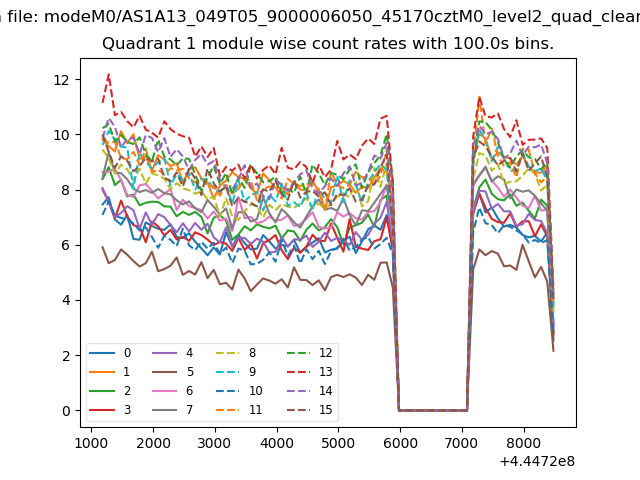
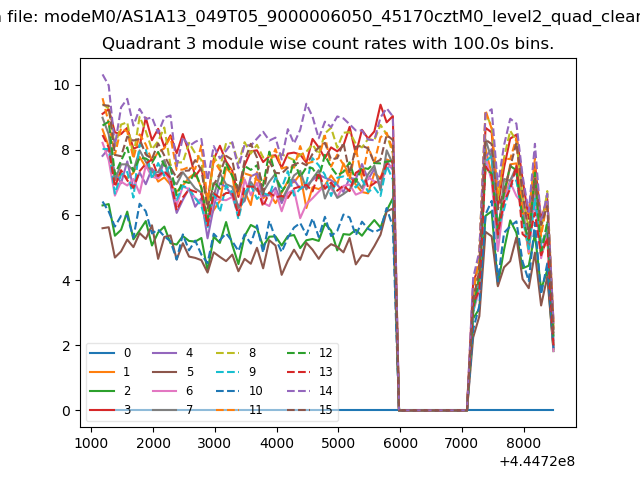
| Module-wise count rates for Quadrant A Data is divided into 100 sec bins |
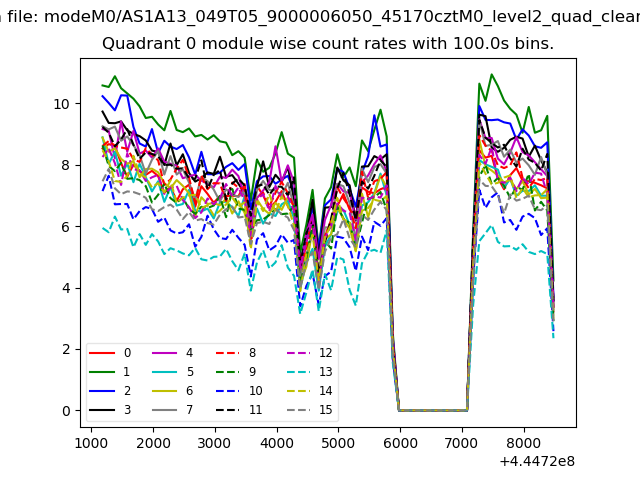 |
 |
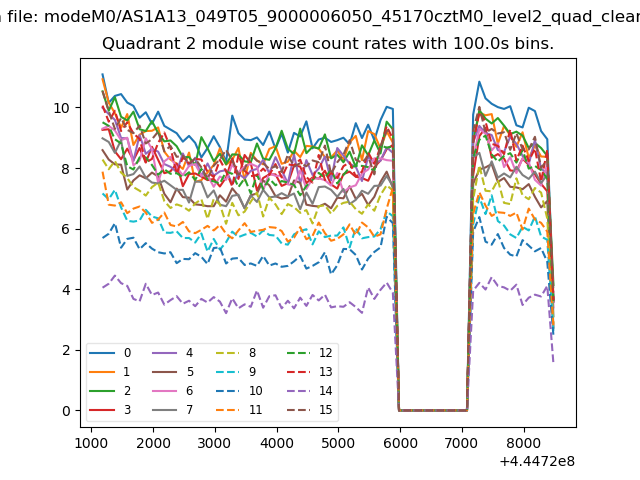
| Module-wise count rates for Quadrant B Data is divided into 100 sec bins |
 |
 |
| Module-wise count rates for Quadrant C Data is divided into 100 sec bins |
 |
 |
| Module-wise count rates for Quadrant D Data is divided into 100 sec bins |
 |
 |
| Parameter | Plot |
|---|---|
| CZT HV Monitor | 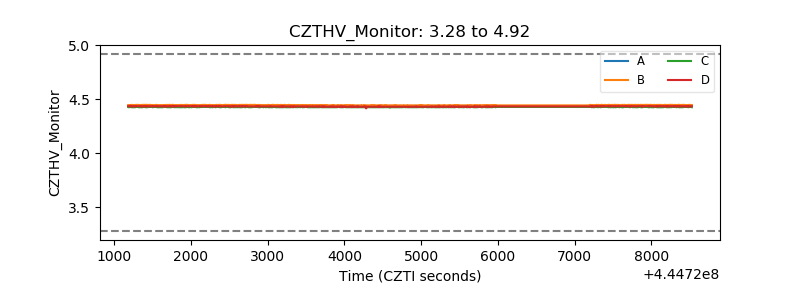 |
| D_VDD | 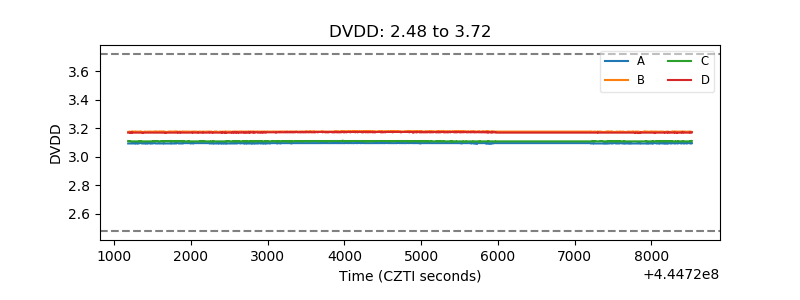 |
| Temperature 1 | 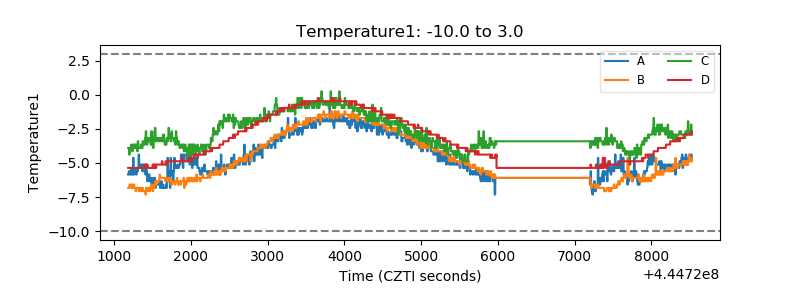 |
| Veto HV Monitor | 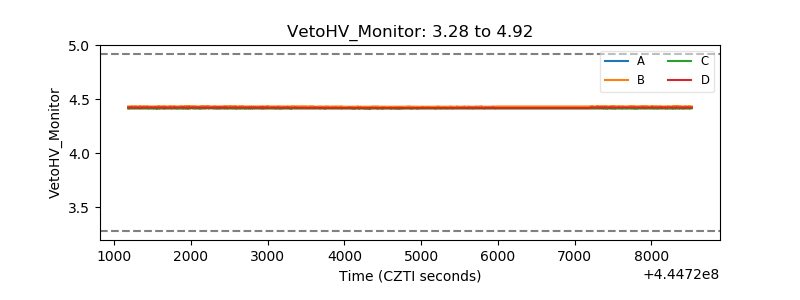 |
| Veto LLD | 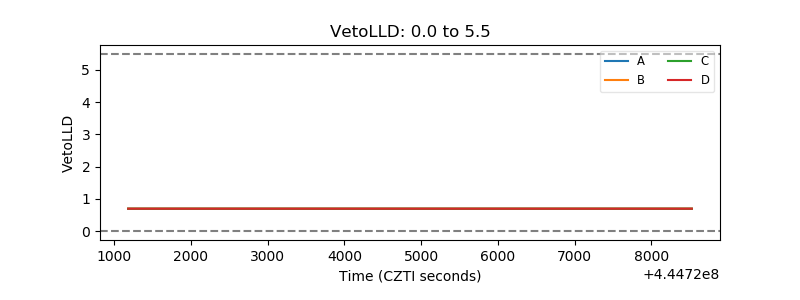 |
| Alpha Counter | 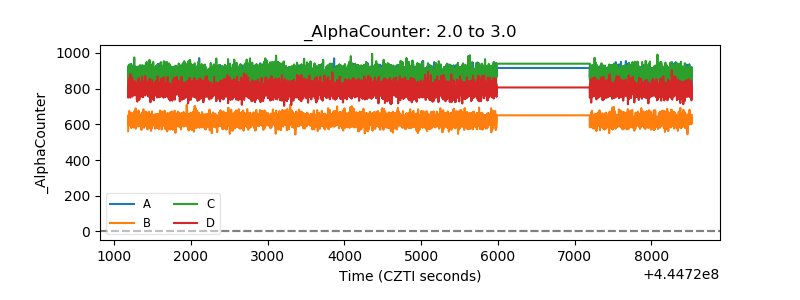 |
| _CPM_Rate | 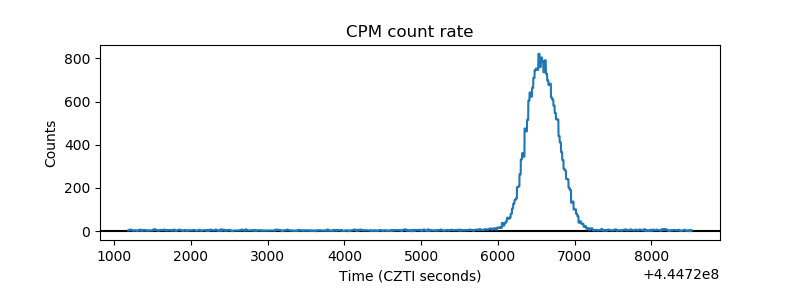 |
| CZT Counter | 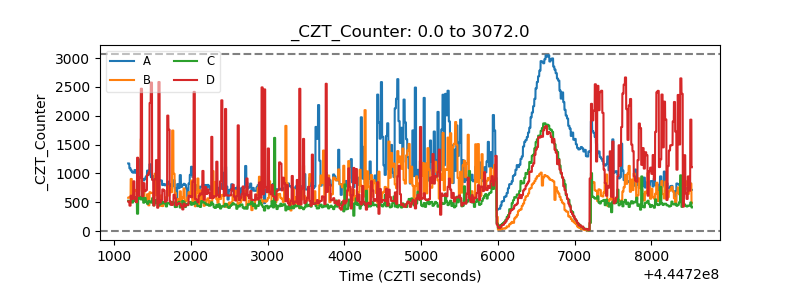 |
| +2.5 Volts monitor | 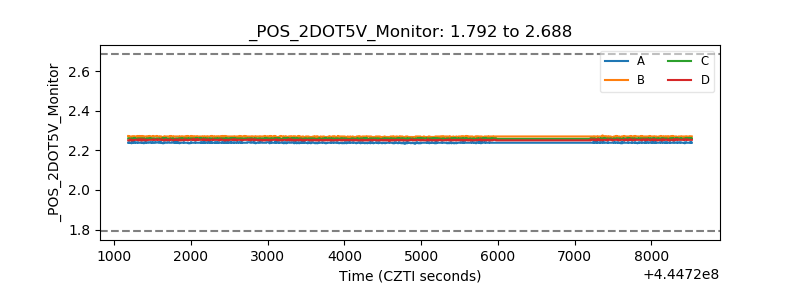 |
| +5 Volts monitor | 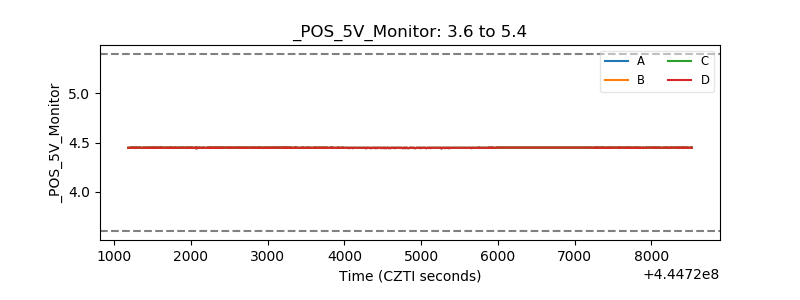 |
| _ROLL_ROT | 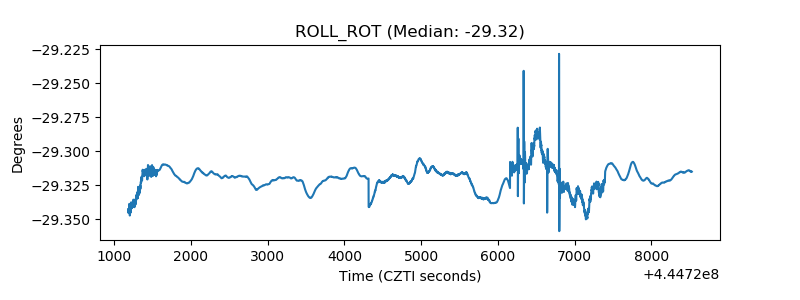 |
| _Roll_DEC | 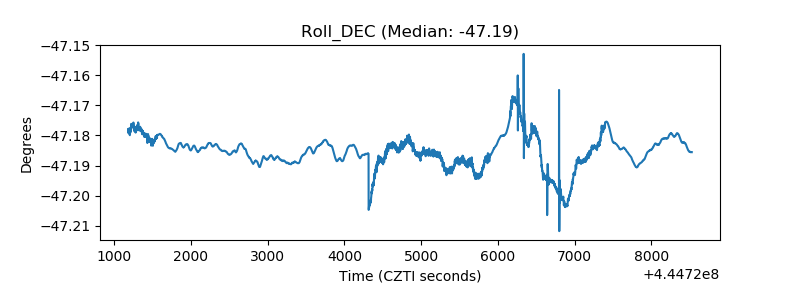 |
| _Roll_RA | 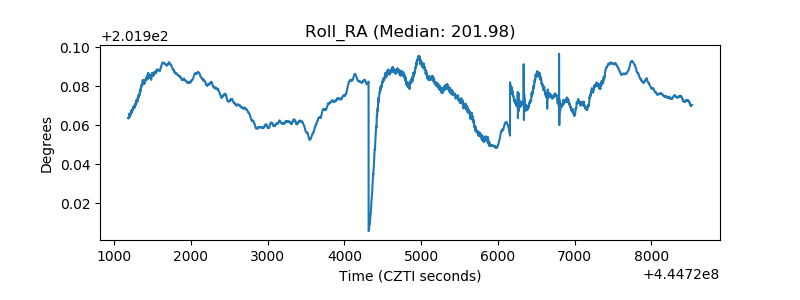 |
| Veto Counter | 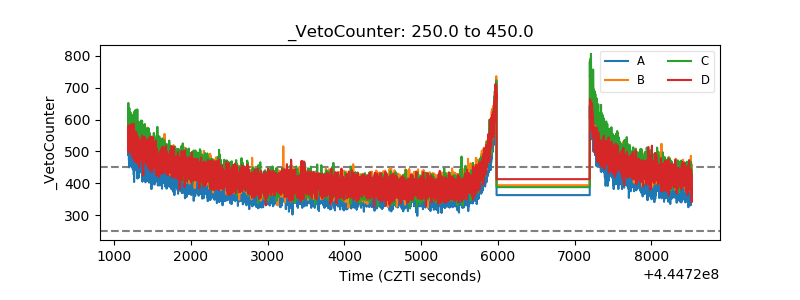 |