| Param | Original file | Final file |
|---|---|---|
| Filename | modeM0/AS1A13_049T05_9000006050_45171cztM0_level2.fits | modeM0/AS1A13_049T05_9000006050_45171cztM0_level2_quad_clean.evt |
| Size (bytes) | 537,356,160 | 105,160,320 |
| Size | 512.5 MB | 100.3 MB |
| Events in quadrant A | 6,499,790 | 647,594 |
| Events in quadrant B | 4,494,225 | 747,284 |
| Events in quadrant C | 2,999,263 | 727,811 |
| Events in quadrant D | 5,407,693 | 620,497 |
| Mode M0 | |||
|---|---|---|---|
| Quadrant | BADHDUFLAG | Total packets | Discarded packets |
| A | 0 | 23633 | 1 |
| B | 0 | 17729 | 2 |
| C | 0 | 13156 | 1 |
| D | 0 | 20268 | 1 |
| Mode M9 | |||
|---|---|---|---|
| Quadrant | BADHDUFLAG | Total packets | Discarded packets |
| A | 0 | 11 | 0 |
| B | 0 | 11 | 0 |
| C | 0 | 11 | 0 |
| D | 0 | 11 | 0 |
| Mode SS | |||
|---|---|---|---|
| Quadrant | BADHDUFLAG | Total packets | Discarded packets |
| A | 0 | 128 | 0 |
| B | 0 | 128 | 0 |
| C | 0 | 128 | 0 |
| D | 0 | 128 | 0 |
| Quadrant | Total seconds | Saturated seconds | Saturation percentage |
|---|---|---|---|
| A | 6322 | 744 | 11.768428% |
| B | 6322 | 132 | 2.087947% |
| C | 6322 | 70 | 1.107245% |
| D | 6322 | 548 | 8.668143% |
Noise dominated data is calculated using 1-second bins in cleaned event files. If a bin has >2000 counts, and if more than 50% of those come from <1% of pixels, then it is considered to be noise-dominated and hence unusable.
| Quadrant | # 1 sec bins | Bins with >0 counts | Bins with >2000 counts | High rate bins dominated by noise | Noise dominated (total time) | Noise dominated (detector-on time) | Marked lightcurve |
|---|---|---|---|---|---|---|---|
| A | 7392 | 6322 | 605 | 605 | 8.18% | 9.57% |  |
| B | 7392 | 6323 | 12 | 12 | 0.16% | 0.19% |  |
| C | 7392 | 6323 | 5 | 5 | 0.07% | 0.08% | 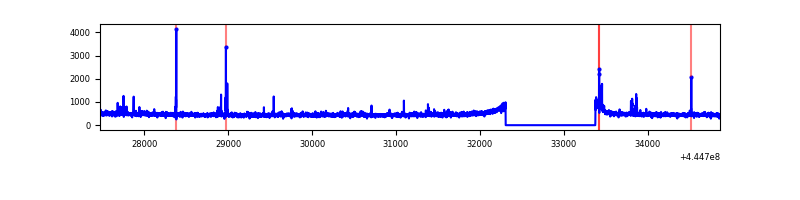 |
| D | 7392 | 6323 | 478 | 478 | 6.47% | 7.56% | 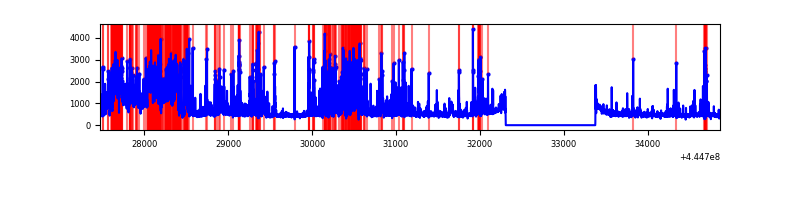 |
Top three noisy pixels from each quadrant. If the there are fewer than three noisy pixels in the level2.evt file, extra rows are filled as -1
| Pixel properties | Quadrant properties | ||||||
|---|---|---|---|---|---|---|---|
| Quadrant | DetID | PixID | Counts | Sigma | Mean | Median | Sigma |
| A | 10 | 83 | 2199244 | 15480.29 | 689 | 676 | 142.0 |
| A | 15 | 223 | 1555111 | 10944.9 | 689 | 676 | 142.0 |
| A | 2 | 79 | 28838 | 198.29 | 689 | 676 | 142.0 |
| B | 3 | 112 | 1302447 | 9084.81 | 736 | 714 | 143.3 |
| B | 5 | 185 | 62704 | 432.63 | 736 | 714 | 143.3 |
| B | 0 | 183 | 56376 | 388.47 | 736 | 714 | 143.3 |
| C | 12 | 2 | 33998 | 192.11 | 740 | 743 | 173.1 |
| C | 3 | 233 | 26150 | 146.77 | 740 | 743 | 173.1 |
| C | 14 | 254 | 22911 | 128.06 | 740 | 743 | 173.1 |
| D | 13 | 249 | 715610 | 3985.16 | 721 | 699 | 179.4 |
| D | 5 | 235 | 708033 | 3942.92 | 721 | 699 | 179.4 |
| D | 8 | 230 | 675800 | 3763.24 | 721 | 699 | 179.4 |
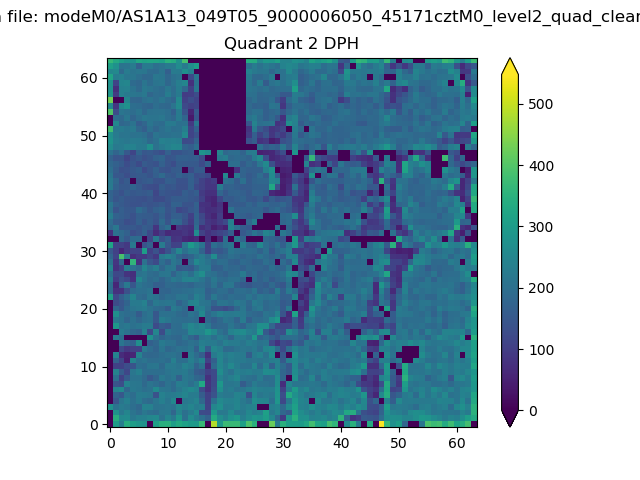
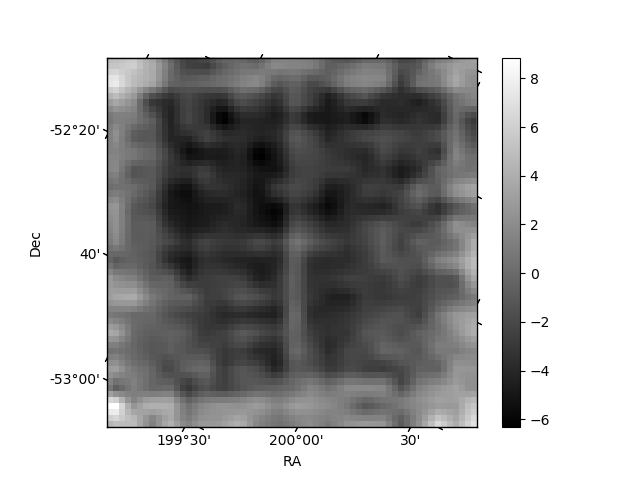
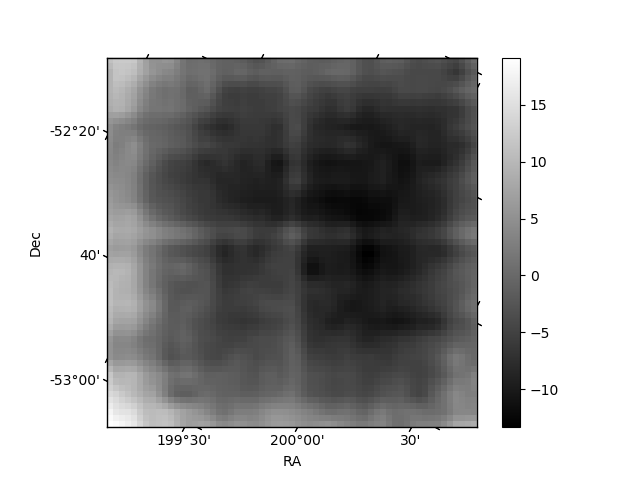
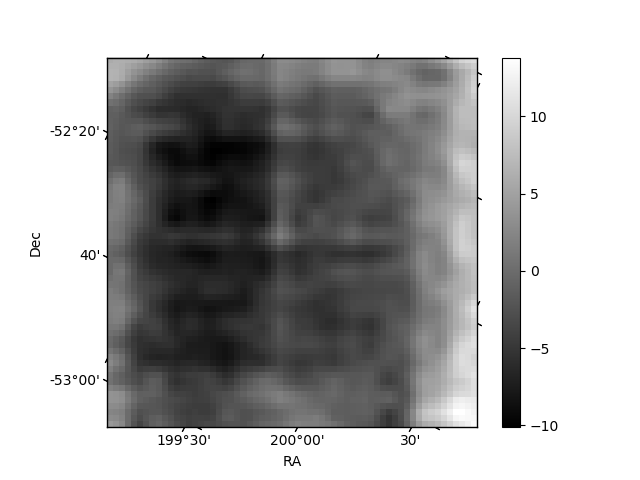
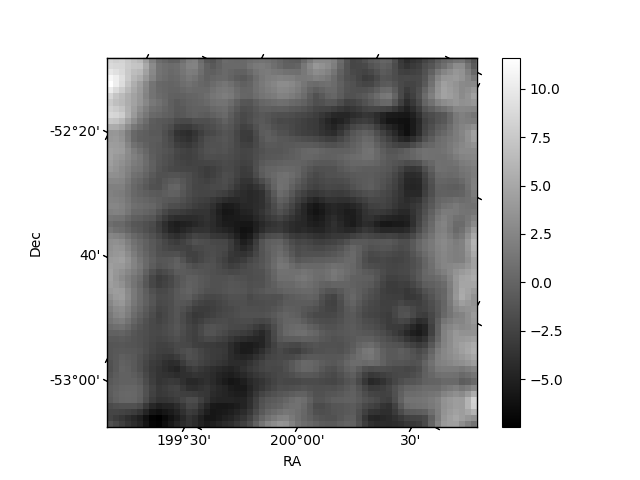
Histogram calculated using DETX and DETY for each event in the final _common_clean file
| Quadrant A | 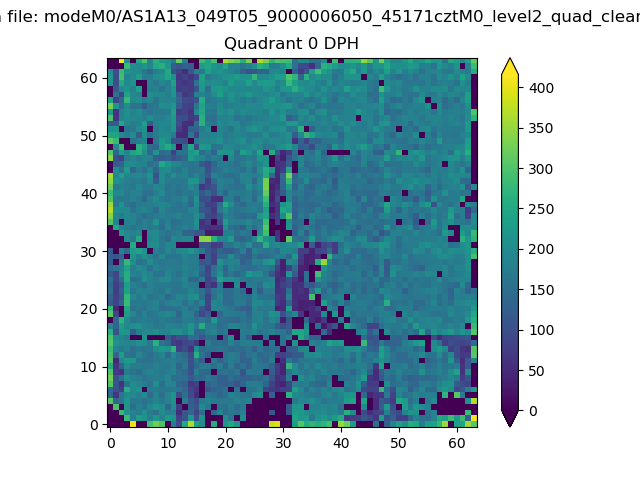 |
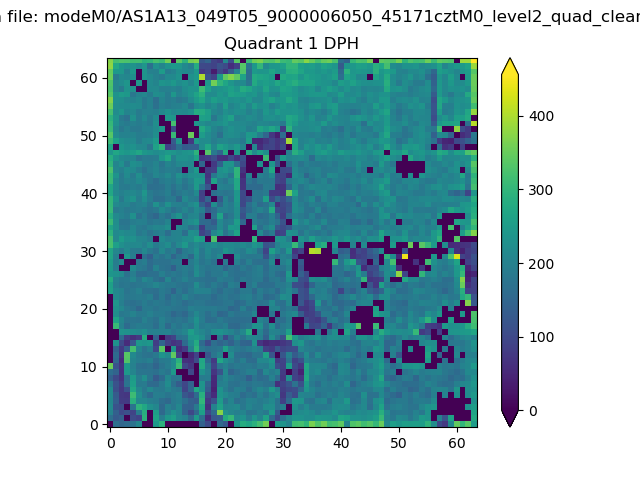 |
Quadrant B |
|---|---|---|---|
| Quadrant D | 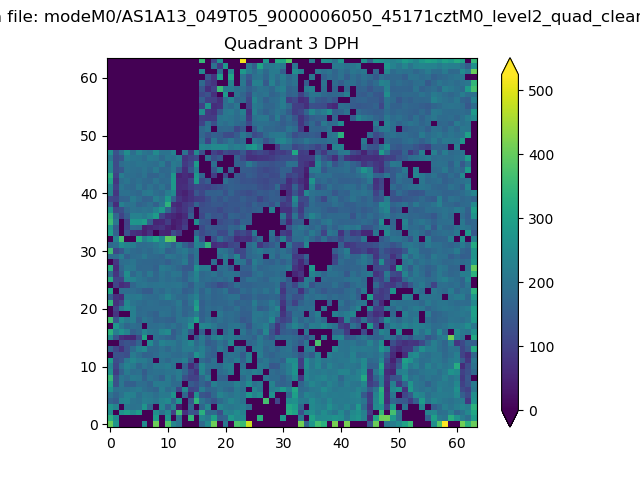 |
 |
Quadrant C |
| Plot type | Count rate plots | Images |
|---|---|---|
| Comparison with Poisson distribution Blue bars denote a histogram of data divided into 1 sec bins. Red curve is a Poisson curve with rate = median count rate of data. |
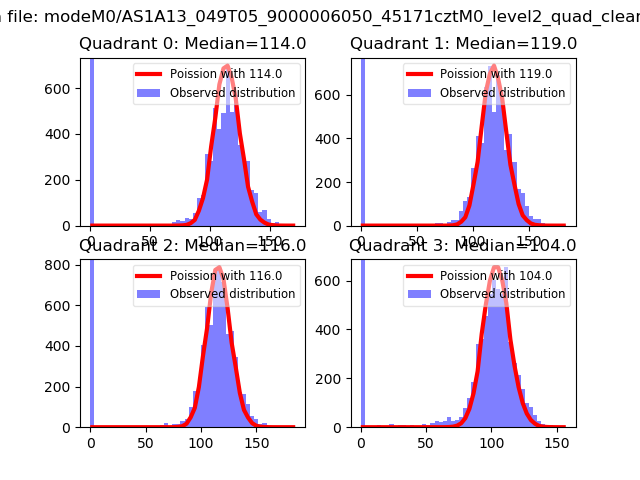 |
 |
| Quadrant-wise count rates Data is divided into 100 sec bins |
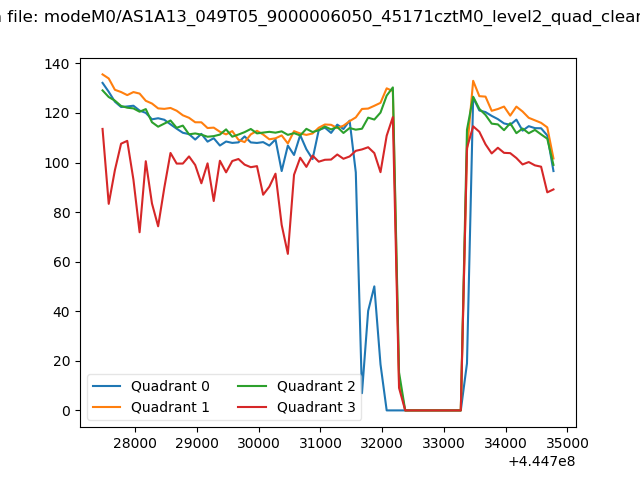 |
|
| Module-wise count rates for Quadrant A Data is divided into 100 sec bins |
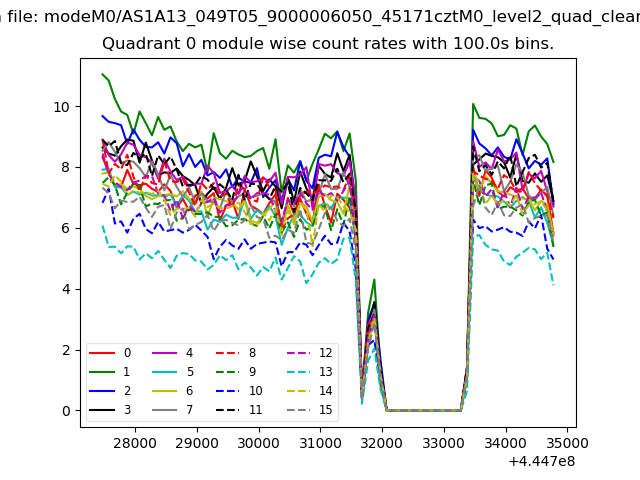 |
 |
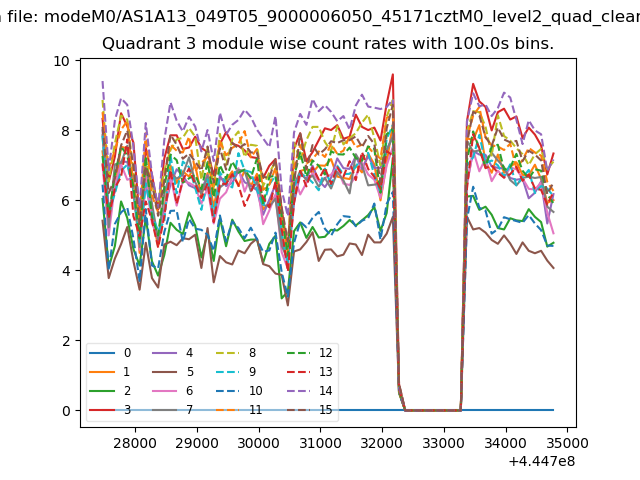
| Module-wise count rates for Quadrant B Data is divided into 100 sec bins |
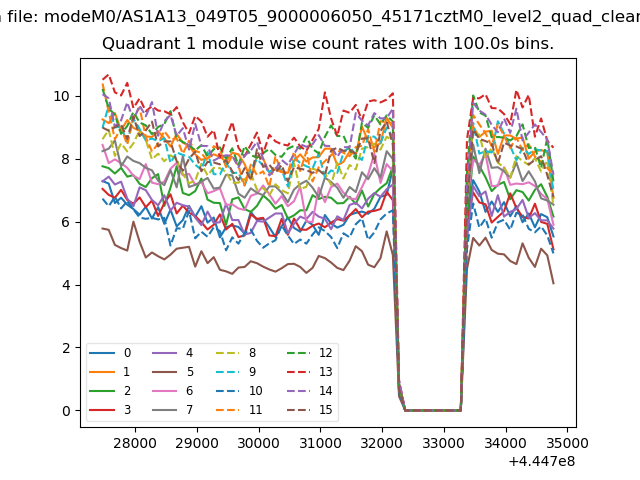 |
 |
| Module-wise count rates for Quadrant C Data is divided into 100 sec bins |
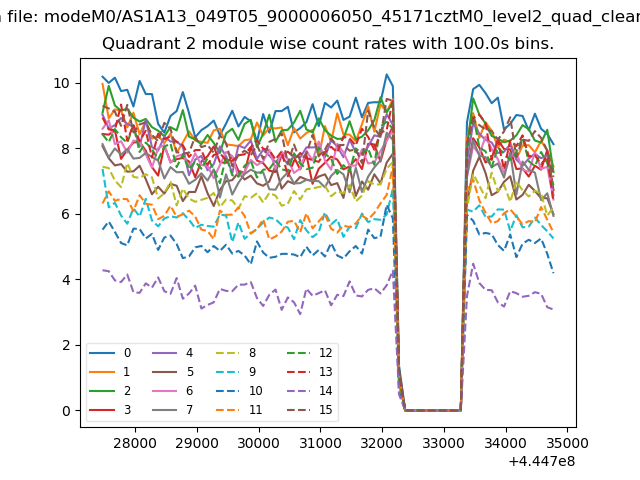 |
 |
| Module-wise count rates for Quadrant D Data is divided into 100 sec bins |
 |
 |
| Parameter | Plot |
|---|---|
| CZT HV Monitor |  |
| D_VDD | 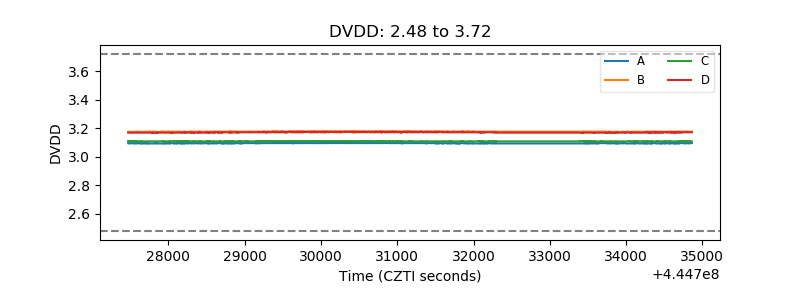 |
| Temperature 1 | 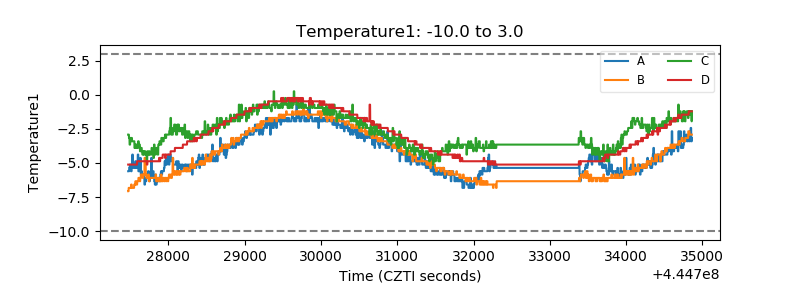 |
| Veto HV Monitor | 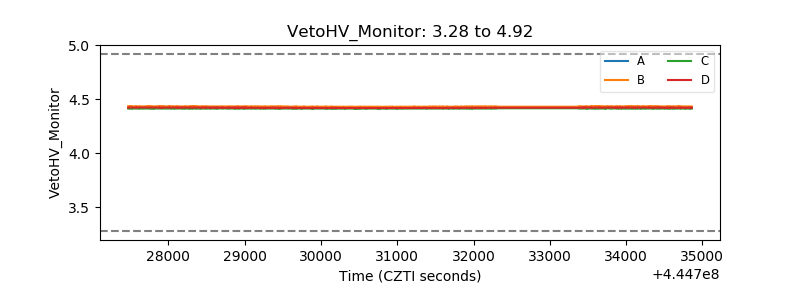 |
| Veto LLD | 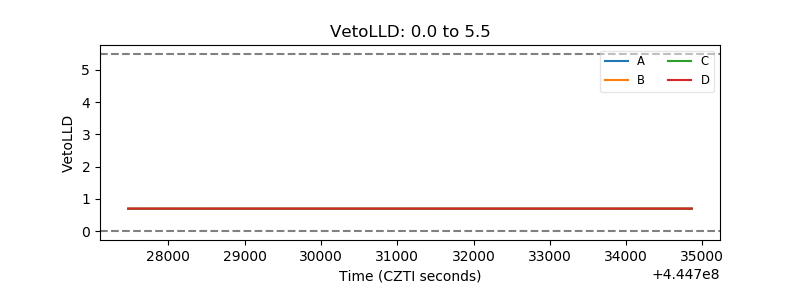 |
| Alpha Counter | 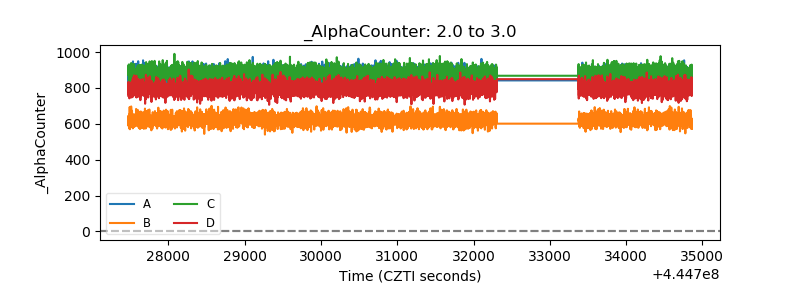 |
| _CPM_Rate | 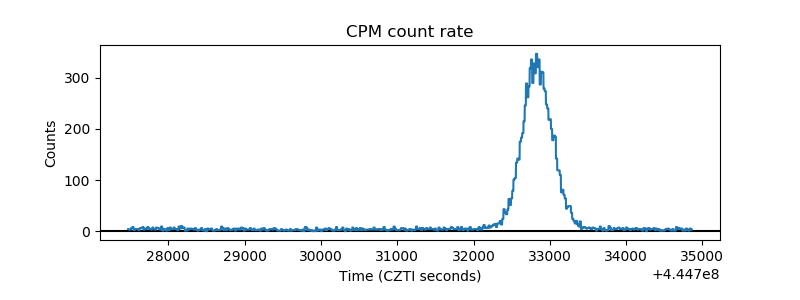 |
| CZT Counter | 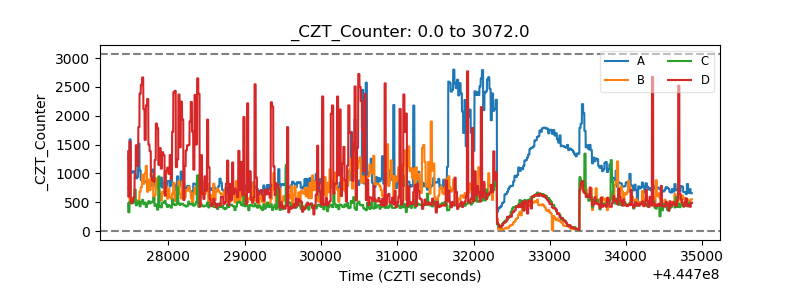 |
| +2.5 Volts monitor | 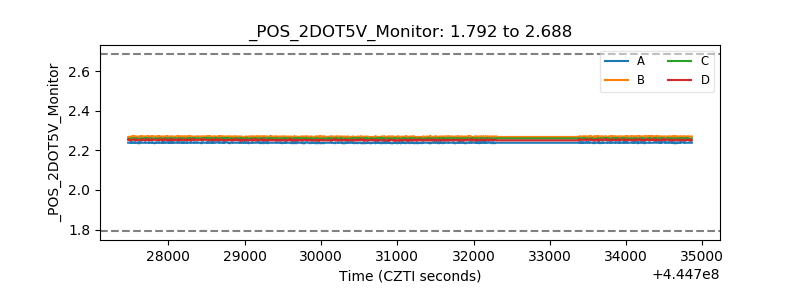 |
| +5 Volts monitor |  |
| _ROLL_ROT | 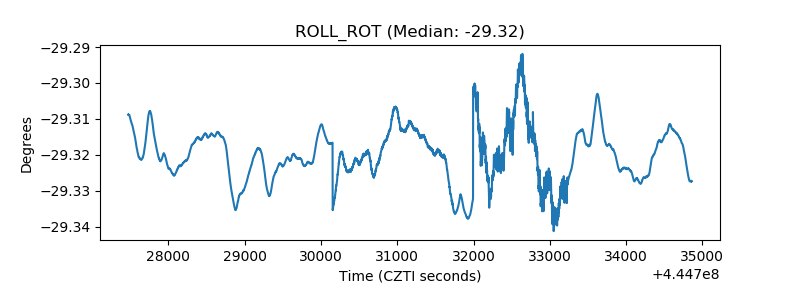 |
| _Roll_DEC | 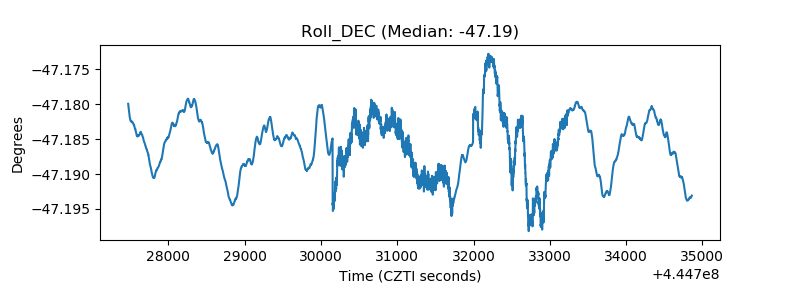 |
| _Roll_RA | 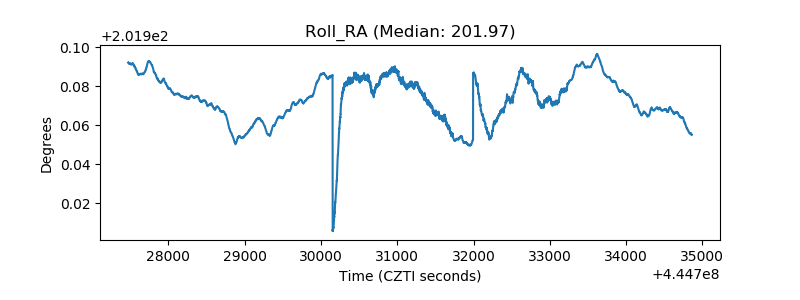 |
| Veto Counter | 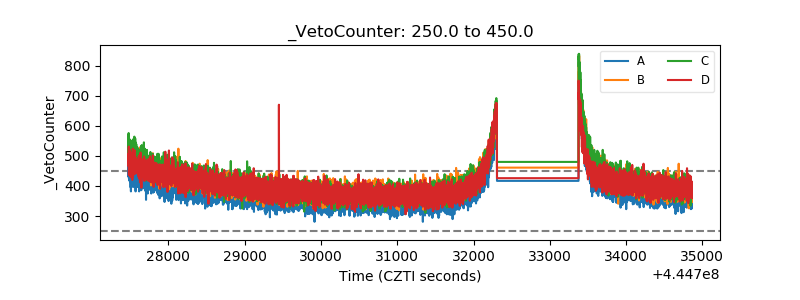 |