| Param | Original file | Final file |
|---|---|---|
| Filename | modeM0/AS1A13_049T05_9000006050_45172cztM0_level2.fits | modeM0/AS1A13_049T05_9000006050_45172cztM0_level2_quad_clean.evt |
| Size (bytes) | 477,907,200 | 102,974,400 |
| Size | 455.8 MB | 98.2 MB |
| Events in quadrant A | 5,117,971 | 682,905 |
| Events in quadrant B | 4,197,283 | 707,992 |
| Events in quadrant C | 3,019,636 | 689,477 |
| Events in quadrant D | 4,865,704 | 596,546 |
| Mode M0 | |||
|---|---|---|---|
| Quadrant | BADHDUFLAG | Total packets | Discarded packets |
| A | 0 | 19673 | 1 |
| B | 0 | 16678 | 1 |
| C | 0 | 13385 | 1 |
| D | 0 | 18678 | 3 |
| Mode M9 | |||
|---|---|---|---|
| Quadrant | BADHDUFLAG | Total packets | Discarded packets |
| A | 0 | 8 | 0 |
| B | 0 | 8 | 0 |
| C | 0 | 8 | 0 |
| D | 0 | 8 | 0 |
| Mode SS | |||
|---|---|---|---|
| Quadrant | BADHDUFLAG | Total packets | Discarded packets |
| A | 0 | 130 | 0 |
| B | 0 | 130 | 0 |
| C | 0 | 130 | 0 |
| D | 0 | 130 | 0 |
| Quadrant | Total seconds | Saturated seconds | Saturation percentage |
|---|---|---|---|
| A | 6314 | 188 | 2.977510% |
| B | 6314 | 172 | 2.724105% |
| C | 6315 | 109 | 1.726049% |
| D | 6314 | 463 | 7.332911% |
Noise dominated data is calculated using 1-second bins in cleaned event files. If a bin has >2000 counts, and if more than 50% of those come from <1% of pixels, then it is considered to be noise-dominated and hence unusable.
| Quadrant | # 1 sec bins | Bins with >0 counts | Bins with >2000 counts | High rate bins dominated by noise | Noise dominated (total time) | Noise dominated (detector-on time) | Marked lightcurve |
|---|---|---|---|---|---|---|---|
| A | 7169 | 6314 | 16 | 16 | 0.22% | 0.25% | 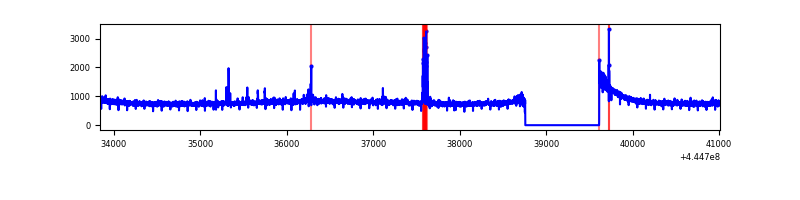 |
| B | 7169 | 6314 | 35 | 35 | 0.49% | 0.55% | 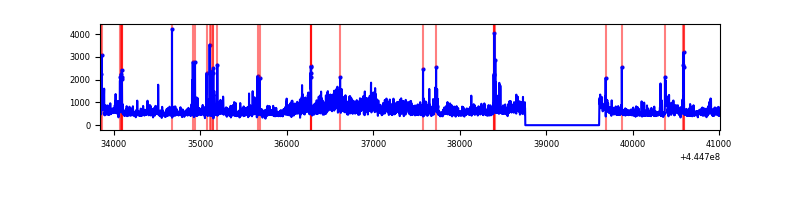 |
| C | 7170 | 6316 | 38 | 38 | 0.53% | 0.60% | 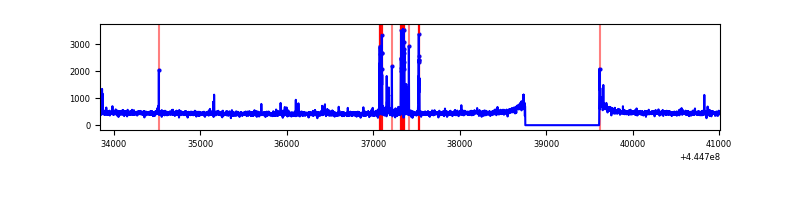 |
| D | 7169 | 6314 | 330 | 330 | 4.60% | 5.23% | 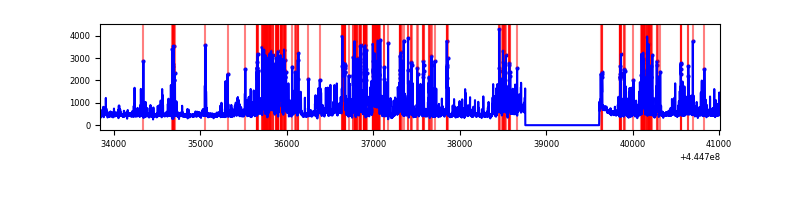 |
Top three noisy pixels from each quadrant. If the there are fewer than three noisy pixels in the level2.evt file, extra rows are filled as -1
| Pixel properties | Quadrant properties | ||||||
|---|---|---|---|---|---|---|---|
| Quadrant | DetID | PixID | Counts | Sigma | Mean | Median | Sigma |
| A | 10 | 83 | 2245883 | 15101.12 | 717 | 701 | 148.7 |
| A | 15 | 174 | 53671 | 356.28 | 717 | 701 | 148.7 |
| A | 13 | 248 | 19172 | 124.24 | 717 | 701 | 148.7 |
| B | 3 | 112 | 951996 | 6745.21 | 716 | 693 | 141.0 |
| B | 5 | 185 | 100257 | 705.96 | 716 | 693 | 141.0 |
| B | 0 | 183 | 74929 | 526.37 | 716 | 693 | 141.0 |
| C | 14 | 254 | 115340 | 686.11 | 714 | 718 | 167.1 |
| C | 12 | 2 | 68628 | 406.5 | 714 | 718 | 167.1 |
| C | 3 | 233 | 32667 | 191.24 | 714 | 718 | 167.1 |
| D | 13 | 249 | 892224 | 5048.8 | 699 | 677 | 176.6 |
| D | 5 | 235 | 722583 | 4088.13 | 699 | 677 | 176.6 |
| D | 2 | 249 | 155786 | 878.38 | 699 | 677 | 176.6 |
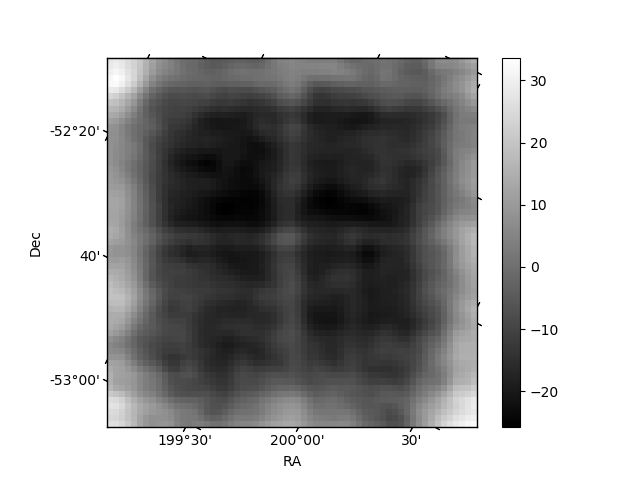
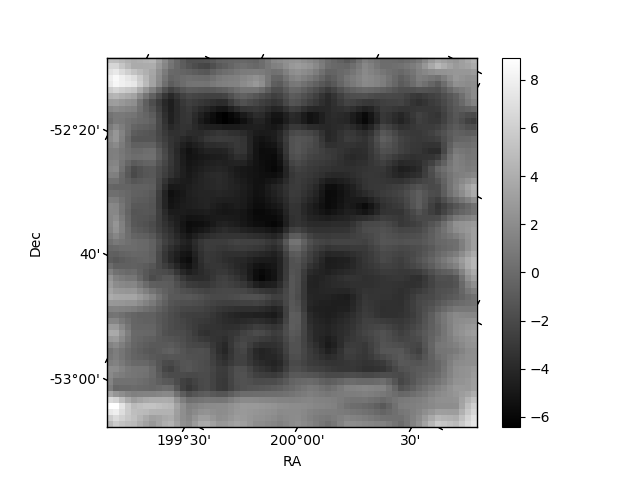
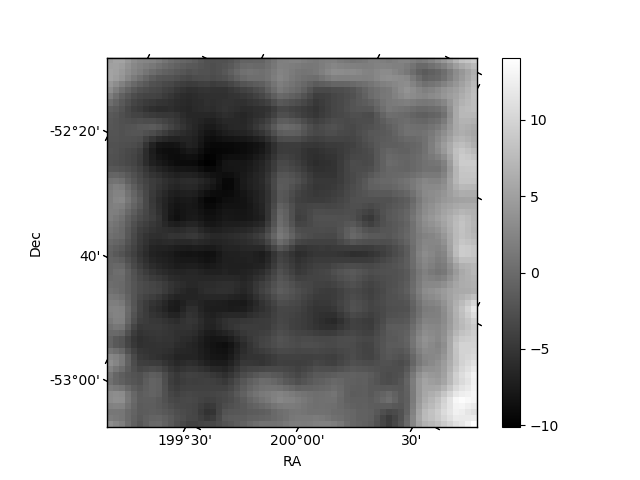
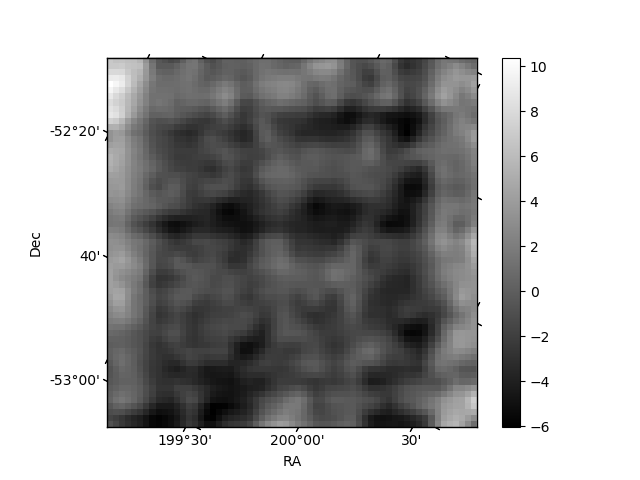
Histogram calculated using DETX and DETY for each event in the final _common_clean file
| Quadrant A | 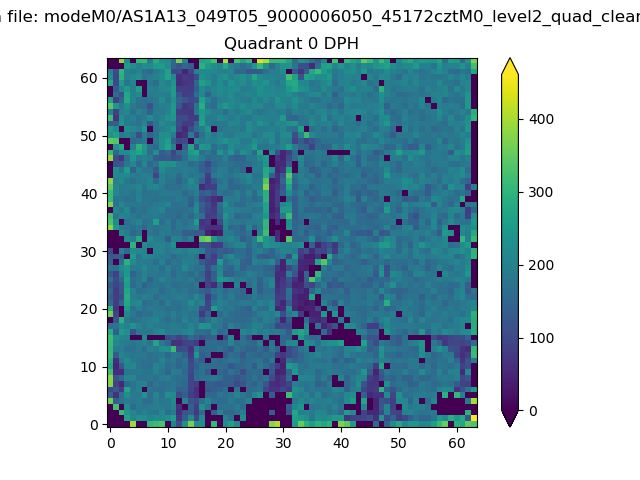 |
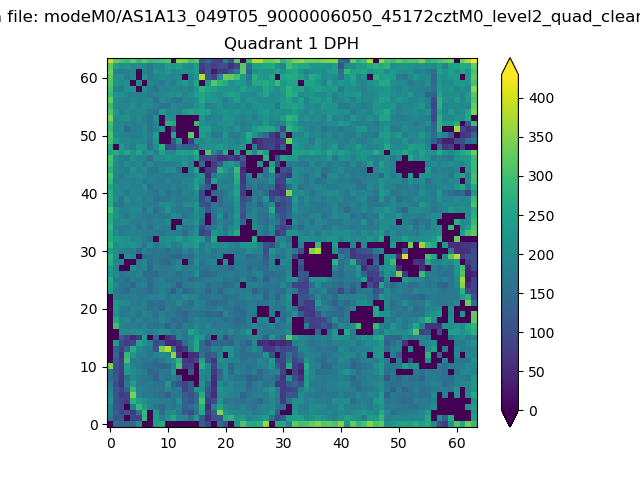 |
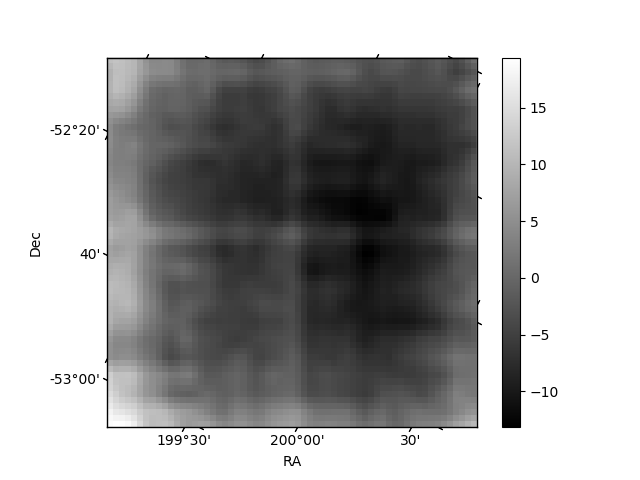
Quadrant B |
|---|---|---|---|
| Quadrant D | 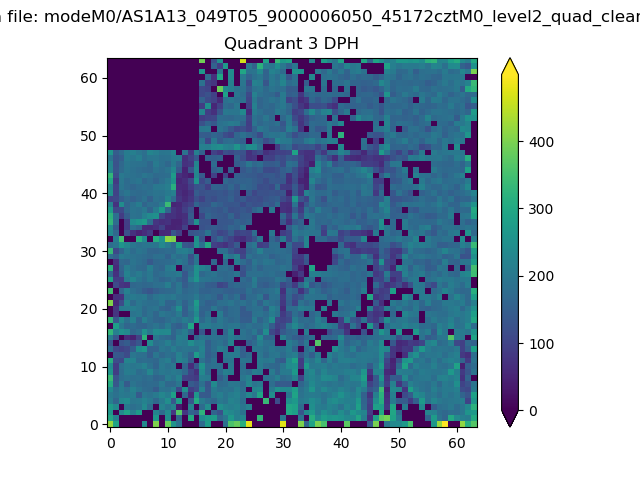 |
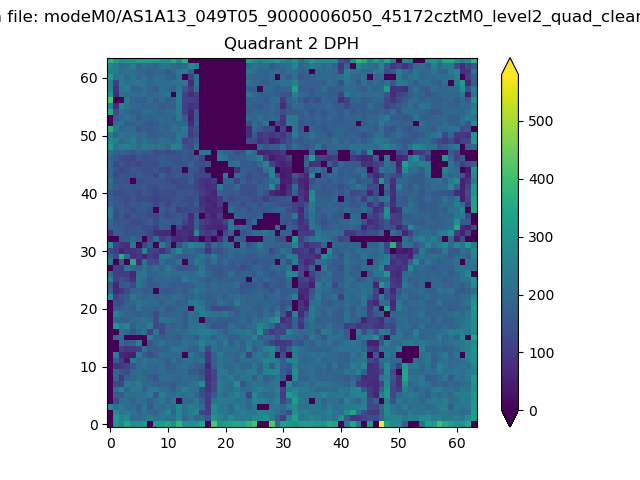 |
Quadrant C |
| Plot type | Count rate plots | Images |
|---|---|---|
| Comparison with Poisson distribution Blue bars denote a histogram of data divided into 1 sec bins. Red curve is a Poisson curve with rate = median count rate of data. |
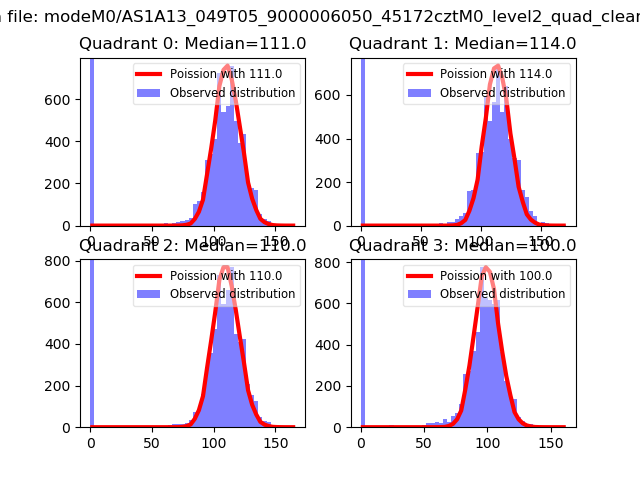 |
 |
| Quadrant-wise count rates Data is divided into 100 sec bins |
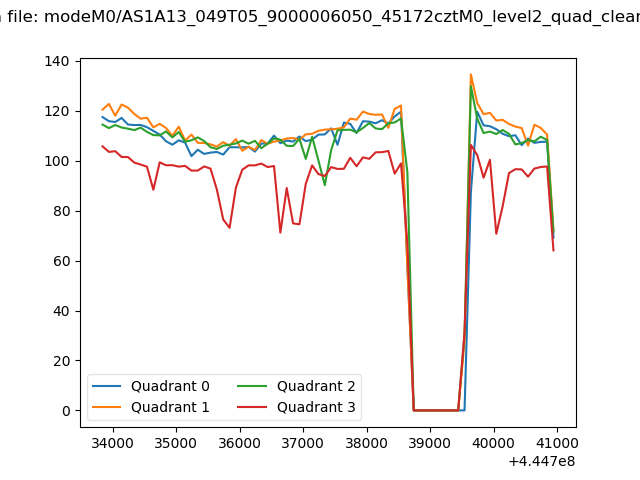 |
|
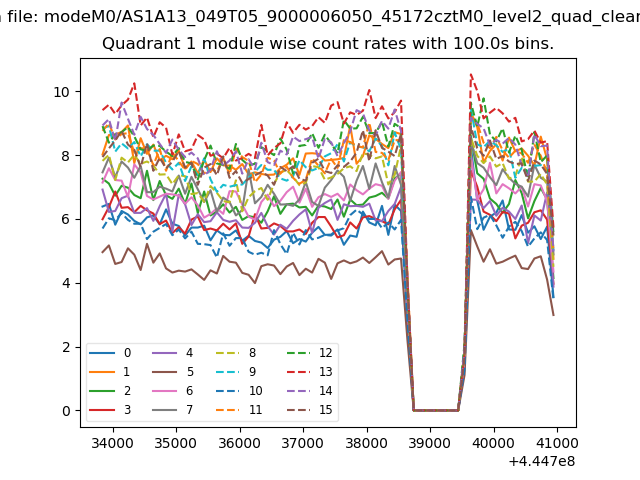
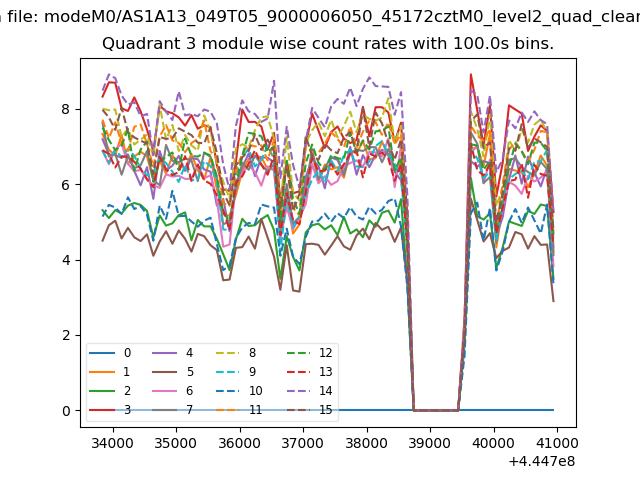
| Module-wise count rates for Quadrant A Data is divided into 100 sec bins |
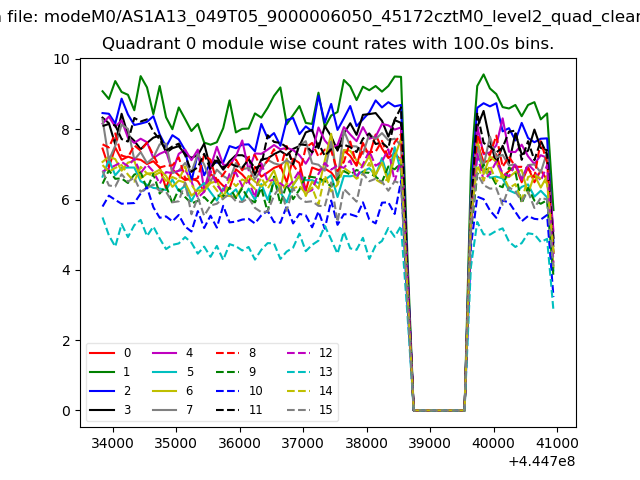 |
 |
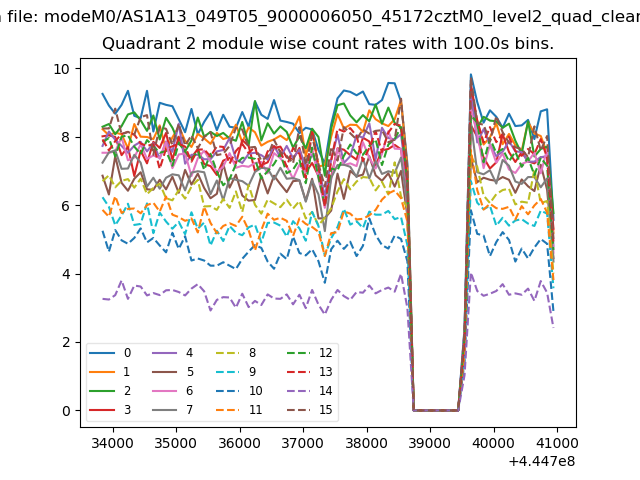
| Module-wise count rates for Quadrant B Data is divided into 100 sec bins |
 |
 |
| Module-wise count rates for Quadrant C Data is divided into 100 sec bins |
 |
 |
| Module-wise count rates for Quadrant D Data is divided into 100 sec bins |
 |
 |
| Parameter | Plot |
|---|---|
| CZT HV Monitor | 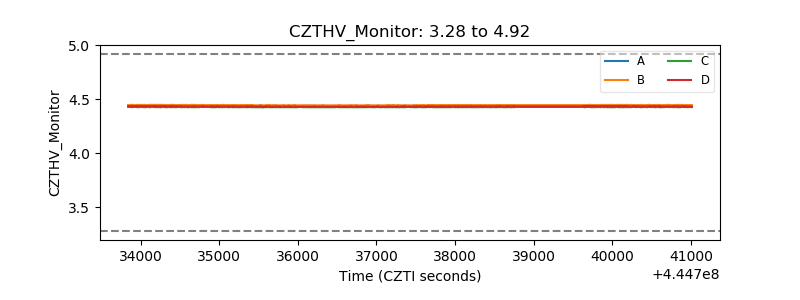 |
| D_VDD | 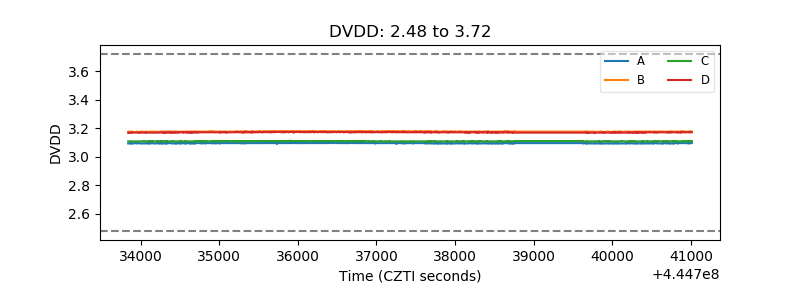 |
| Temperature 1 | 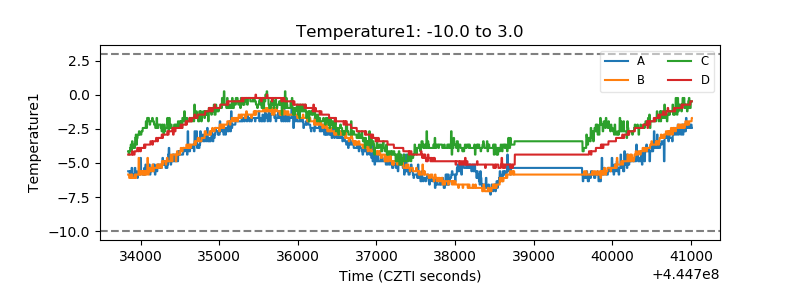 |
| Veto HV Monitor | 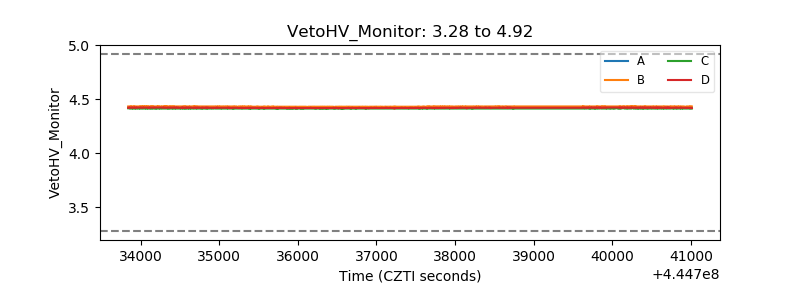 |
| Veto LLD | 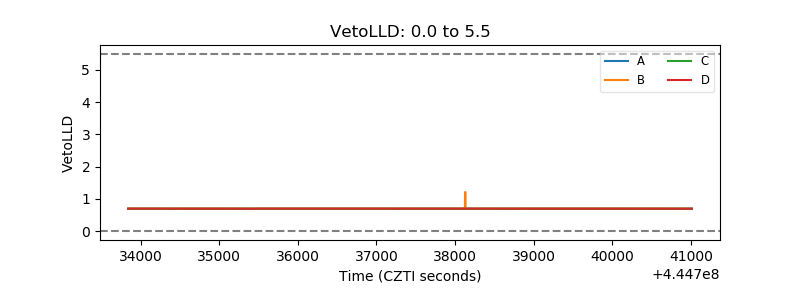 |
| Alpha Counter | 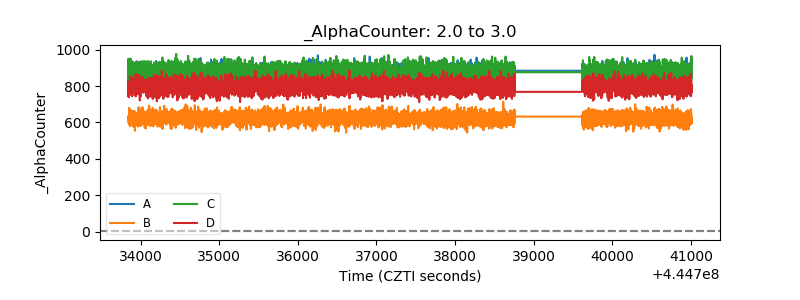 |
| _CPM_Rate | 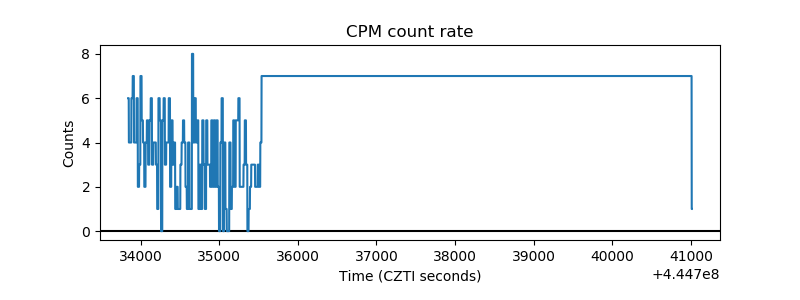 |
| CZT Counter | 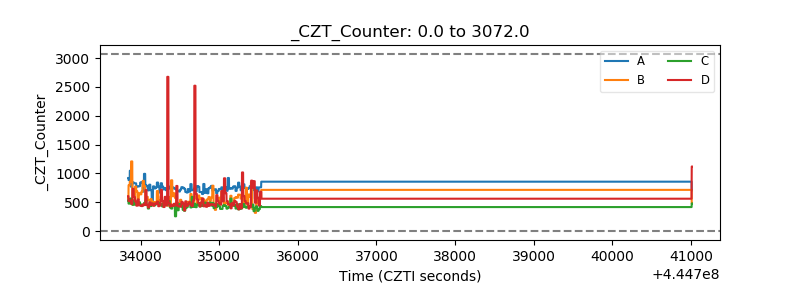 |
| +2.5 Volts monitor | 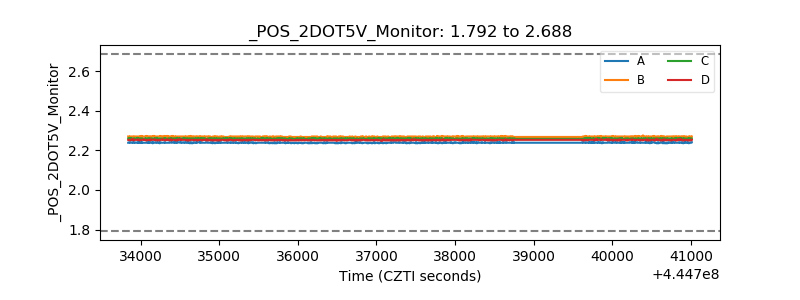 |
| +5 Volts monitor | 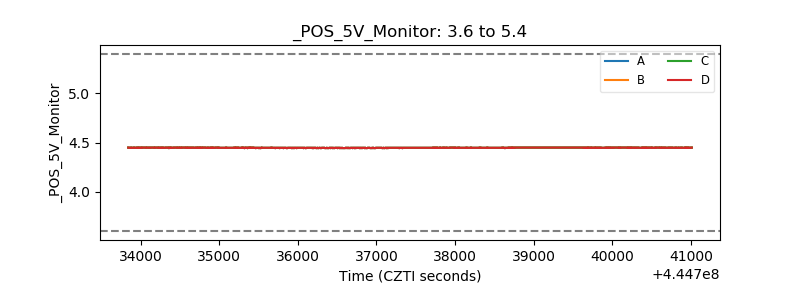 |
| _ROLL_ROT | 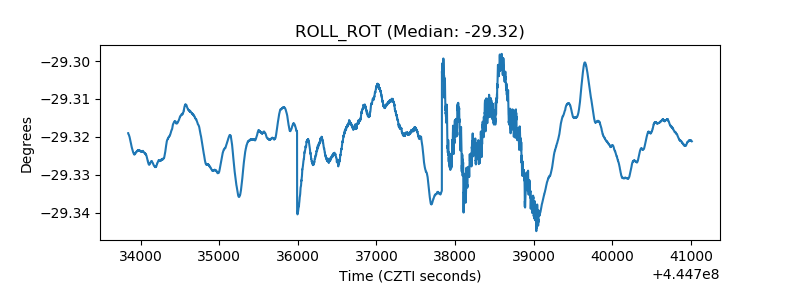 |
| _Roll_DEC | 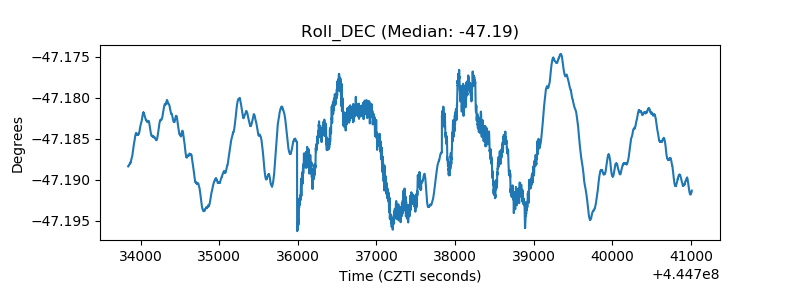 |
| _Roll_RA | 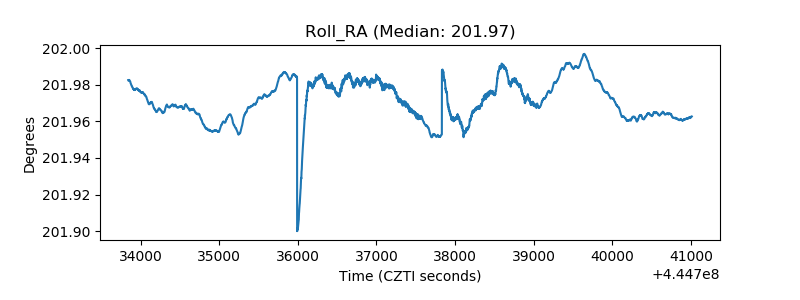 |
| Veto Counter | 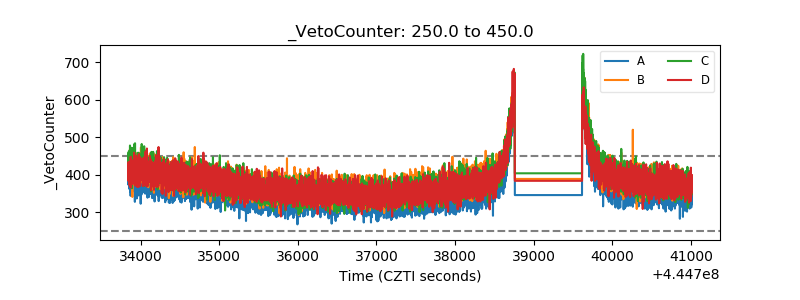 |