| Param | Original file | Final file |
|---|---|---|
| Filename | modeM0/AS1A13_049T05_9000006050_45173cztM0_level2.fits | modeM0/AS1A13_049T05_9000006050_45173cztM0_level2_quad_clean.evt |
| Size (bytes) | 587,687,040 | 123,206,400 |
| Size | 560.5 MB | 117.5 MB |
| Events in quadrant A | 6,372,769 | 807,059 |
| Events in quadrant B | 4,484,396 | 838,619 |
| Events in quadrant C | 3,945,283 | 829,001 |
| Events in quadrant D | 6,345,189 | 711,975 |
| Mode M0 | |||
|---|---|---|---|
| Quadrant | BADHDUFLAG | Total packets | Discarded packets |
| A | 0 | 24614 | 2 |
| B | 0 | 18412 | 3 |
| C | 0 | 17246 | 2 |
| D | 0 | 24139 | 2 |
| Mode M9 | |||
|---|---|---|---|
| Quadrant | BADHDUFLAG | Total packets | Discarded packets |
| A | 0 | 3 | 0 |
| B | 0 | 3 | 0 |
| C | 0 | 3 | 0 |
| D | 0 | 3 | 0 |
| Mode SS | |||
|---|---|---|---|
| Quadrant | BADHDUFLAG | Total packets | Discarded packets |
| A | 0 | 158 | 0 |
| B | 0 | 158 | 0 |
| C | 0 | 158 | 0 |
| D | 0 | 158 | 0 |
| Quadrant | Total seconds | Saturated seconds | Saturation percentage |
|---|---|---|---|
| A | 7821 | 392 | 5.012147% |
| B | 7820 | 346 | 4.424552% |
| C | 7820 | 237 | 3.030691% |
| D | 7820 | 733 | 9.373402% |
Noise dominated data is calculated using 1-second bins in cleaned event files. If a bin has >2000 counts, and if more than 50% of those come from <1% of pixels, then it is considered to be noise-dominated and hence unusable.
| Quadrant | # 1 sec bins | Bins with >0 counts | Bins with >2000 counts | High rate bins dominated by noise | Noise dominated (total time) | Noise dominated (detector-on time) | Marked lightcurve |
|---|---|---|---|---|---|---|---|
| A | 8101 | 7821 | 25 | 25 | 0.31% | 0.32% | 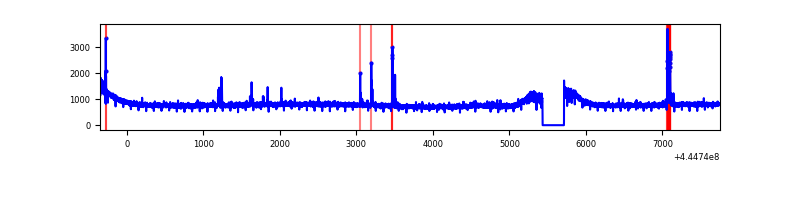 |
| B | 8100 | 7820 | 40 | 40 | 0.49% | 0.51% | 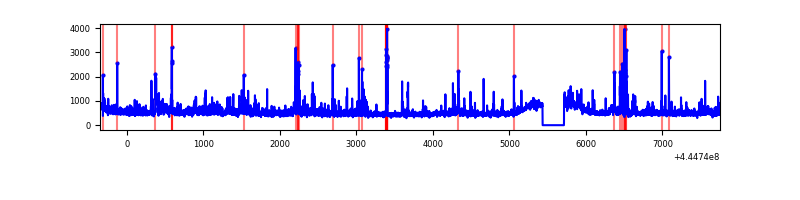 |
| C | 8100 | 7821 | 46 | 46 | 0.57% | 0.59% | 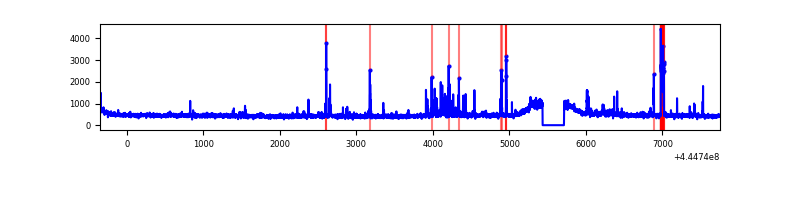 |
| D | 8100 | 7821 | 475 | 475 | 5.86% | 6.07% | 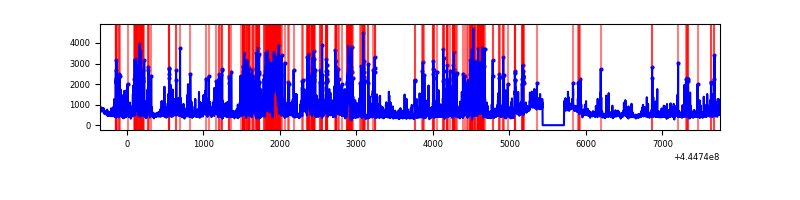 |
Top three noisy pixels from each quadrant. If the there are fewer than three noisy pixels in the level2.evt file, extra rows are filled as -1
| Pixel properties | Quadrant properties | ||||||
|---|---|---|---|---|---|---|---|
| Quadrant | DetID | PixID | Counts | Sigma | Mean | Median | Sigma |
| A | 10 | 83 | 2718801 | 14326.78 | 908 | 884 | 189.7 |
| A | 15 | 174 | 90853 | 474.25 | 908 | 884 | 189.7 |
| A | 10 | 248 | 24824 | 126.19 | 908 | 884 | 189.7 |
| B | 3 | 112 | 414657 | 2270.81 | 908 | 877 | 182.2 |
| B | 5 | 185 | 106878 | 581.73 | 908 | 877 | 182.2 |
| B | 0 | 183 | 86219 | 468.35 | 908 | 877 | 182.2 |
| C | 1 | 3 | 120992 | 565.01 | 906 | 912 | 212.5 |
| C | 15 | 208 | 100034 | 466.4 | 906 | 912 | 212.5 |
| C | 14 | 254 | 88283 | 411.11 | 906 | 912 | 212.5 |
| D | 13 | 249 | 1739716 | 7793.45 | 890 | 861 | 223.1 |
| D | 5 | 235 | 267401 | 1194.62 | 890 | 861 | 223.1 |
| D | 1 | 52 | 247432 | 1105.12 | 890 | 861 | 223.1 |
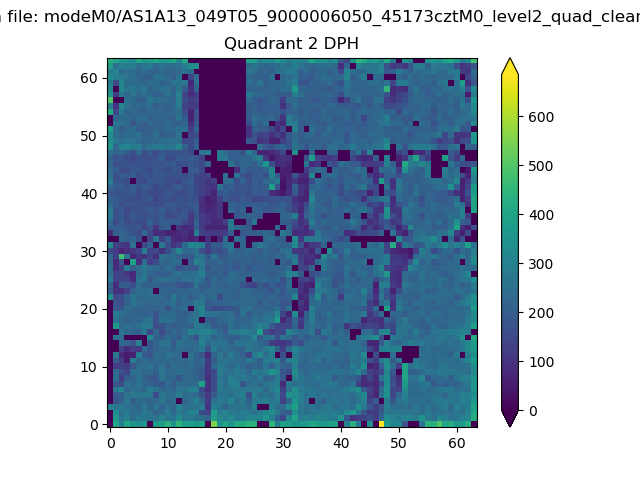
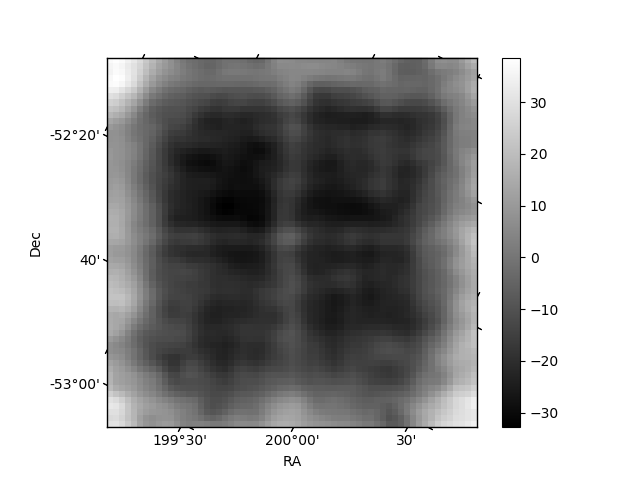
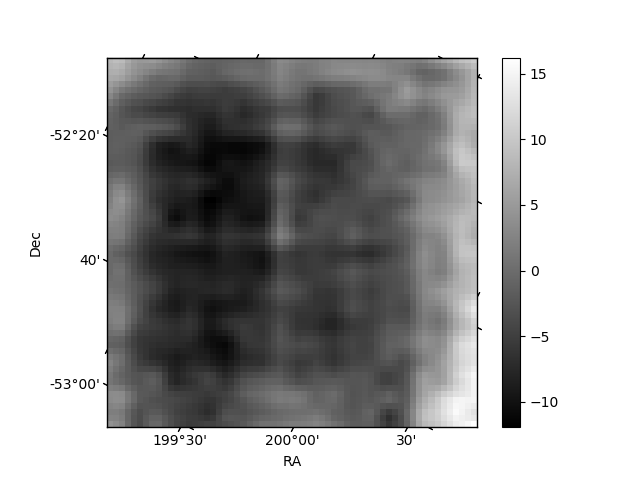
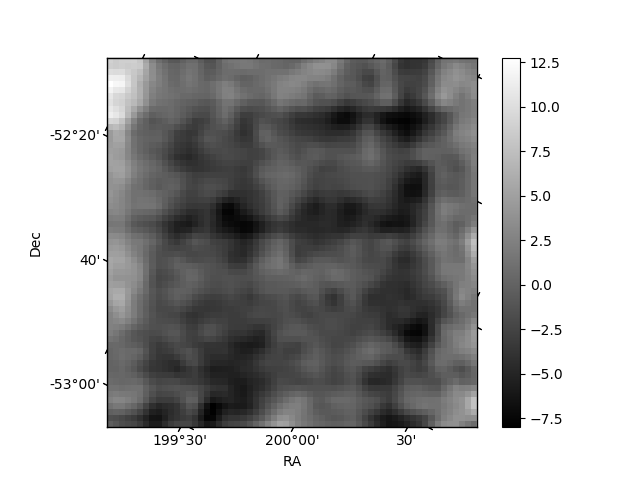
Histogram calculated using DETX and DETY for each event in the final _common_clean file
| Quadrant A | 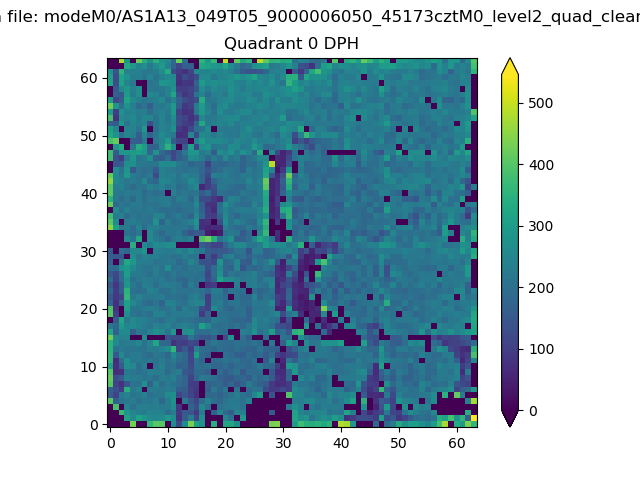 |
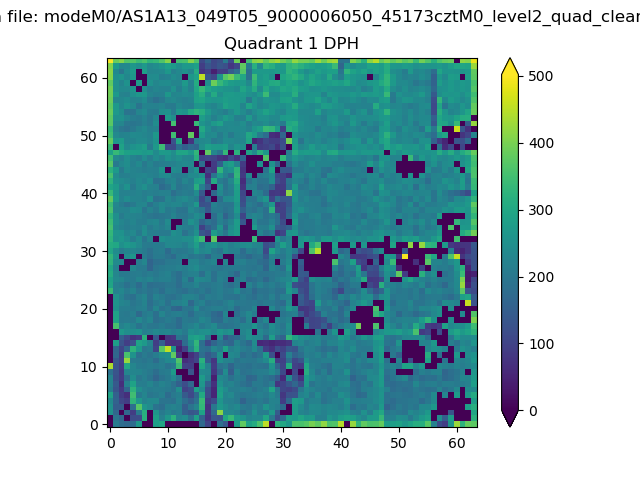 |
Quadrant B |
|---|---|---|---|
| Quadrant D | 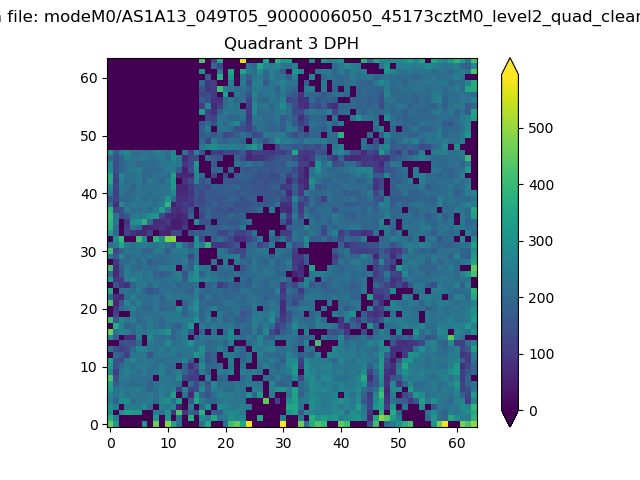 |
 |
Quadrant C |
| Plot type | Count rate plots | Images |
|---|---|---|
| Comparison with Poisson distribution Blue bars denote a histogram of data divided into 1 sec bins. Red curve is a Poisson curve with rate = median count rate of data. |
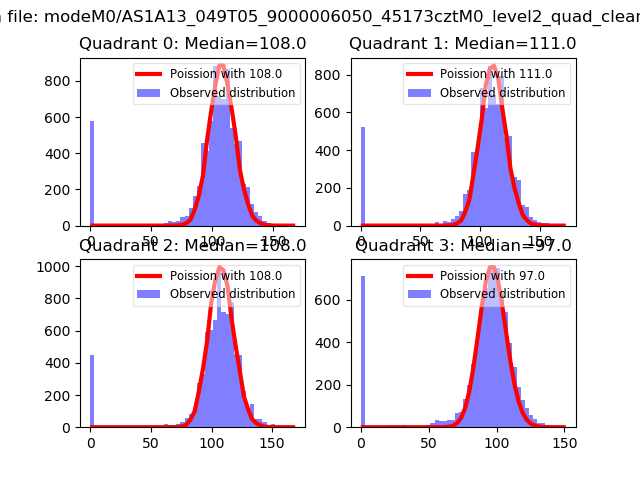 |
 |
| Quadrant-wise count rates Data is divided into 100 sec bins |
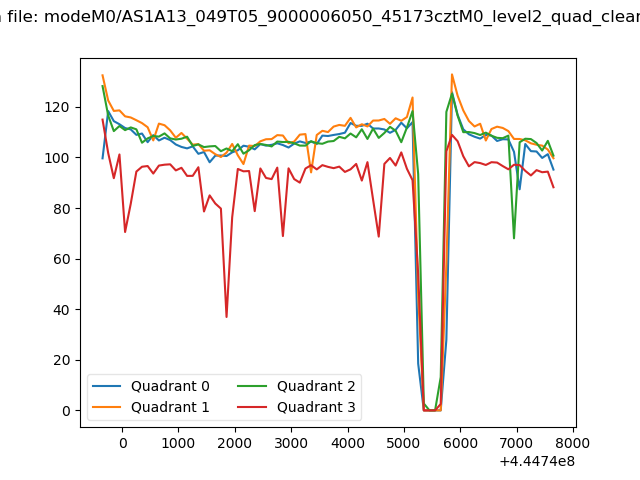 |
|
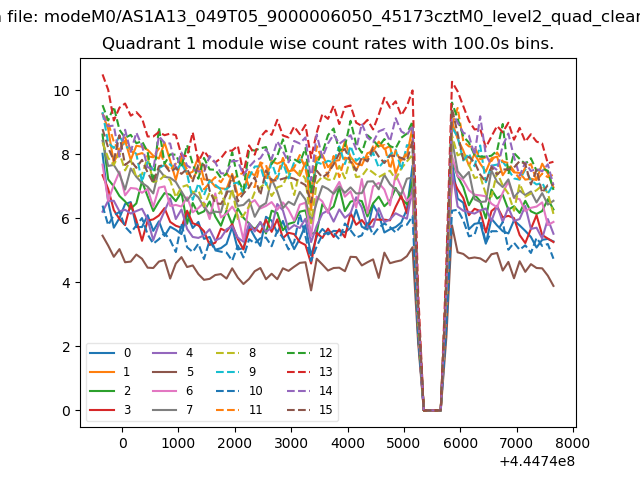
| Module-wise count rates for Quadrant A Data is divided into 100 sec bins |
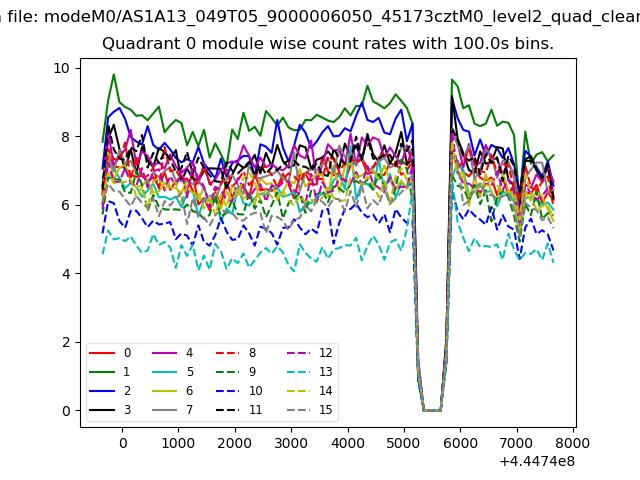 |
 |
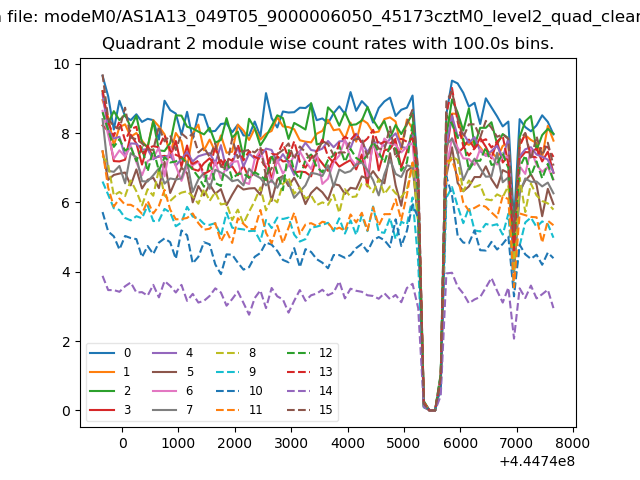
| Module-wise count rates for Quadrant B Data is divided into 100 sec bins |
 |
 |
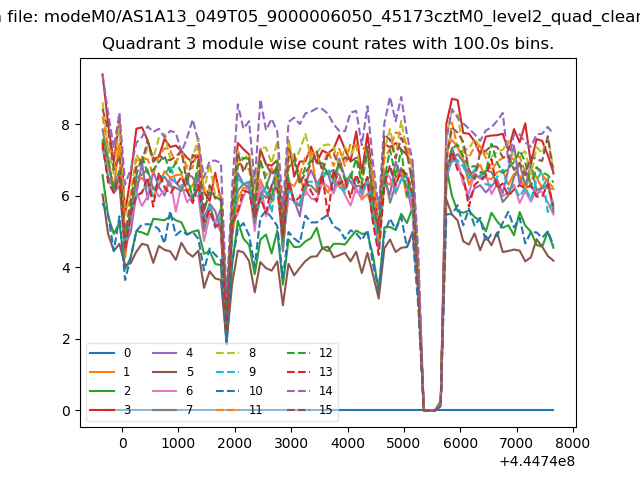
| Module-wise count rates for Quadrant C Data is divided into 100 sec bins |
 |
 |
| Module-wise count rates for Quadrant D Data is divided into 100 sec bins |
 |
 |
| Parameter | Plot |
|---|---|
| CZT HV Monitor | 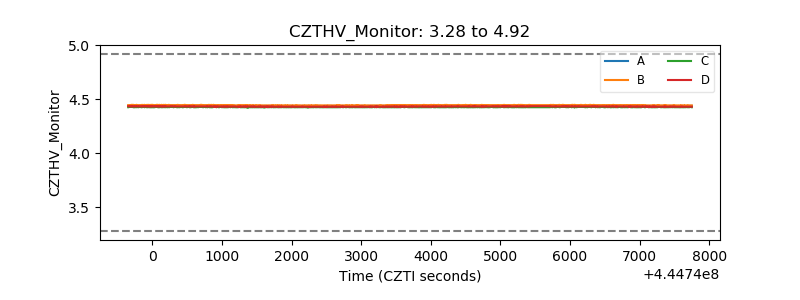 |
| D_VDD | 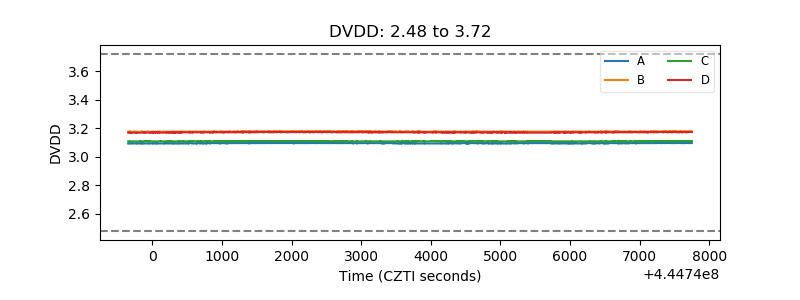 |
| Temperature 1 | 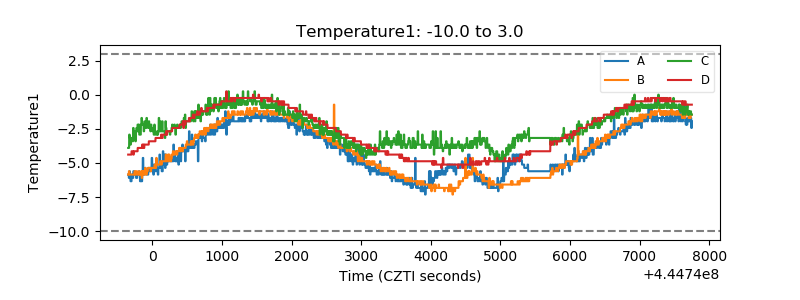 |
| Veto HV Monitor | 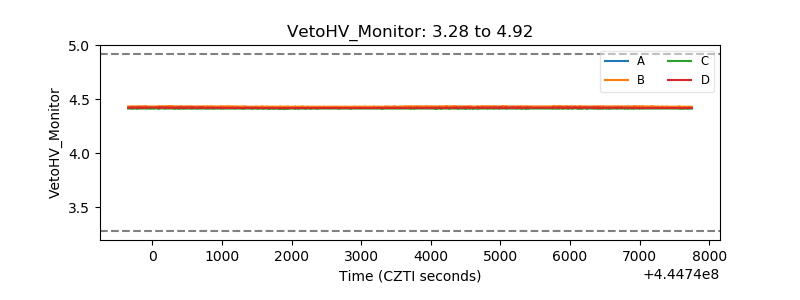 |
| Veto LLD | 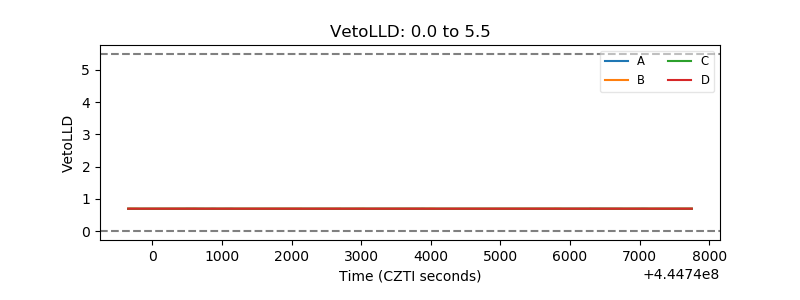 |
| Alpha Counter | 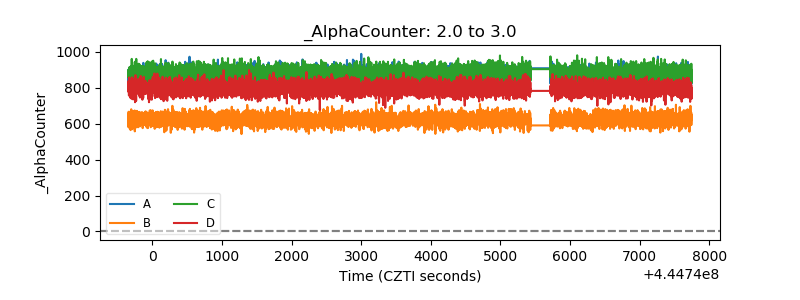 |
| _CPM_Rate | 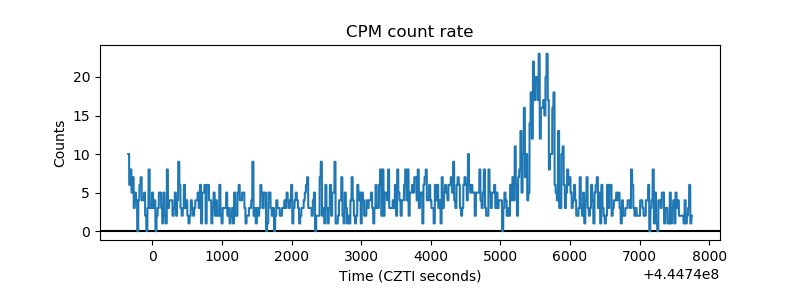 |
| CZT Counter | 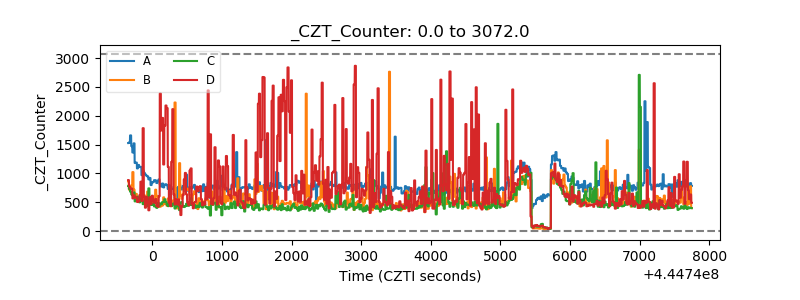 |
| +2.5 Volts monitor | 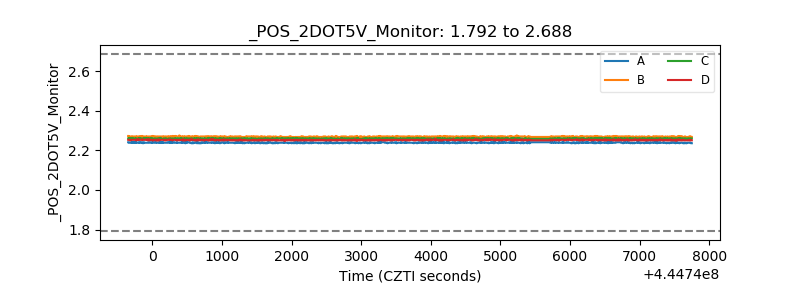 |
| +5 Volts monitor |  |
| _ROLL_ROT | 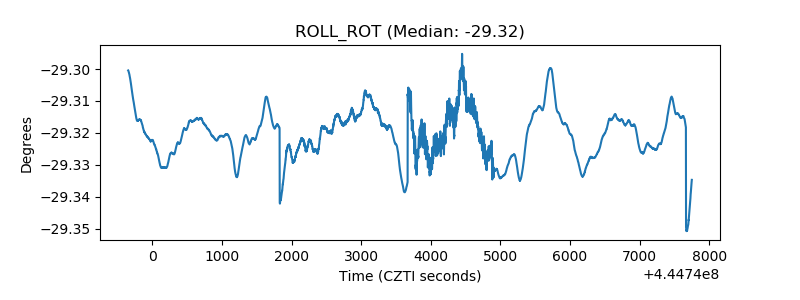 |
| _Roll_DEC | 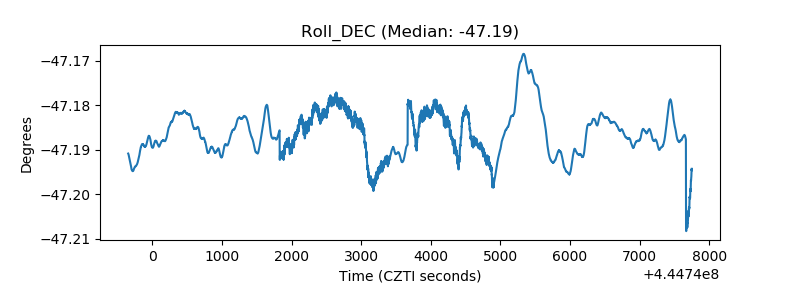 |
| _Roll_RA | 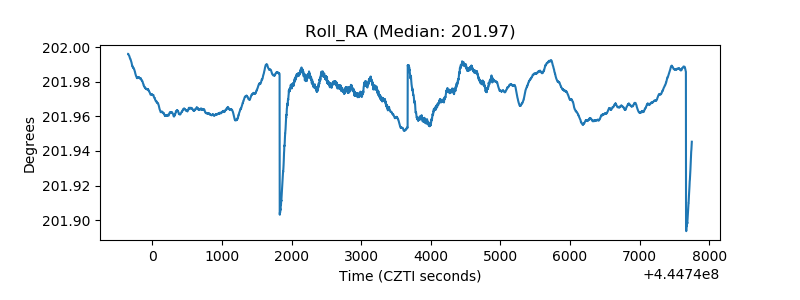 |
| Veto Counter | 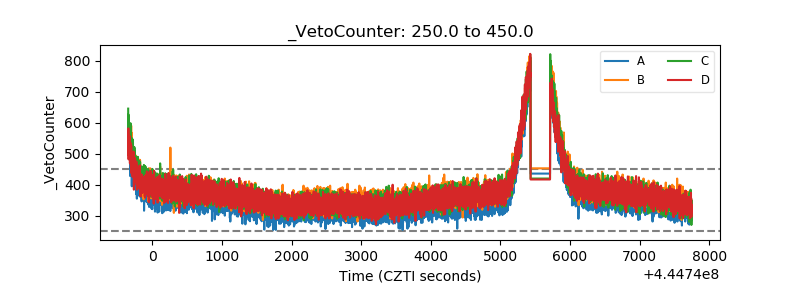 |