| Param | Original file | Final file |
|---|---|---|
| Filename | modeM0/AS1A13_049T05_9000006050_45174cztM0_level2.fits | modeM0/AS1A13_049T05_9000006050_45174cztM0_level2_quad_clean.evt |
| Size (bytes) | 579,363,840 | 126,544,320 |
| Size | 552.5 MB | 120.7 MB |
| Events in quadrant A | 7,043,355 | 818,699 |
| Events in quadrant B | 4,187,233 | 867,480 |
| Events in quadrant C | 3,834,157 | 850,964 |
| Events in quadrant D | 5,763,760 | 740,661 |
| Mode M0 | |||
|---|---|---|---|
| Quadrant | BADHDUFLAG | Total packets | Discarded packets |
| A | 0 | 26356 | 0 |
| B | 0 | 17584 | 0 |
| C | 0 | 17035 | 0 |
| D | 0 | 22474 | 0 |
| Mode SS | |||
|---|---|---|---|
| Quadrant | BADHDUFLAG | Total packets | Discarded packets |
| A | 0 | 160 | 0 |
| B | 0 | 160 | 0 |
| C | 0 | 160 | 0 |
| D | 0 | 160 | 0 |
| Quadrant | Total seconds | Saturated seconds | Saturation percentage |
|---|---|---|---|
| A | 7963 | 460 | 5.776717% |
| B | 7963 | 188 | 2.360919% |
| C | 7964 | 70 | 0.878955% |
| D | 7964 | 493 | 6.190357% |
Noise dominated data is calculated using 1-second bins in cleaned event files. If a bin has >2000 counts, and if more than 50% of those come from <1% of pixels, then it is considered to be noise-dominated and hence unusable.
| Quadrant | # 1 sec bins | Bins with >0 counts | Bins with >2000 counts | High rate bins dominated by noise | Noise dominated (total time) | Noise dominated (detector-on time) | Marked lightcurve |
|---|---|---|---|---|---|---|---|
| A | 7963 | 7963 | 283 | 283 | 3.55% | 3.55% | 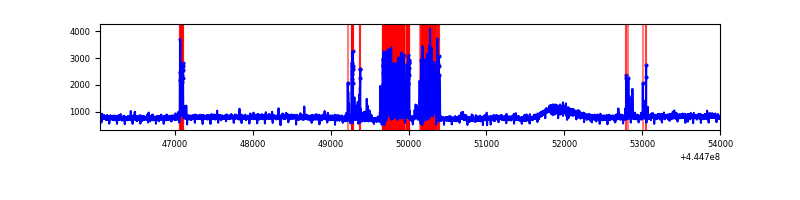 |
| B | 7963 | 7963 | 29 | 29 | 0.36% | 0.36% | 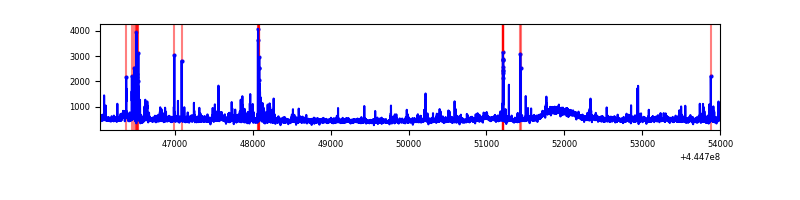 |
| C | 7964 | 7964 | 45 | 45 | 0.57% | 0.57% | 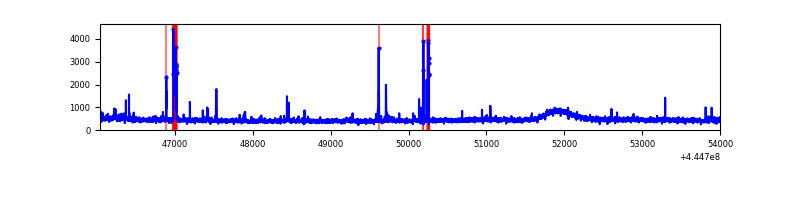 |
| D | 7964 | 7964 | 427 | 427 | 5.36% | 5.36% | 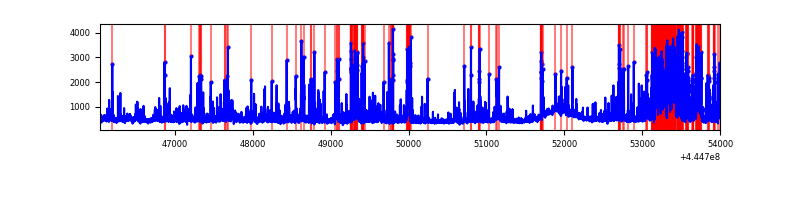 |
Top three noisy pixels from each quadrant. If the there are fewer than three noisy pixels in the level2.evt file, extra rows are filled as -1
| Pixel properties | Quadrant properties | ||||||
|---|---|---|---|---|---|---|---|
| Quadrant | DetID | PixID | Counts | Sigma | Mean | Median | Sigma |
| A | 10 | 83 | 2671588 | 14008.27 | 909 | 889 | 190.7 |
| A | 15 | 223 | 737036 | 3861.22 | 909 | 889 | 190.7 |
| A | 15 | 174 | 104486 | 543.38 | 909 | 889 | 190.7 |
| B | 3 | 112 | 284412 | 1554.22 | 913 | 883 | 182.4 |
| B | 5 | 32 | 84640 | 459.13 | 913 | 883 | 182.4 |
| B | 0 | 183 | 81274 | 440.68 | 913 | 883 | 182.4 |
| C | 1 | 3 | 193238 | 905.89 | 902 | 907 | 212.3 |
| C | 3 | 233 | 54631 | 253.04 | 902 | 907 | 212.3 |
| C | 14 | 254 | 31047 | 141.96 | 902 | 907 | 212.3 |
| D | 13 | 249 | 1527942 | 6842.45 | 883 | 855 | 223.2 |
| D | 1 | 52 | 182988 | 816.09 | 883 | 855 | 223.2 |
| D | 2 | 249 | 140375 | 625.15 | 883 | 855 | 223.2 |
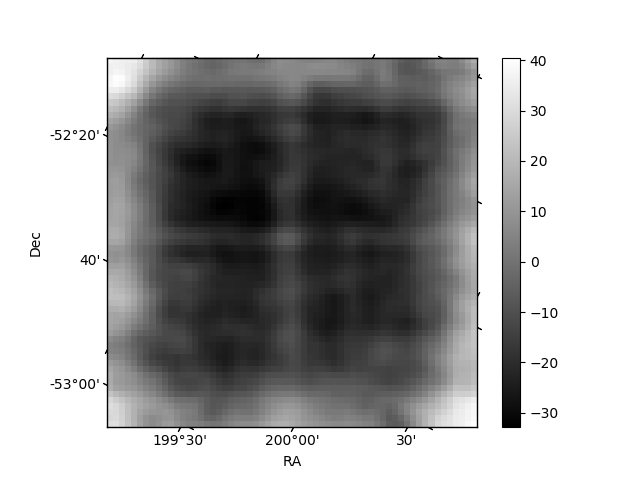
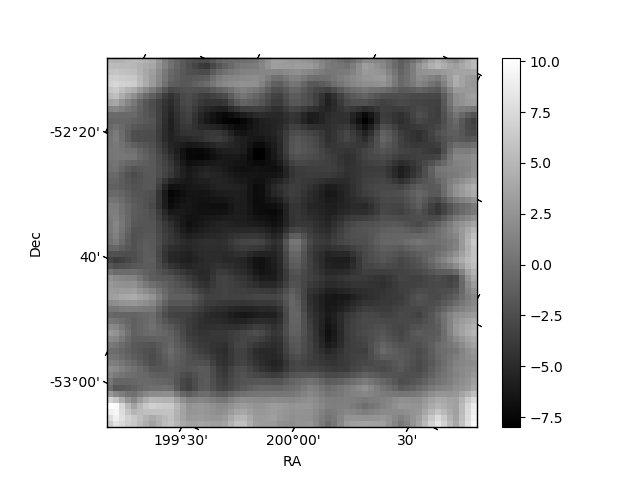
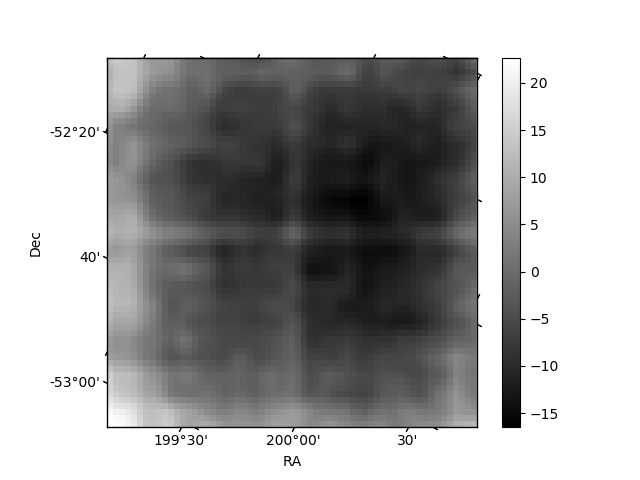
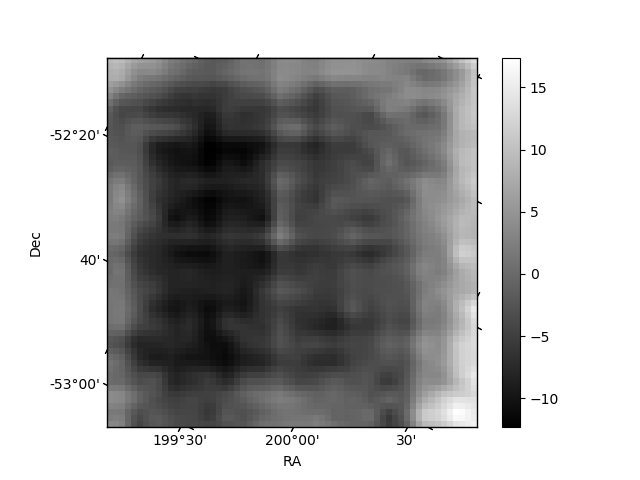
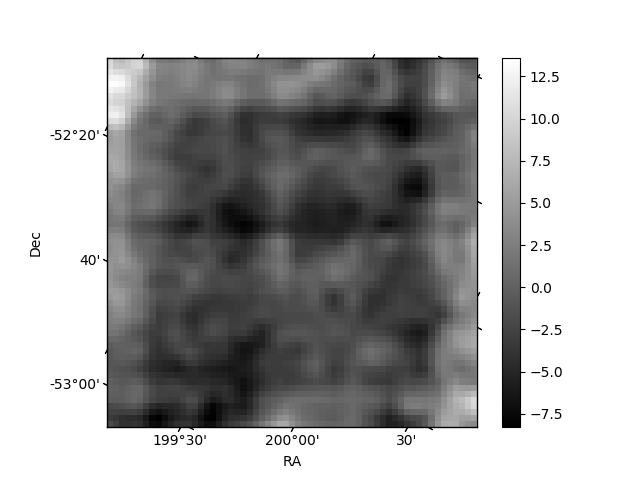
Histogram calculated using DETX and DETY for each event in the final _common_clean file
| Quadrant A | 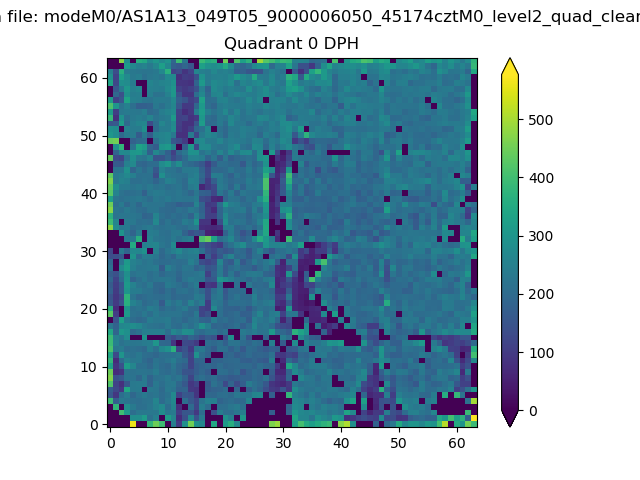 |
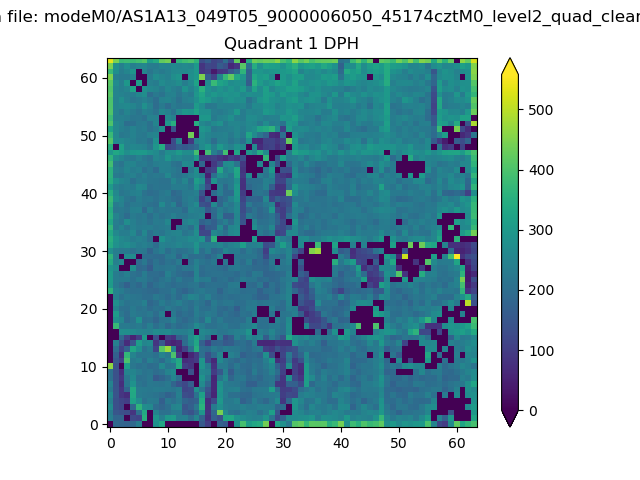 |
Quadrant B |
|---|---|---|---|
| Quadrant D | 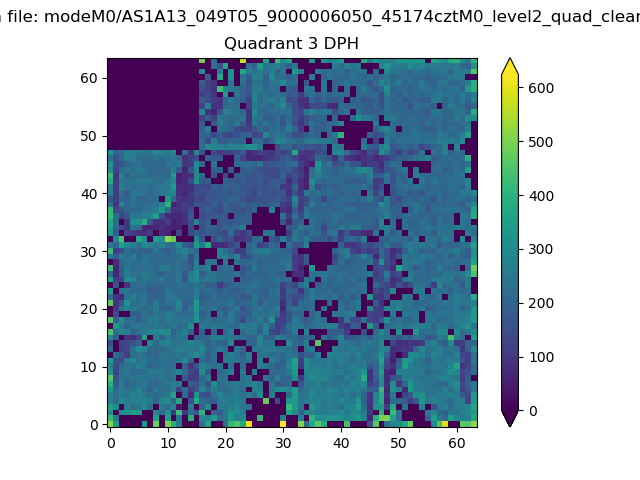 |
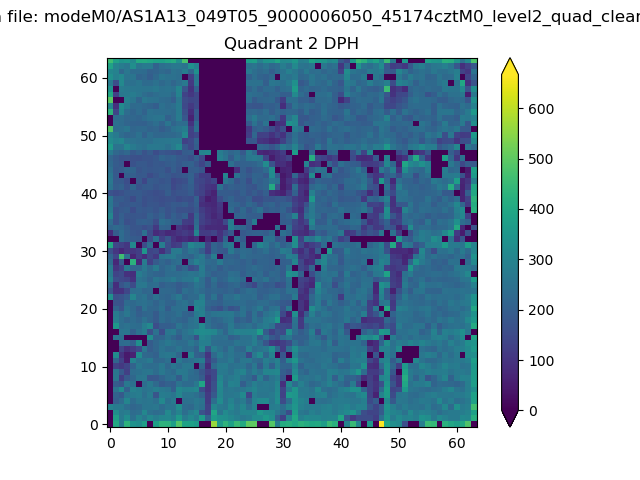 |
Quadrant C |
| Plot type | Count rate plots | Images |
|---|---|---|
| Comparison with Poisson distribution Blue bars denote a histogram of data divided into 1 sec bins. Red curve is a Poisson curve with rate = median count rate of data. |
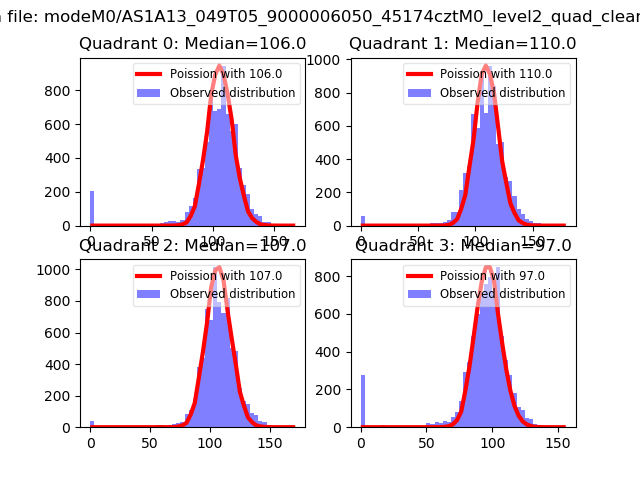 |
 |
| Quadrant-wise count rates Data is divided into 100 sec bins |
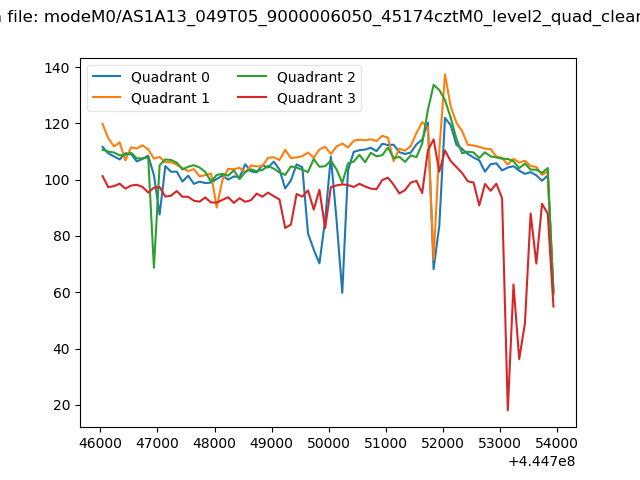 |
|
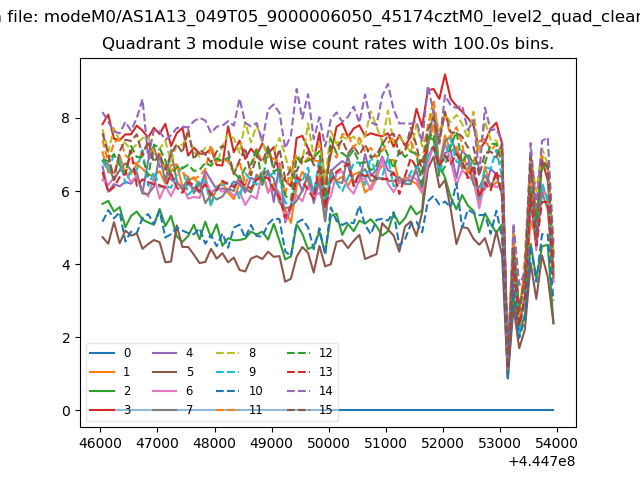
| Module-wise count rates for Quadrant A Data is divided into 100 sec bins |
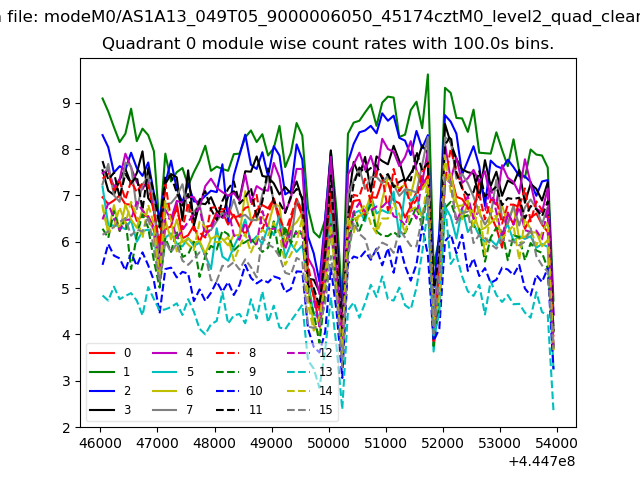 |
 |
| Module-wise count rates for Quadrant B Data is divided into 100 sec bins |
 |
 |
| Module-wise count rates for Quadrant C Data is divided into 100 sec bins |
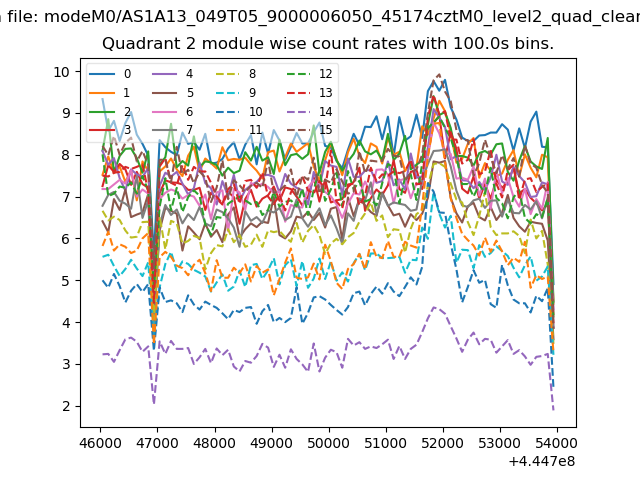 |
 |
| Module-wise count rates for Quadrant D Data is divided into 100 sec bins |
 |
 |
| Parameter | Plot |
|---|---|
| CZT HV Monitor | 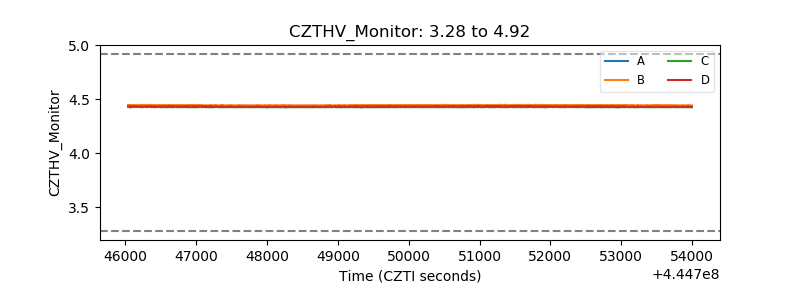 |
| D_VDD | 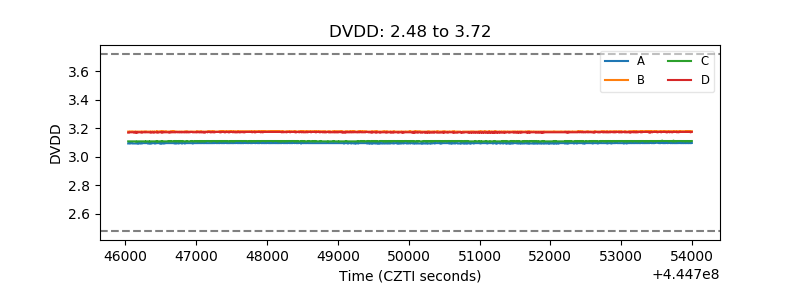 |
| Temperature 1 | 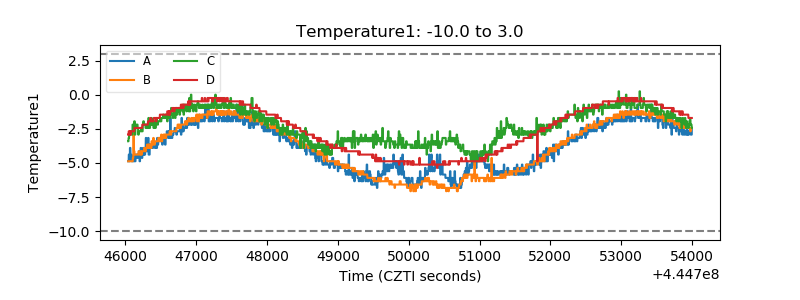 |
| Veto HV Monitor | 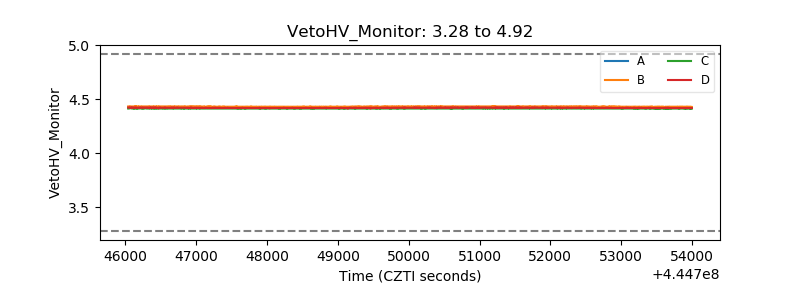 |
| Veto LLD | 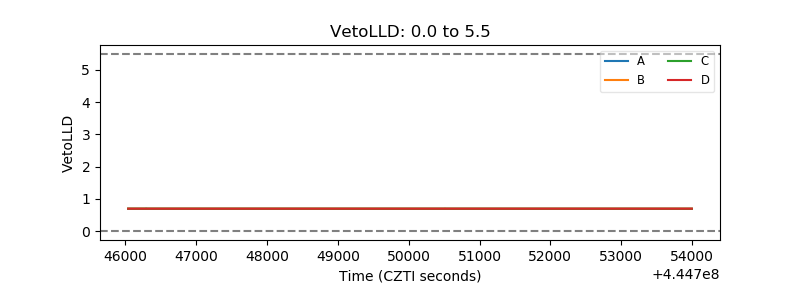 |
| Alpha Counter | 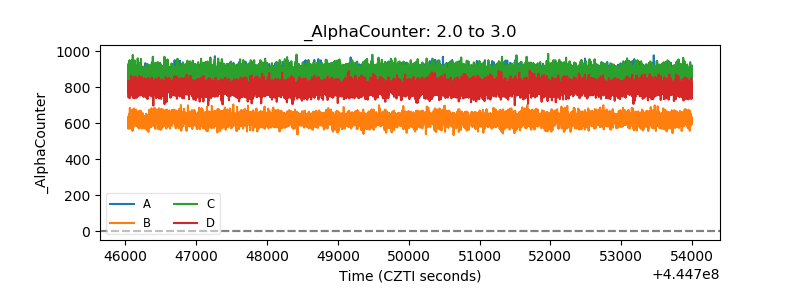 |
| _CPM_Rate | 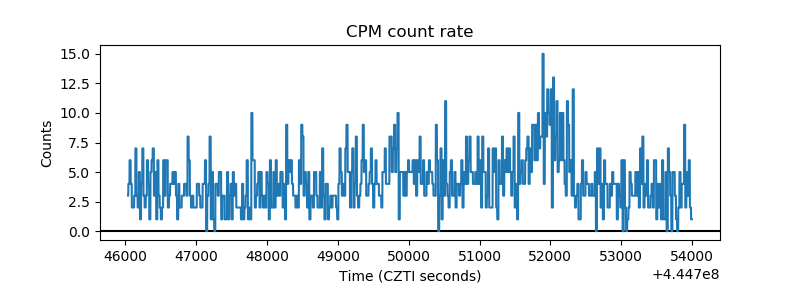 |
| CZT Counter | 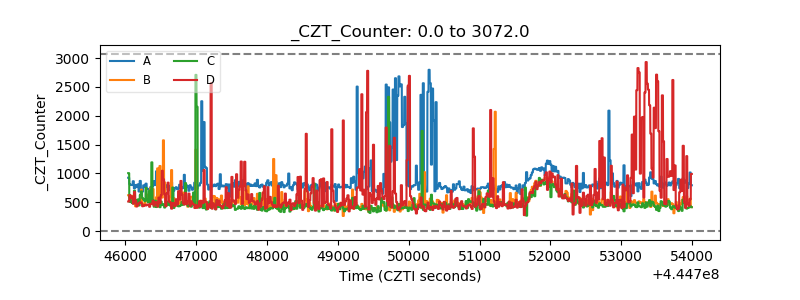 |
| +2.5 Volts monitor | 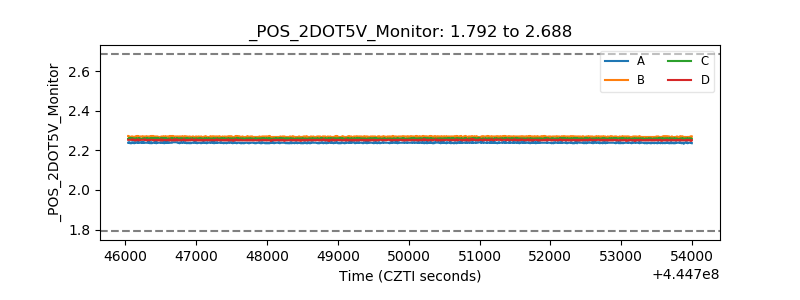 |
| +5 Volts monitor | 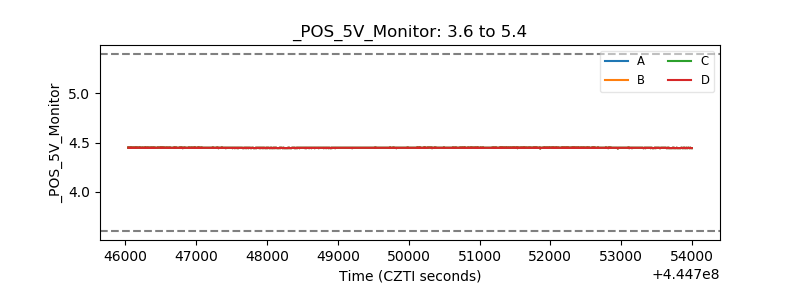 |
| _ROLL_ROT | 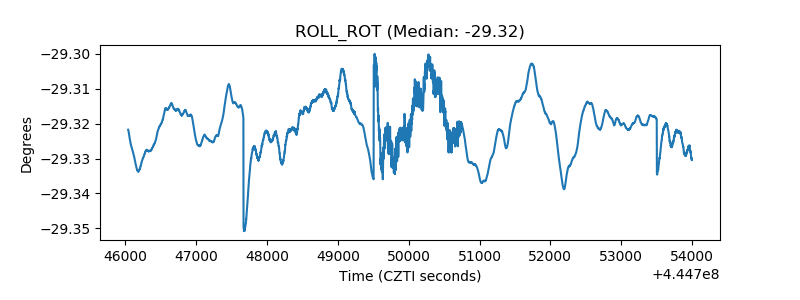 |
| _Roll_DEC | 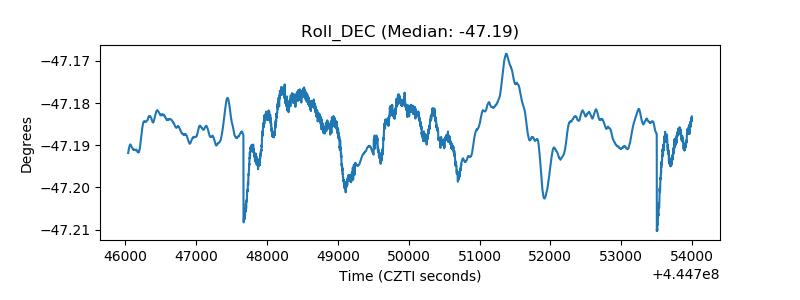 |
| _Roll_RA | 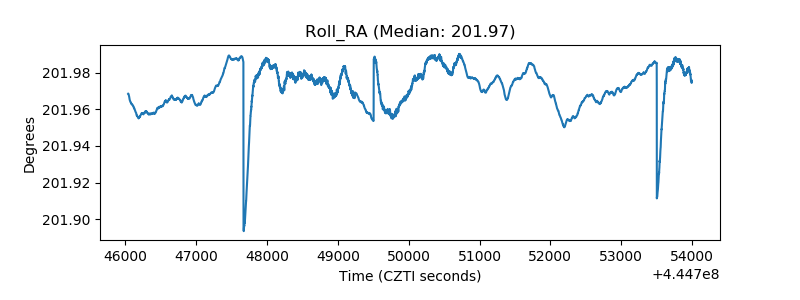 |
| Veto Counter | 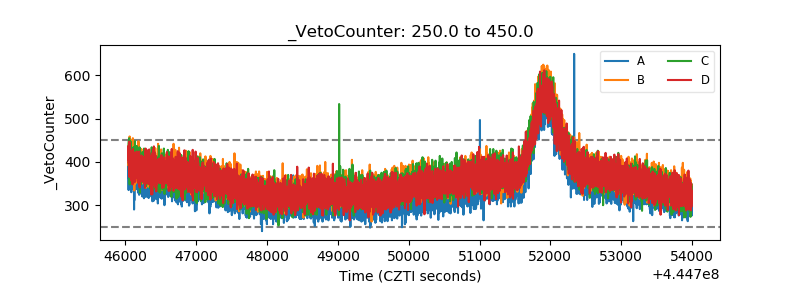 |