| Param | Original file | Final file |
|---|---|---|
| Filename | modeM0/AS1A13_049T05_9000006050_45175cztM0_level2.fits | modeM0/AS1A13_049T05_9000006050_45175cztM0_level2_quad_clean.evt |
| Size (bytes) | 582,030,720 | 113,840,640 |
| Size | 555.1 MB | 108.6 MB |
| Events in quadrant A | 6,212,703 | 758,065 |
| Events in quadrant B | 3,912,864 | 784,830 |
| Events in quadrant C | 3,630,525 | 780,221 |
| Events in quadrant D | 7,221,258 | 614,253 |
| Mode M0 | |||
|---|---|---|---|
| Quadrant | BADHDUFLAG | Total packets | Discarded packets |
| A | 0 | 23537 | 0 |
| B | 0 | 16393 | 0 |
| C | 0 | 15901 | 0 |
| D | 0 | 26555 | 0 |
| Mode SS | |||
|---|---|---|---|
| Quadrant | BADHDUFLAG | Total packets | Discarded packets |
| A | 0 | 146 | 0 |
| B | 0 | 146 | 0 |
| C | 0 | 146 | 0 |
| D | 0 | 146 | 0 |
| Quadrant | Total seconds | Saturated seconds | Saturation percentage |
|---|---|---|---|
| A | 7317 | 343 | 4.687714% |
| B | 7317 | 205 | 2.801695% |
| C | 7317 | 59 | 0.806341% |
| D | 7317 | 1194 | 16.318163% |
Noise dominated data is calculated using 1-second bins in cleaned event files. If a bin has >2000 counts, and if more than 50% of those come from <1% of pixels, then it is considered to be noise-dominated and hence unusable.
| Quadrant | # 1 sec bins | Bins with >0 counts | Bins with >2000 counts | High rate bins dominated by noise | Noise dominated (total time) | Noise dominated (detector-on time) | Marked lightcurve |
|---|---|---|---|---|---|---|---|
| A | 7317 | 7317 | 114 | 114 | 1.56% | 1.56% | 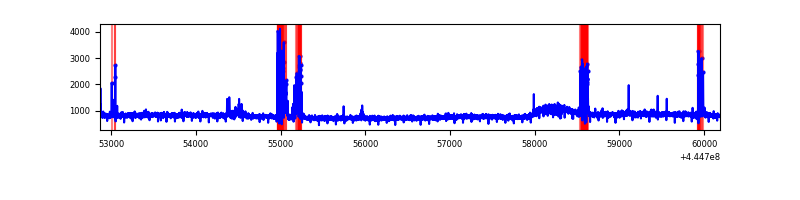 |
| B | 7317 | 7317 | 18 | 18 | 0.25% | 0.25% | 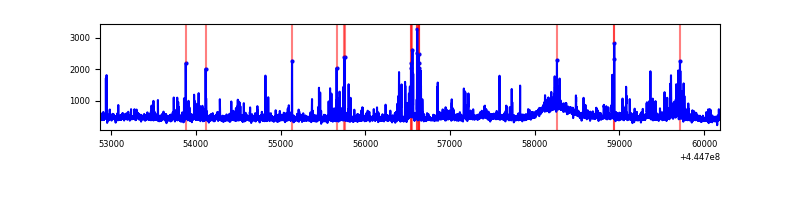 |
| C | 7317 | 7317 | 28 | 28 | 0.38% | 0.38% | 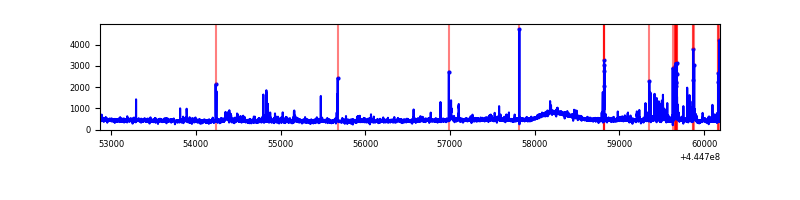 |
| D | 7317 | 7317 | 970 | 970 | 13.26% | 13.26% | 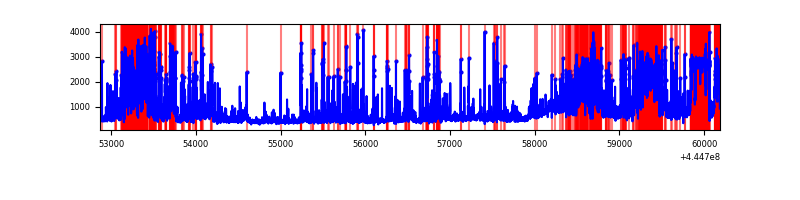 |
Top three noisy pixels from each quadrant. If the there are fewer than three noisy pixels in the level2.evt file, extra rows are filled as -1
| Pixel properties | Quadrant properties | ||||||
|---|---|---|---|---|---|---|---|
| Quadrant | DetID | PixID | Counts | Sigma | Mean | Median | Sigma |
| A | 10 | 83 | 2517598 | 14576.55 | 827 | 809 | 172.7 |
| A | 15 | 223 | 305482 | 1764.58 | 827 | 809 | 172.7 |
| A | 15 | 174 | 164829 | 949.96 | 827 | 809 | 172.7 |
| B | 3 | 112 | 365117 | 2180.19 | 831 | 803 | 167.1 |
| B | 0 | 183 | 81140 | 480.77 | 831 | 803 | 167.1 |
| B | 4 | 158 | 56271 | 331.94 | 831 | 803 | 167.1 |
| C | 3 | 233 | 112923 | 581.33 | 822 | 827 | 192.8 |
| C | 15 | 208 | 81315 | 417.41 | 822 | 827 | 192.8 |
| C | 14 | 254 | 81051 | 416.04 | 822 | 827 | 192.8 |
| D | 13 | 249 | 2292518 | 11866.55 | 768 | 743 | 193.1 |
| D | 4 | 232 | 367325 | 1898.12 | 768 | 743 | 193.1 |
| D | 5 | 222 | 360360 | 1862.06 | 768 | 743 | 193.1 |
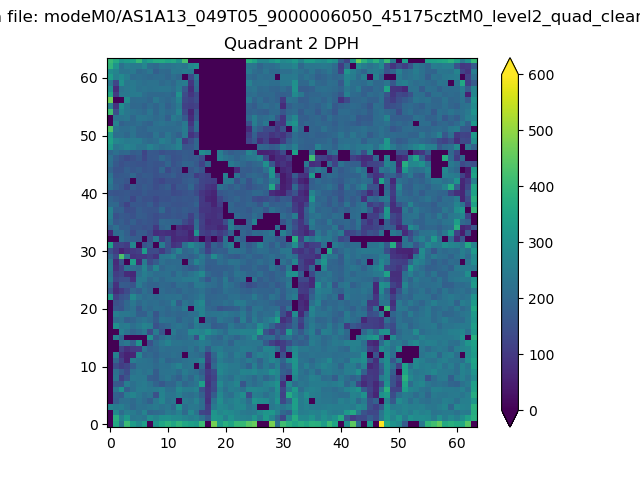
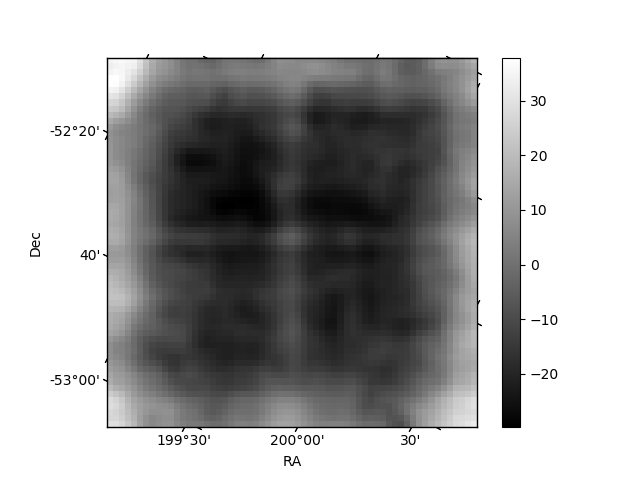
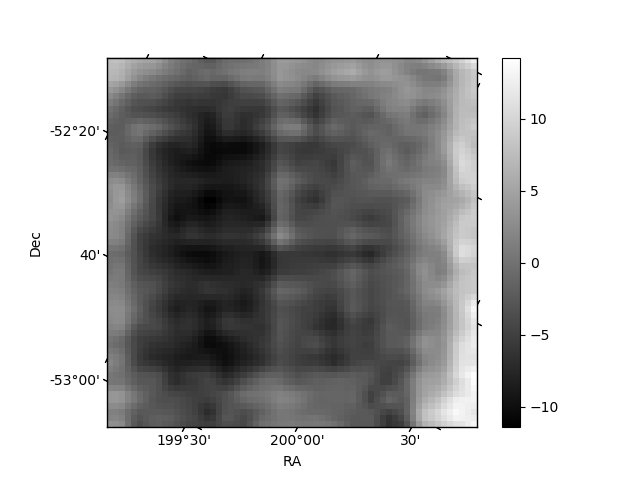
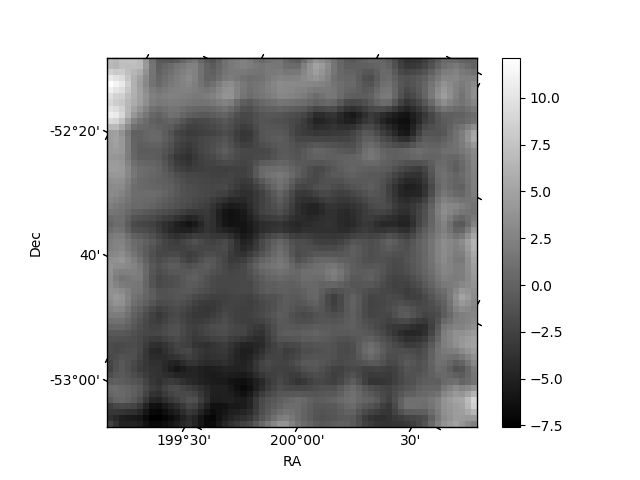
Histogram calculated using DETX and DETY for each event in the final _common_clean file
| Quadrant A | 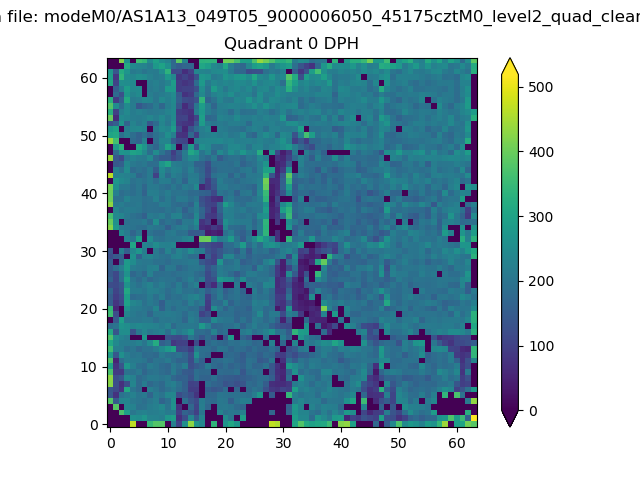 |
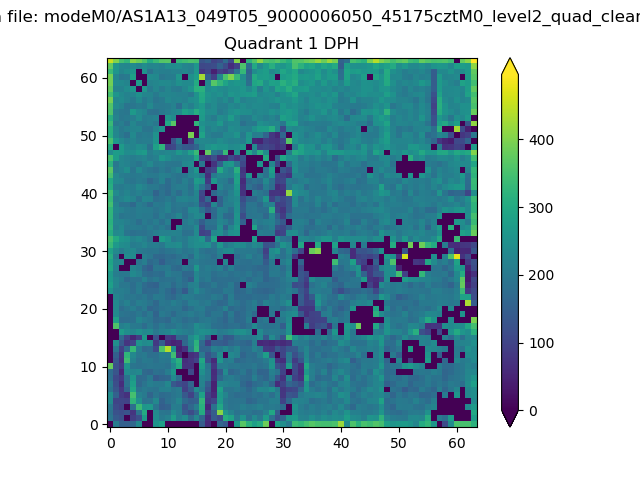 |
Quadrant B |
|---|---|---|---|
| Quadrant D | 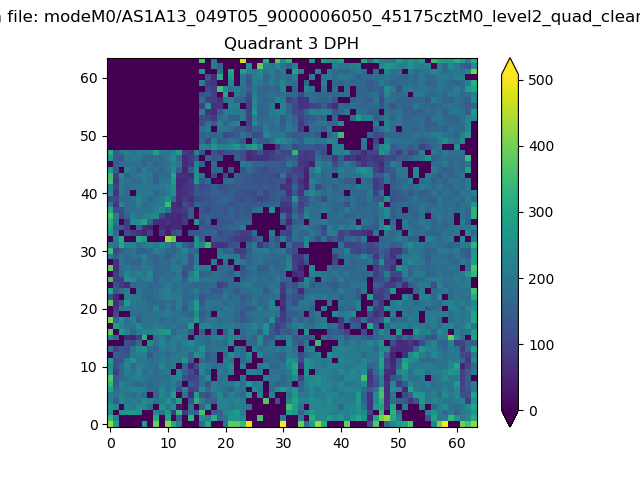 |
 |
Quadrant C |
| Plot type | Count rate plots | Images |
|---|---|---|
| Comparison with Poisson distribution Blue bars denote a histogram of data divided into 1 sec bins. Red curve is a Poisson curve with rate = median count rate of data. |
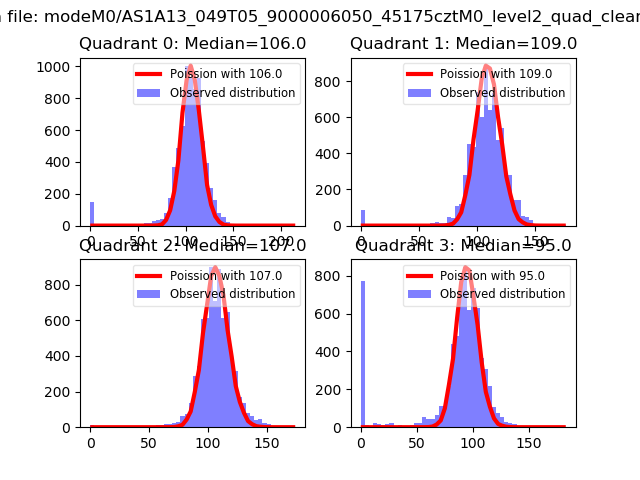 |
 |
| Quadrant-wise count rates Data is divided into 100 sec bins |
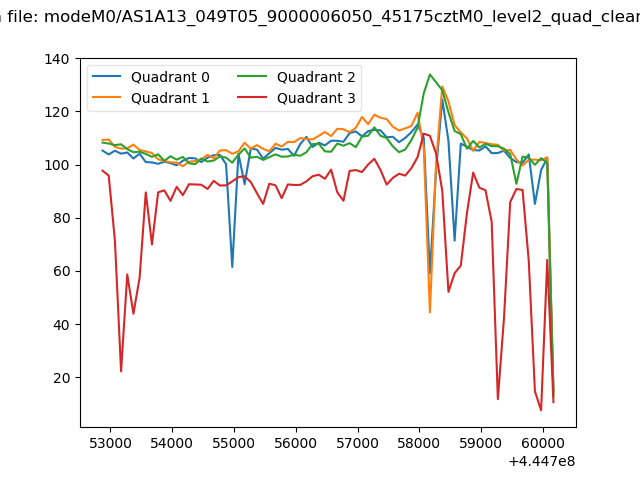 |
|
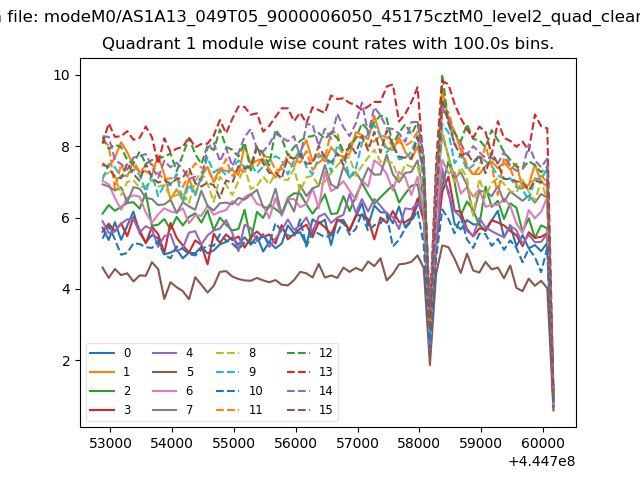
| Module-wise count rates for Quadrant A Data is divided into 100 sec bins |
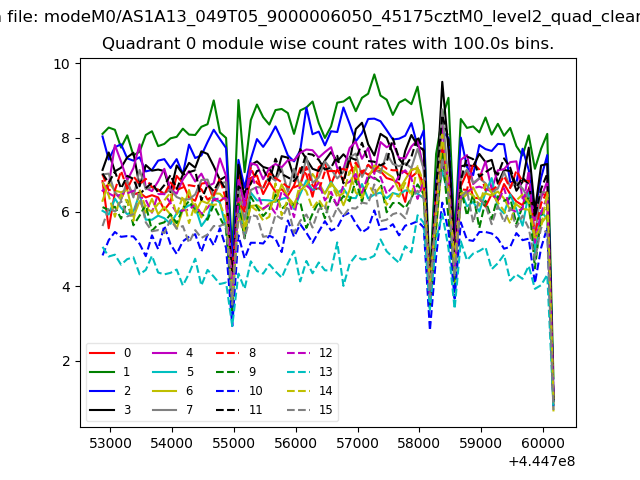 |
 |
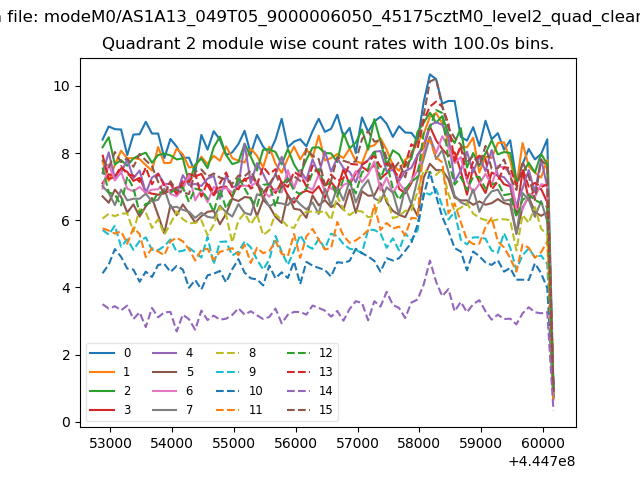
| Module-wise count rates for Quadrant B Data is divided into 100 sec bins |
 |
 |
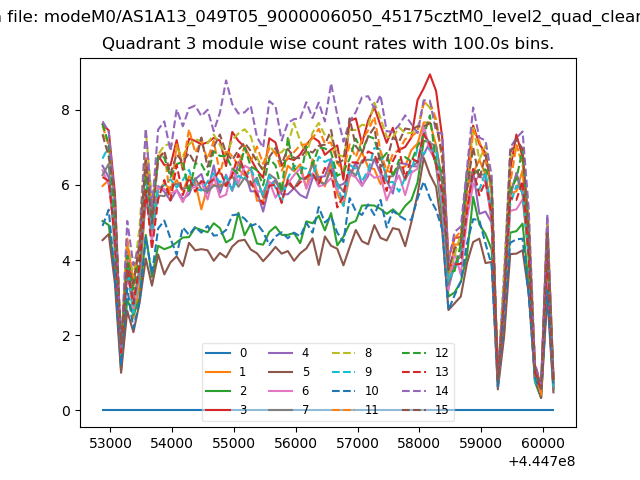
| Module-wise count rates for Quadrant C Data is divided into 100 sec bins |
 |
 |
| Module-wise count rates for Quadrant D Data is divided into 100 sec bins |
 |
 |
| Parameter | Plot |
|---|---|
| CZT HV Monitor | 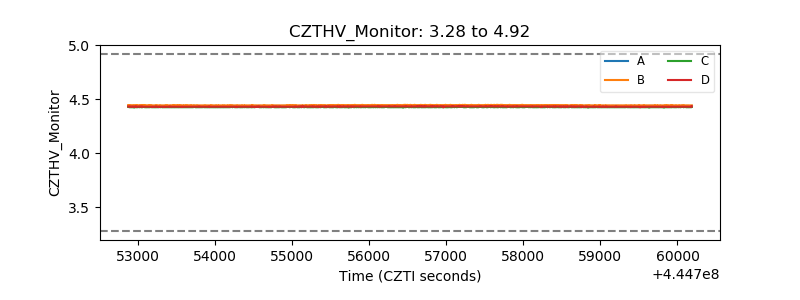 |
| D_VDD | 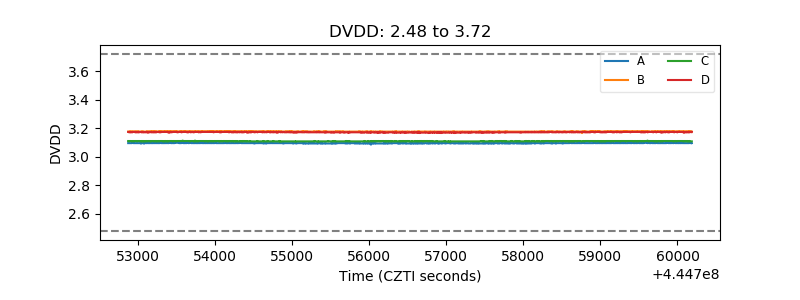 |
| Temperature 1 | 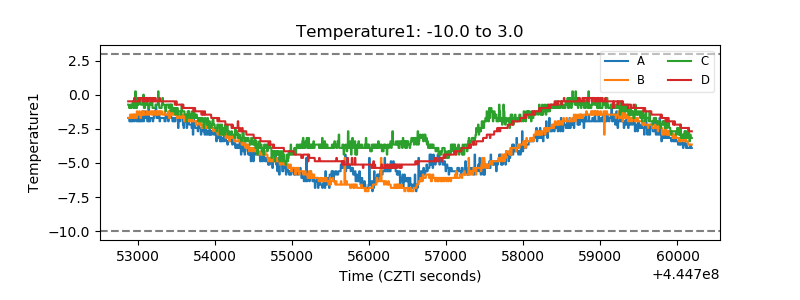 |
| Veto HV Monitor | 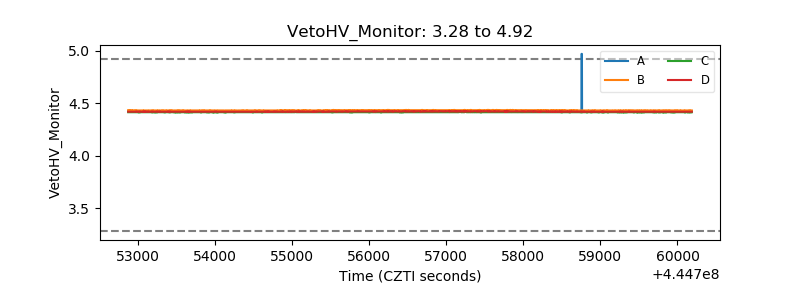 |
| Veto LLD | 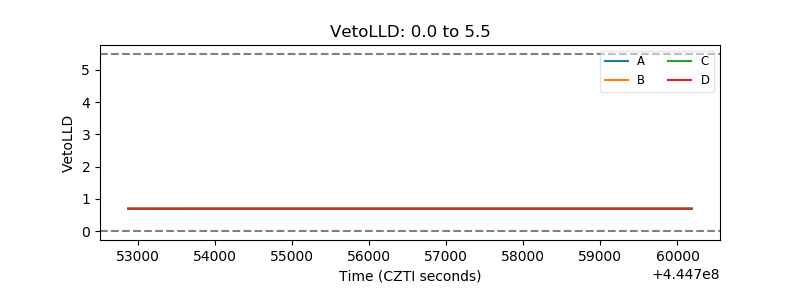 |
| Alpha Counter | 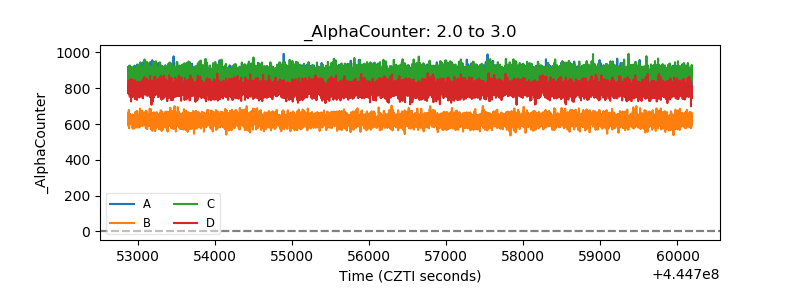 |
| _CPM_Rate | 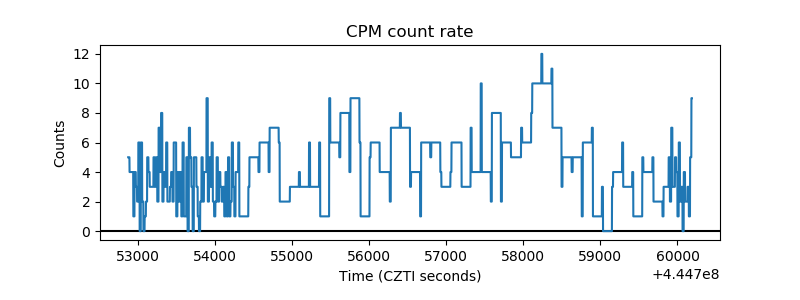 |
| CZT Counter | 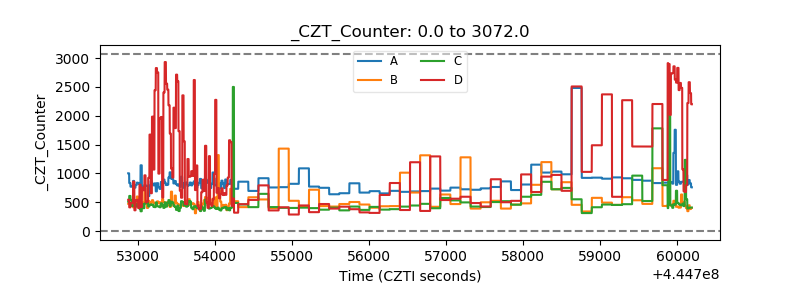 |
| +2.5 Volts monitor | 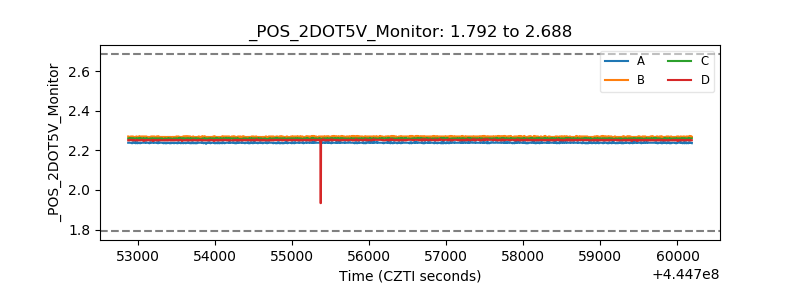 |
| +5 Volts monitor | 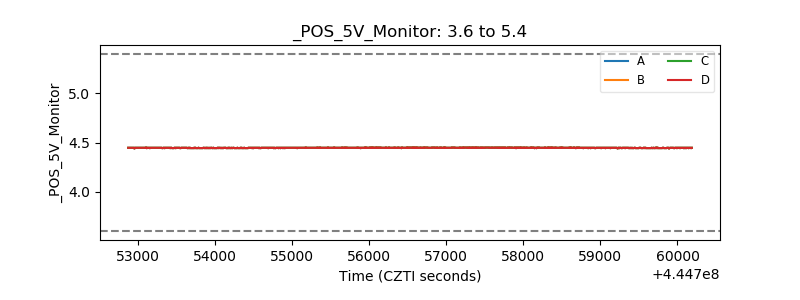 |
| _ROLL_ROT | 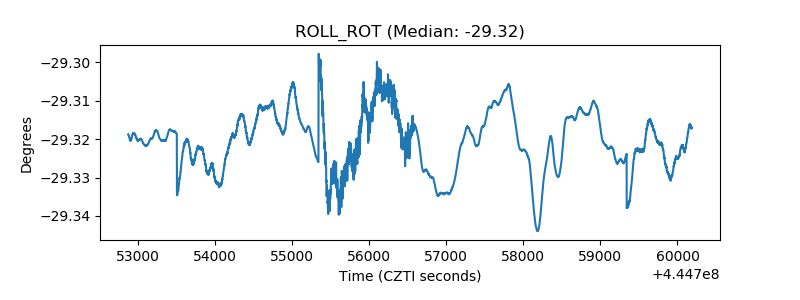 |
| _Roll_DEC | 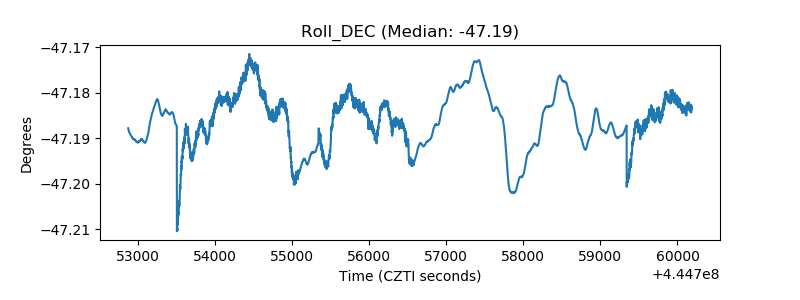 |
| _Roll_RA | 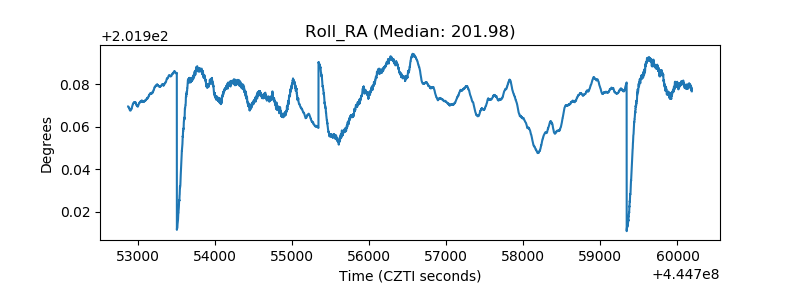 |
| Veto Counter | 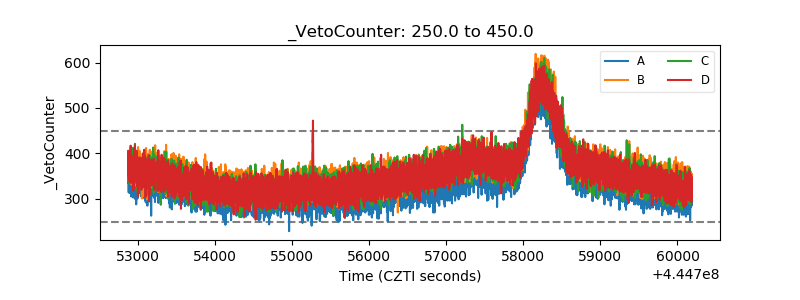 |