| Param | Original file | Final file |
|---|---|---|
| Filename | modeM0/AS1A13_049T05_9000006050_45179cztM0_level2.fits | modeM0/AS1A13_049T05_9000006050_45179cztM0_level2_quad_clean.evt |
| Size (bytes) | 118,488,960 | 18,864,000 |
| Size | 113.0 MB | 18.0 MB |
| Events in quadrant A | 1,167,884 | 121,958 |
| Events in quadrant B | 748,467 | 128,284 |
| Events in quadrant C | 695,416 | 137,890 |
| Events in quadrant D | 1,677,685 | 92,162 |
| Mode M0 | |||
|---|---|---|---|
| Quadrant | BADHDUFLAG | Total packets | Discarded packets |
| A | 0 | 4204 | 2 |
| B | 0 | 2970 | 0 |
| C | 0 | 2853 | 0 |
| D | 0 | 5840 | 0 |
| Mode SS | |||
|---|---|---|---|
| Quadrant | BADHDUFLAG | Total packets | Discarded packets |
| A | 0 | 24 | 0 |
| B | 0 | 24 | 0 |
| C | 0 | 24 | 0 |
| D | 0 | 24 | 0 |
| Quadrant | Total seconds | Saturated seconds | Saturation percentage |
|---|---|---|---|
| A | 1204 | 174 | 14.451827% |
| B | 1205 | 136 | 11.286307% |
| C | 1205 | 21 | 1.742739% |
| D | 1205 | 416 | 34.522822% |
Noise dominated data is calculated using 1-second bins in cleaned event files. If a bin has >2000 counts, and if more than 50% of those come from <1% of pixels, then it is considered to be noise-dominated and hence unusable.
| Quadrant | # 1 sec bins | Bins with >0 counts | Bins with >2000 counts | High rate bins dominated by noise | Noise dominated (total time) | Noise dominated (detector-on time) | Marked lightcurve |
|---|---|---|---|---|---|---|---|
| A | 1204 | 1204 | 31 | 31 | 2.57% | 2.57% | 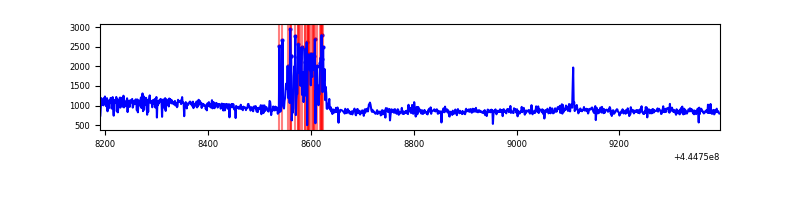 |
| B | 1205 | 1205 | 3 | 3 | 0.25% | 0.25% | 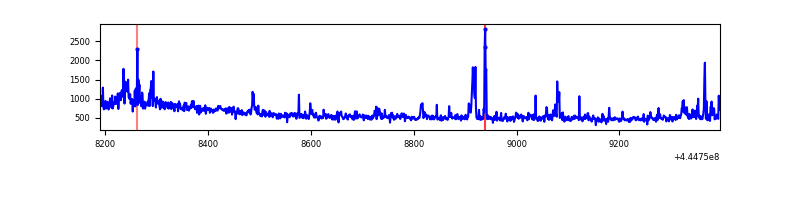 |
| C | 1205 | 1205 | 5 | 5 | 0.41% | 0.41% | 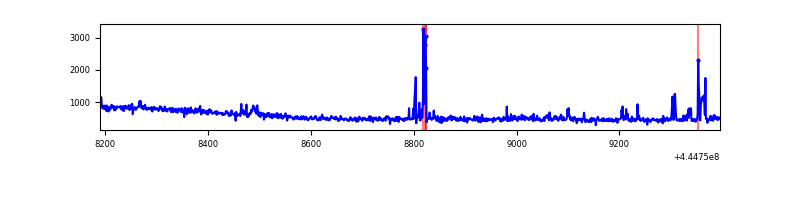 |
| D | 1205 | 1205 | 262 | 262 | 21.74% | 21.74% | 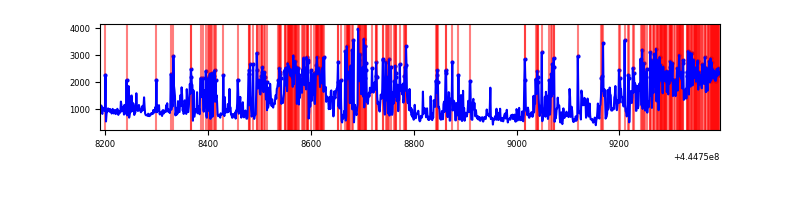 |
Top three noisy pixels from each quadrant. If the there are fewer than three noisy pixels in the level2.evt file, extra rows are filled as -1
| Pixel properties | Quadrant properties | ||||||
|---|---|---|---|---|---|---|---|
| Quadrant | DetID | PixID | Counts | Sigma | Mean | Median | Sigma |
| A | 10 | 83 | 416185 | 11539.73 | 161 | 157 | 36.1 |
| A | 15 | 174 | 90812 | 2514.58 | 161 | 157 | 36.1 |
| A | 15 | 223 | 33185 | 916.13 | 161 | 157 | 36.1 |
| B | 3 | 112 | 43842 | 1251.19 | 160 | 155 | 34.9 |
| B | 15 | 35 | 21514 | 611.72 | 160 | 155 | 34.9 |
| B | 0 | 183 | 15033 | 426.1 | 160 | 155 | 34.9 |
| C | 15 | 208 | 23287 | 588.44 | 161 | 161 | 39.3 |
| C | 12 | 2 | 21586 | 545.16 | 161 | 161 | 39.3 |
| C | 3 | 233 | 13736 | 345.42 | 161 | 161 | 39.3 |
| D | 13 | 249 | 422545 | 10879.58 | 147 | 142 | 38.8 |
| D | 4 | 232 | 227219 | 5848.69 | 147 | 142 | 38.8 |
| D | 1 | 47 | 112737 | 2900.04 | 147 | 142 | 38.8 |
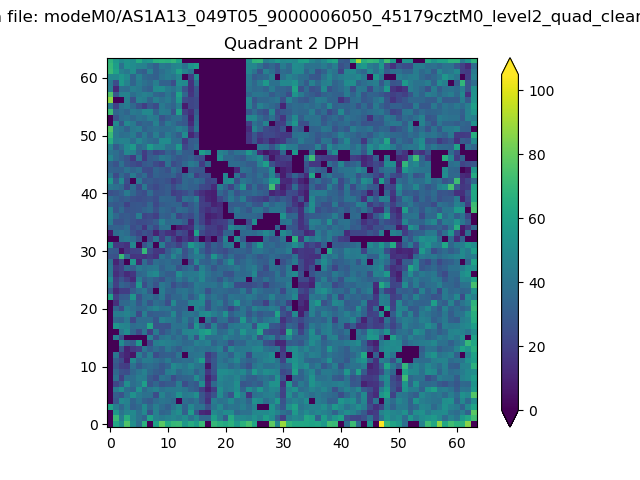
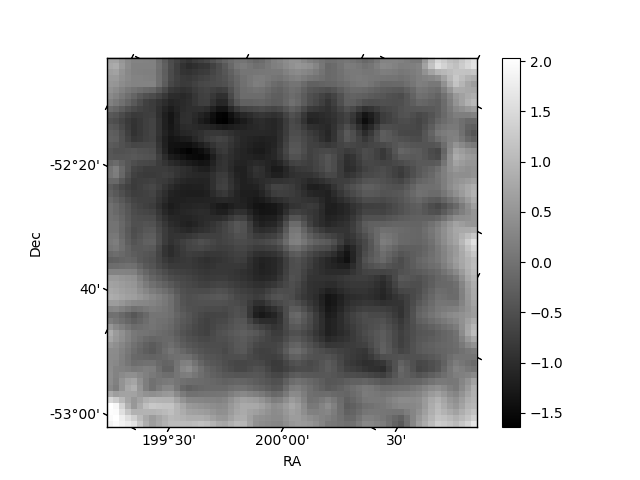
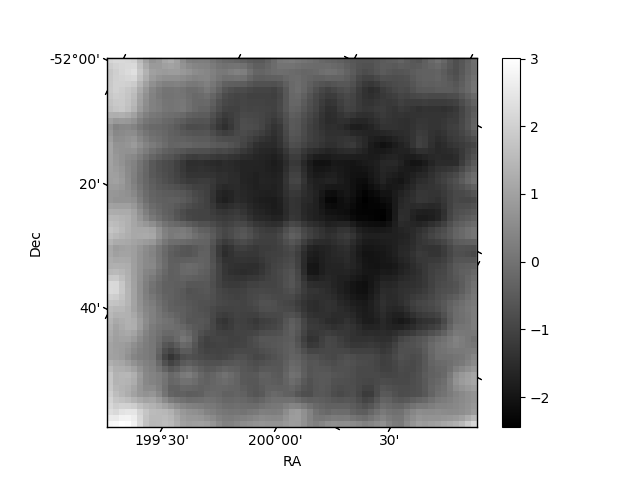
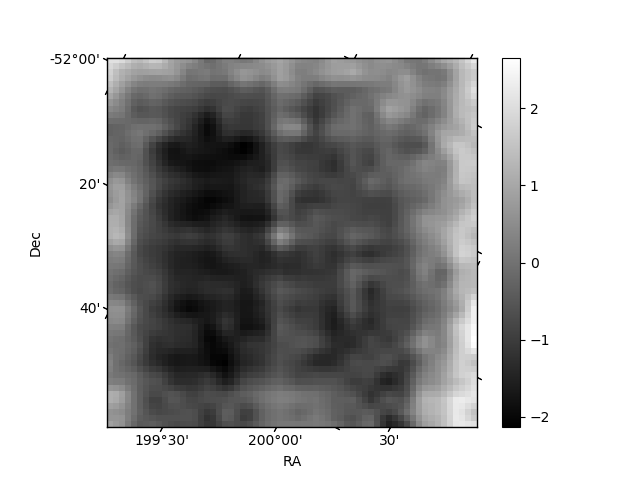
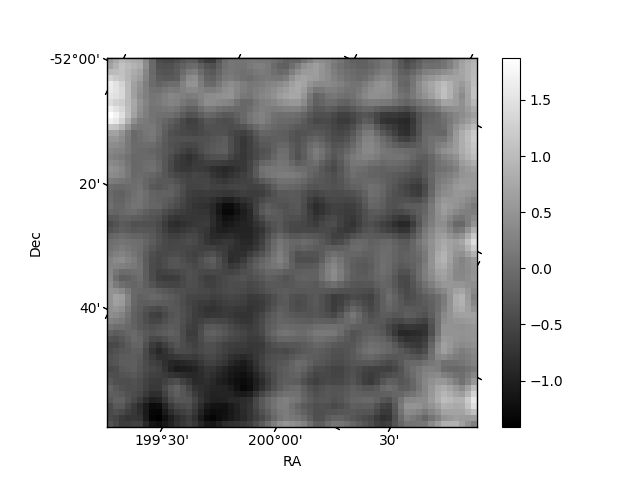
Histogram calculated using DETX and DETY for each event in the final _common_clean file
| Quadrant A | 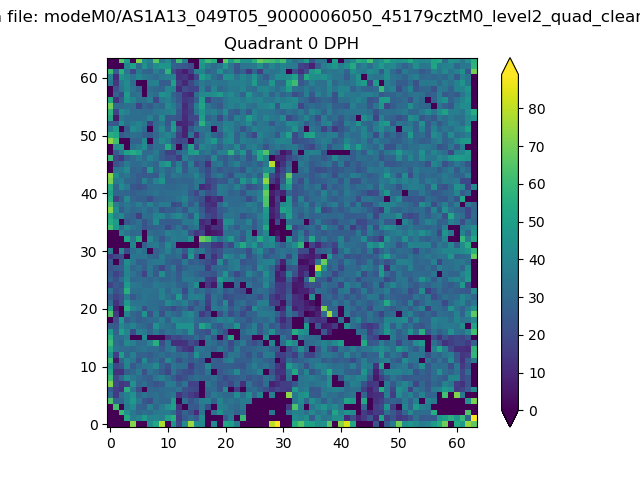 |
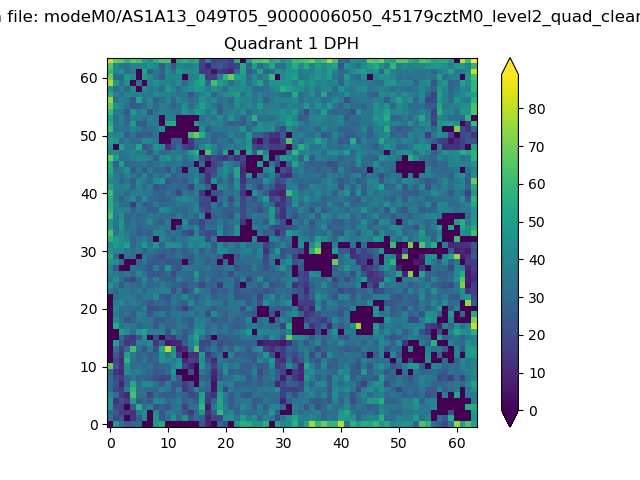 |
Quadrant B |
|---|---|---|---|
| Quadrant D | 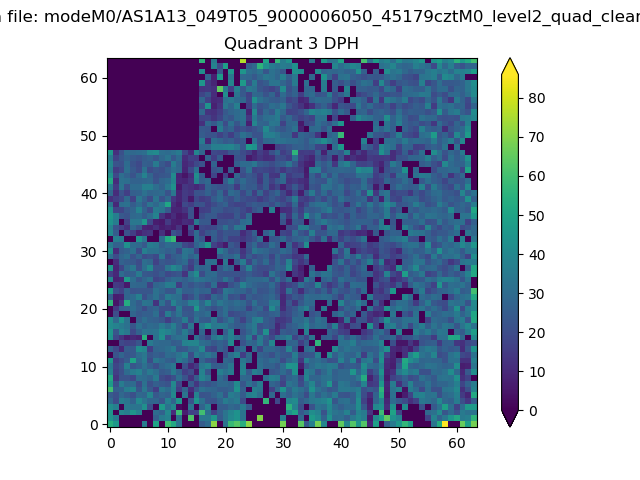 |
 |
Quadrant C |
| Plot type | Count rate plots | Images |
|---|---|---|
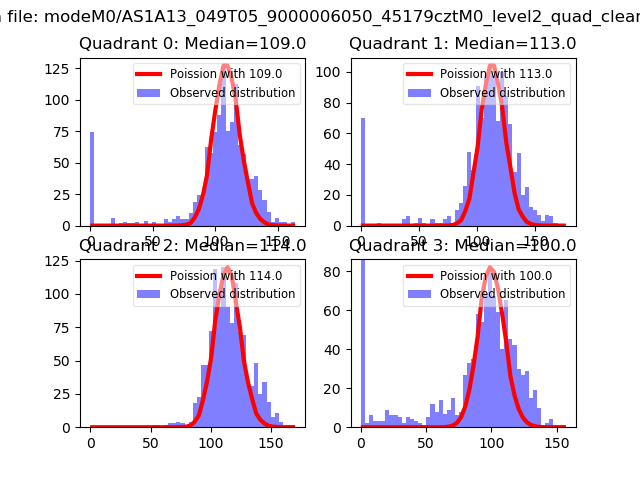
| Comparison with Poisson distribution Blue bars denote a histogram of data divided into 1 sec bins. Red curve is a Poisson curve with rate = median count rate of data. |
 |
 |
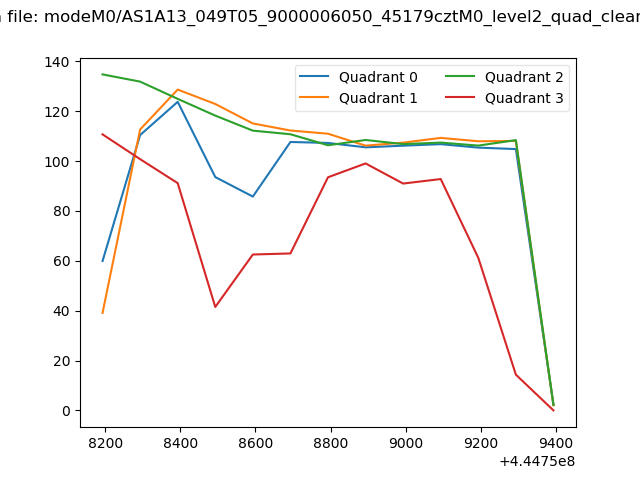
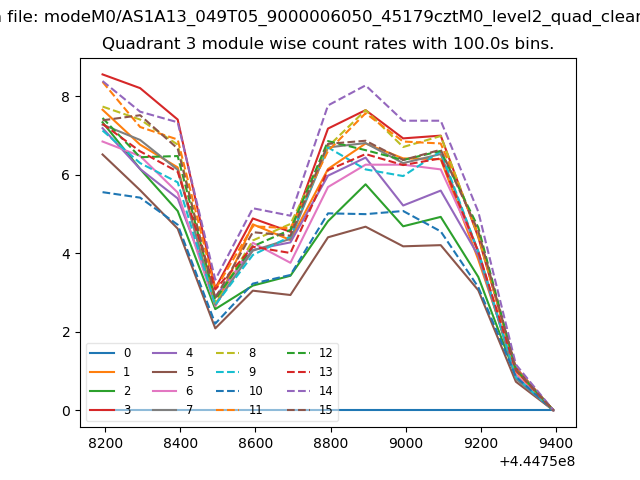
| Quadrant-wise count rates Data is divided into 100 sec bins |
 |
|
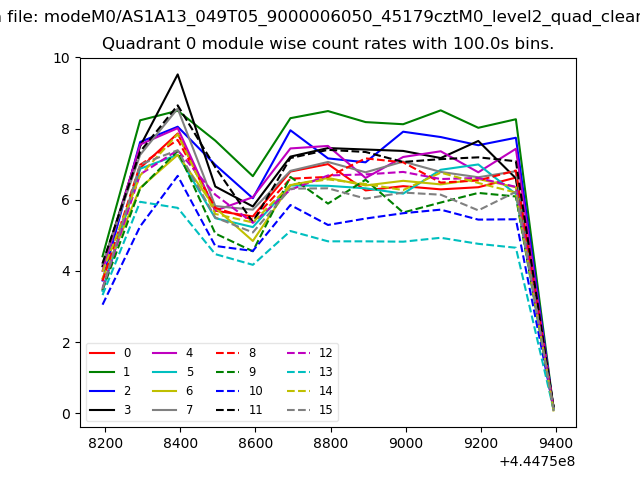
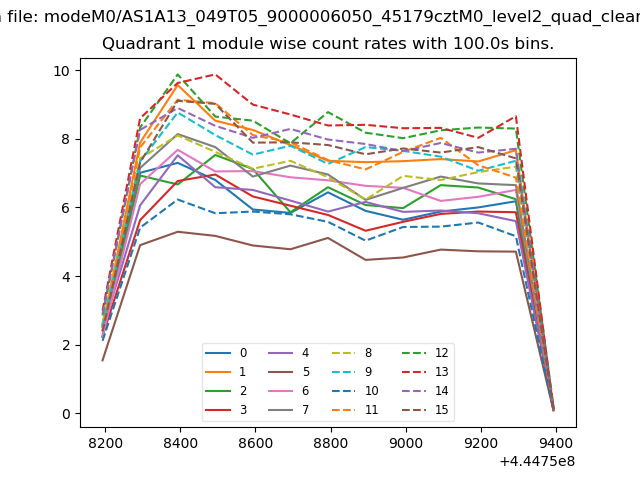
| Module-wise count rates for Quadrant A Data is divided into 100 sec bins |
 |
 |
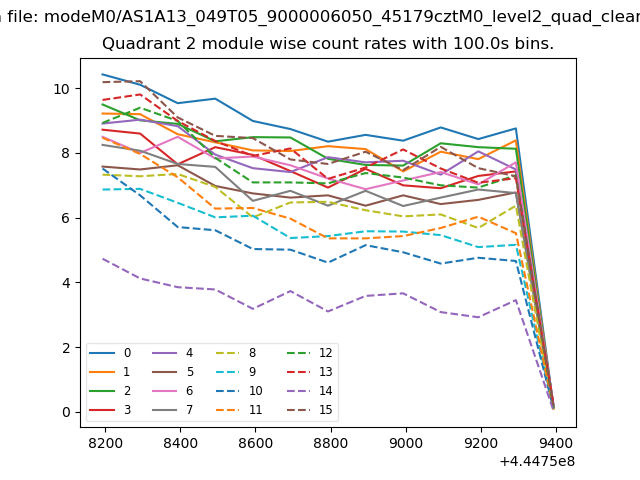
| Module-wise count rates for Quadrant B Data is divided into 100 sec bins |
 |
 |
| Module-wise count rates for Quadrant C Data is divided into 100 sec bins |
 |
 |
| Module-wise count rates for Quadrant D Data is divided into 100 sec bins |
 |
 |
| Parameter | Plot |
|---|---|
| CZT HV Monitor | 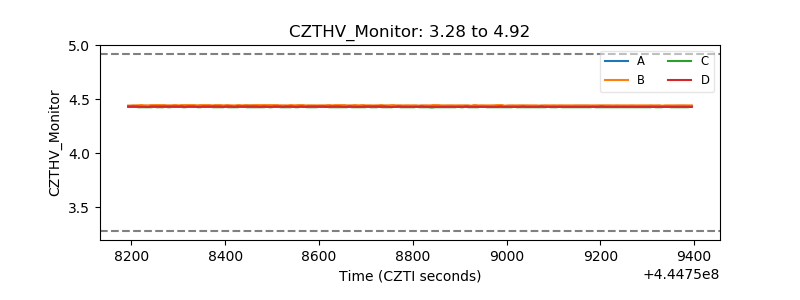 |
| D_VDD | 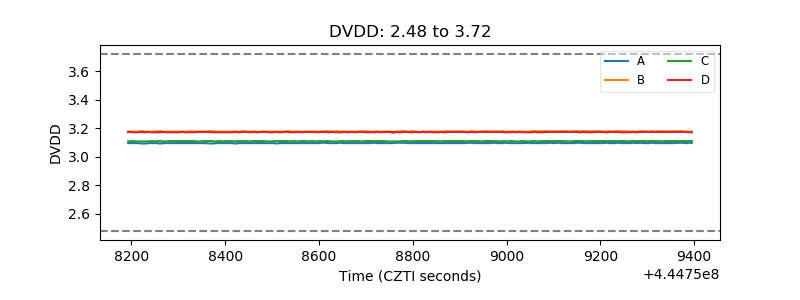 |
| Temperature 1 | 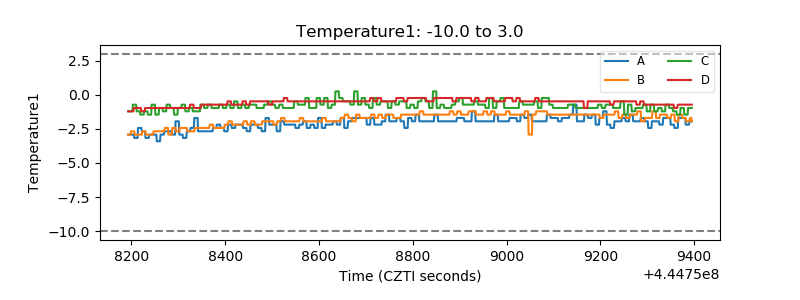 |
| Veto HV Monitor | 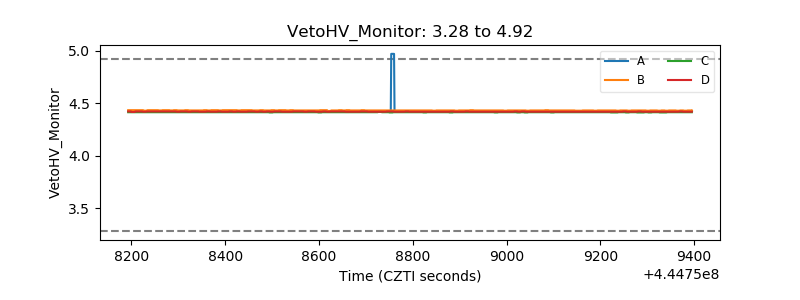 |
| Veto LLD | 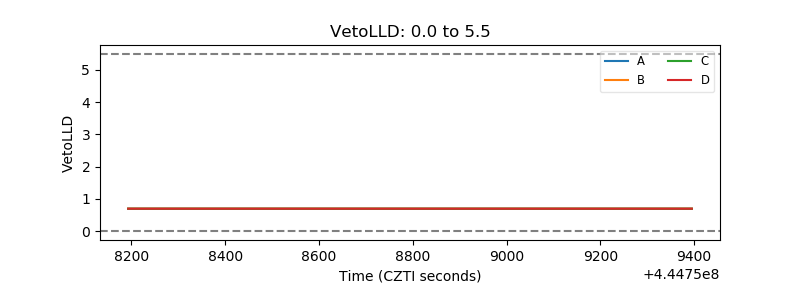 |
| Alpha Counter | 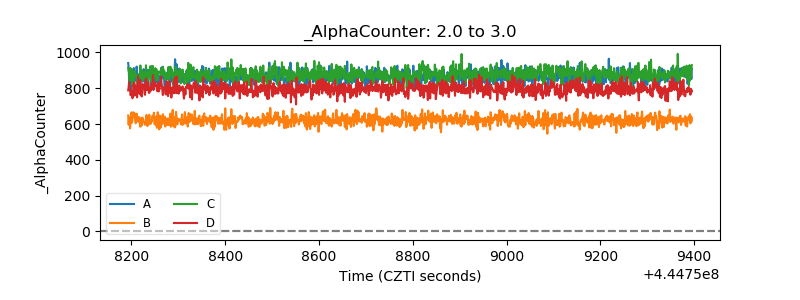 |
| _CPM_Rate | 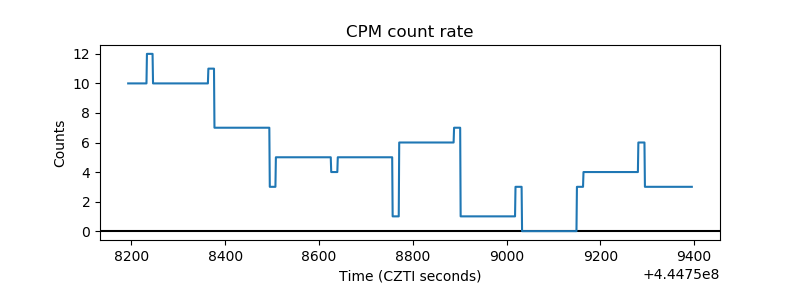 |
| CZT Counter | 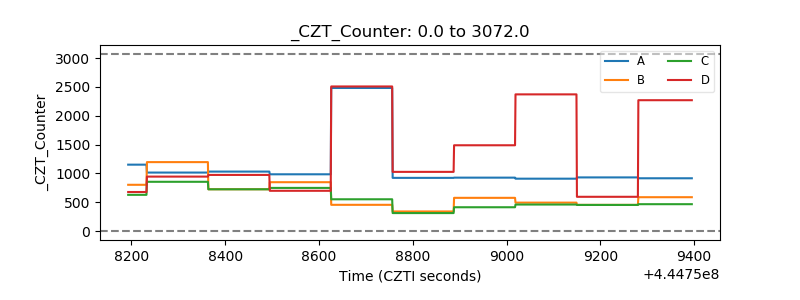 |
| +2.5 Volts monitor | 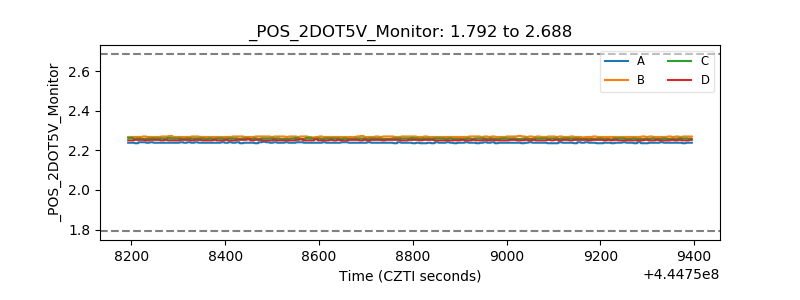 |
| +5 Volts monitor | 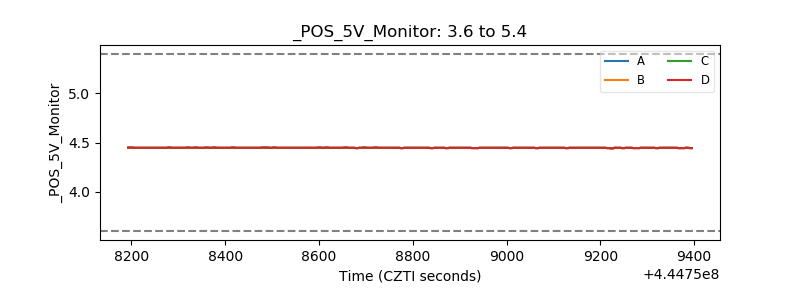 |
| _ROLL_ROT | 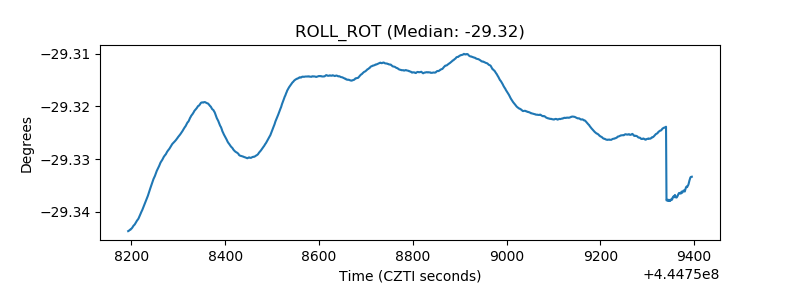 |
| _Roll_DEC | 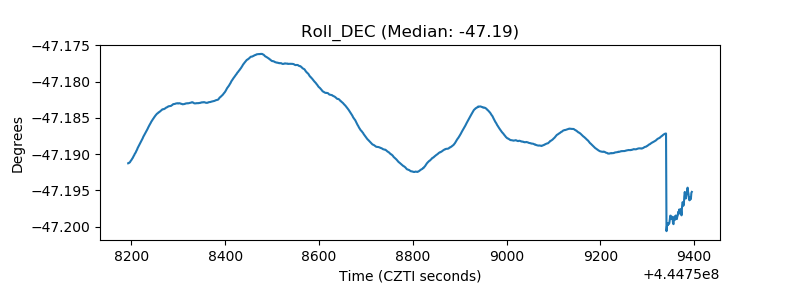 |
| _Roll_RA | 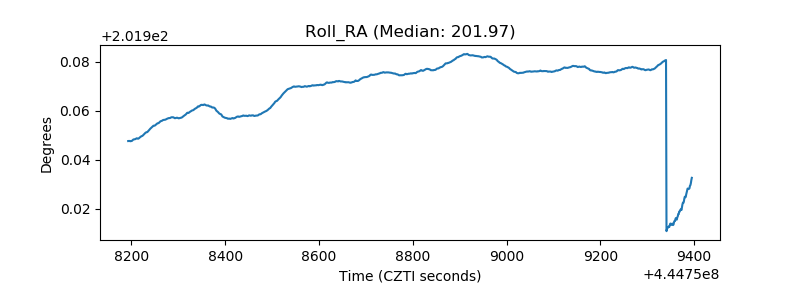 |
| Veto Counter | 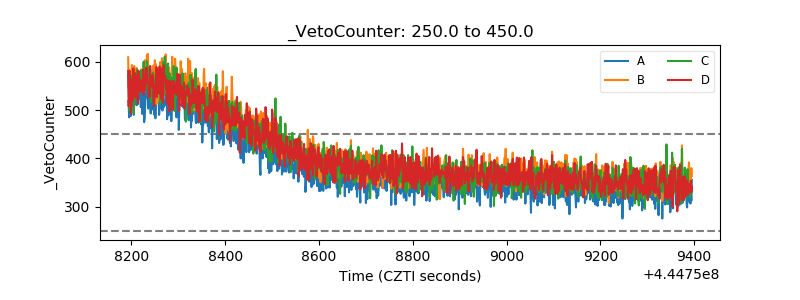 |