| Param | Original file | Final file |
|---|---|---|
| Filename | modeM0/AS1A13_049T05_9000006050_45181cztM0_level2.fits | modeM0/AS1A13_049T05_9000006050_45181cztM0_level2_quad_clean.evt |
| Size (bytes) | 1,949,852,160 | 405,650,880 |
| Size | 1.8 GB | 386.9 MB |
| Events in quadrant A | 21,800,560 | 2,672,447 |
| Events in quadrant B | 13,372,437 | 2,811,013 |
| Events in quadrant C | 12,694,516 | 2,721,981 |
| Events in quadrant D | 22,308,376 | 2,293,041 |
| Mode M0 | |||
|---|---|---|---|
| Quadrant | BADHDUFLAG | Total packets | Discarded packets |
| A | 0 | 84461 | 9 |
| B | 0 | 57172 | 8 |
| C | 0 | 56292 | 7 |
| D | 0 | 84476 | 4 |
| Mode M9 | |||
|---|---|---|---|
| Quadrant | BADHDUFLAG | Total packets | Discarded packets |
| A | 0 | 24 | 0 |
| B | 0 | 24 | 0 |
| C | 0 | 24 | 0 |
| D | 0 | 24 | 0 |
| Mode SS | |||
|---|---|---|---|
| Quadrant | BADHDUFLAG | Total packets | Discarded packets |
| A | 0 | 528 | 0 |
| B | 0 | 528 | 0 |
| C | 0 | 528 | 0 |
| D | 0 | 528 | 0 |
| Quadrant | Total seconds | Saturated seconds | Saturation percentage |
|---|---|---|---|
| A | 25916 | 1140 | 4.398827% |
| B | 25918 | 507 | 1.956169% |
| C | 25917 | 325 | 1.254003% |
| D | 25919 | 2709 | 10.451792% |
Noise dominated data is calculated using 1-second bins in cleaned event files. If a bin has >2000 counts, and if more than 50% of those come from <1% of pixels, then it is considered to be noise-dominated and hence unusable.
| Quadrant | # 1 sec bins | Bins with >0 counts | Bins with >2000 counts | High rate bins dominated by noise | Noise dominated (total time) | Noise dominated (detector-on time) | Marked lightcurve |
|---|---|---|---|---|---|---|---|
| A | 28303 | 25921 | 432 | 432 | 1.53% | 1.67% | 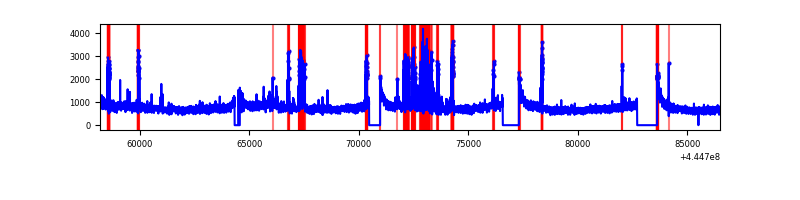 |
| B | 28304 | 25924 | 61 | 61 | 0.22% | 0.24% | 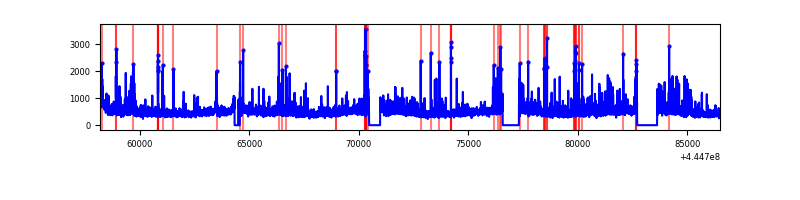 |
| C | 28304 | 25923 | 177 | 177 | 0.63% | 0.68% | 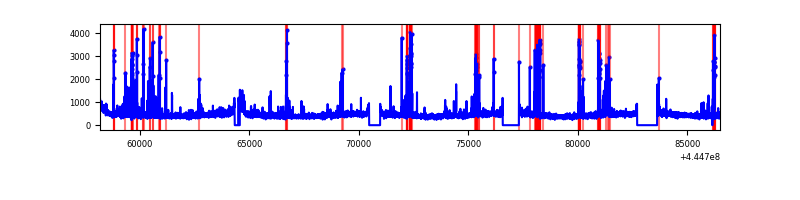 |
| D | 28304 | 25924 | 2139 | 2139 | 7.56% | 8.25% | 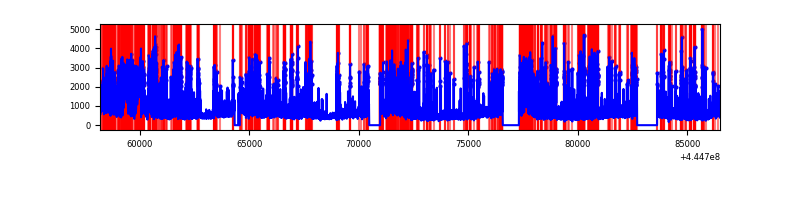 |
Top three noisy pixels from each quadrant. If the there are fewer than three noisy pixels in the level2.evt file, extra rows are filled as -1
| Pixel properties | Quadrant properties | ||||||
|---|---|---|---|---|---|---|---|
| Quadrant | DetID | PixID | Counts | Sigma | Mean | Median | Sigma |
| A | 10 | 83 | 8940408 | 15133.57 | 2864 | 2802 | 590.6 |
| A | 15 | 223 | 1327379 | 2242.84 | 2864 | 2802 | 590.6 |
| A | 15 | 174 | 339631 | 570.33 | 2864 | 2802 | 590.6 |
| B | 3 | 112 | 578599 | 1026.16 | 2886 | 2787 | 561.1 |
| B | 5 | 185 | 485169 | 859.66 | 2886 | 2787 | 561.1 |
| B | 4 | 170 | 284448 | 501.95 | 2886 | 2787 | 561.1 |
| C | 14 | 254 | 909603 | 1368.87 | 2849 | 2866 | 662.4 |
| C | 12 | 250 | 162522 | 241.03 | 2849 | 2866 | 662.4 |
| C | 3 | 233 | 124704 | 183.93 | 2849 | 2866 | 662.4 |
| D | 13 | 249 | 4545452 | 6639.21 | 2730 | 2647 | 684.2 |
| D | 1 | 52 | 1329627 | 1939.35 | 2730 | 2647 | 684.2 |
| D | 5 | 235 | 1120577 | 1633.83 | 2730 | 2647 | 684.2 |
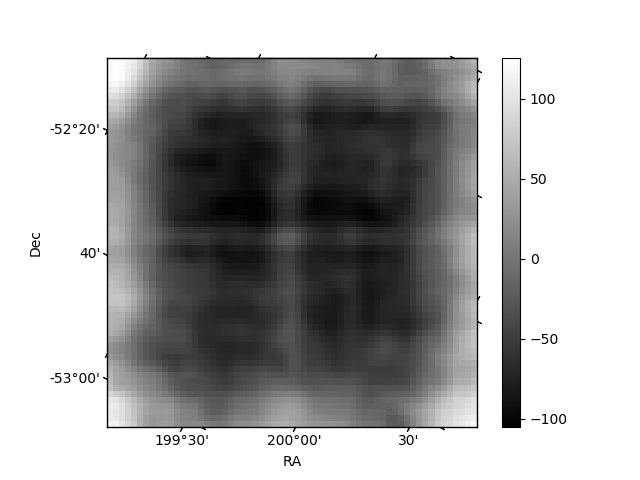
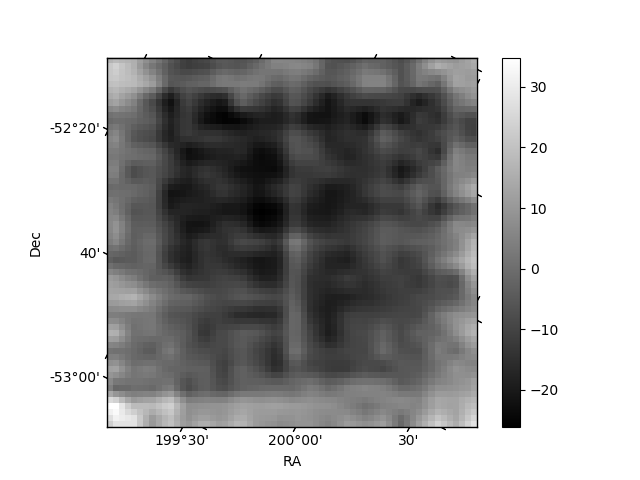
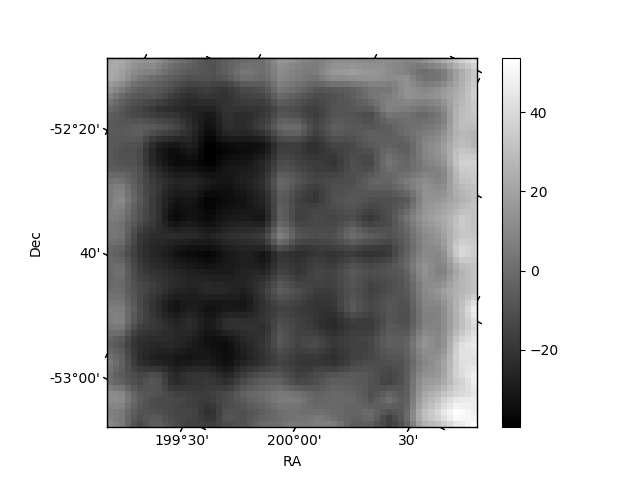
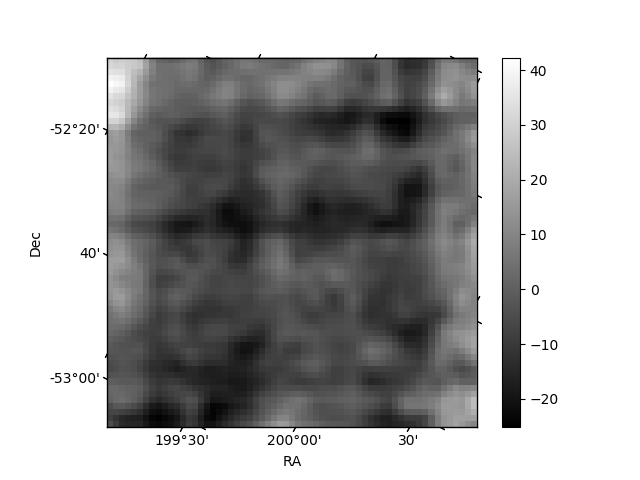
Histogram calculated using DETX and DETY for each event in the final _common_clean file
| Quadrant A | 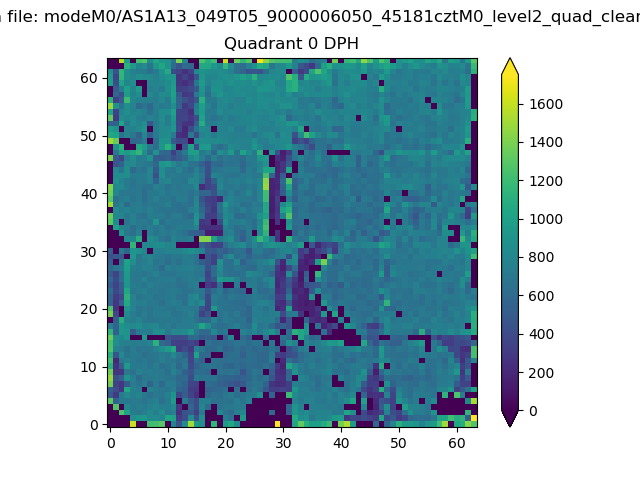 |
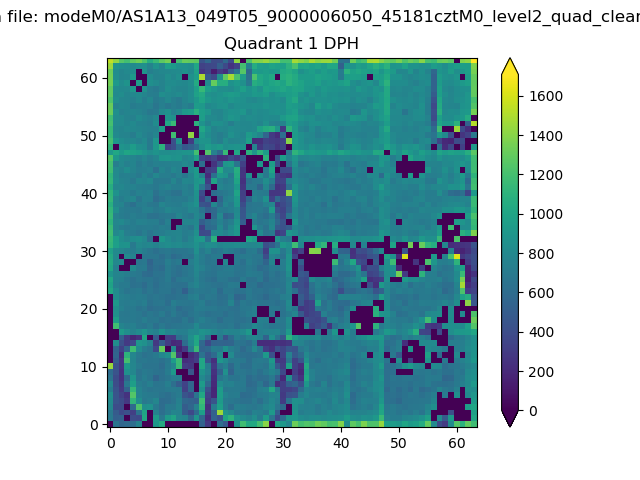 |
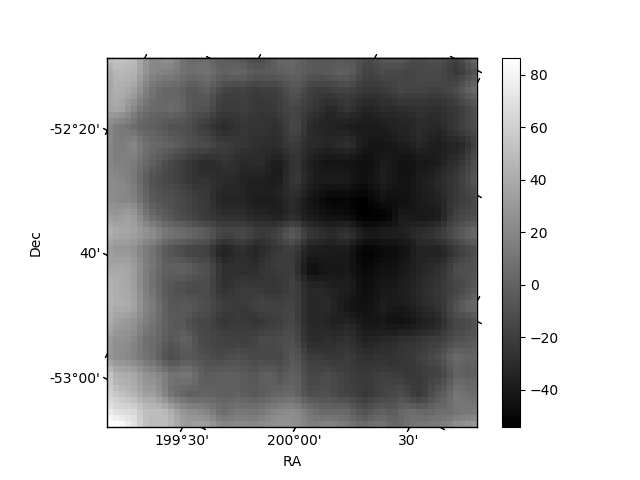
Quadrant B |
|---|---|---|---|
| Quadrant D | 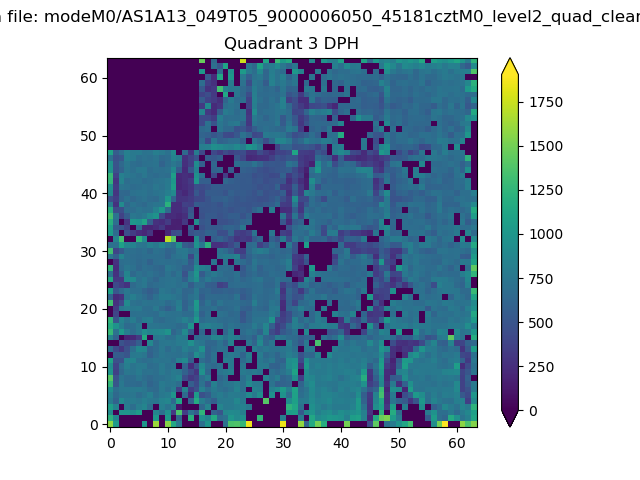 |
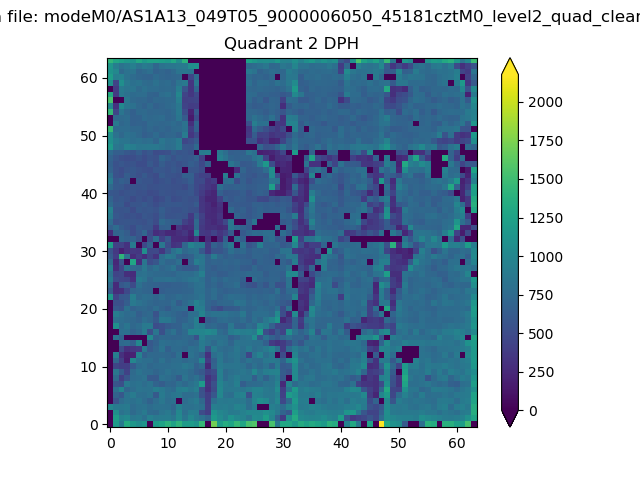 |
Quadrant C |
| Plot type | Count rate plots | Images |
|---|---|---|
| Comparison with Poisson distribution Blue bars denote a histogram of data divided into 1 sec bins. Red curve is a Poisson curve with rate = median count rate of data. |
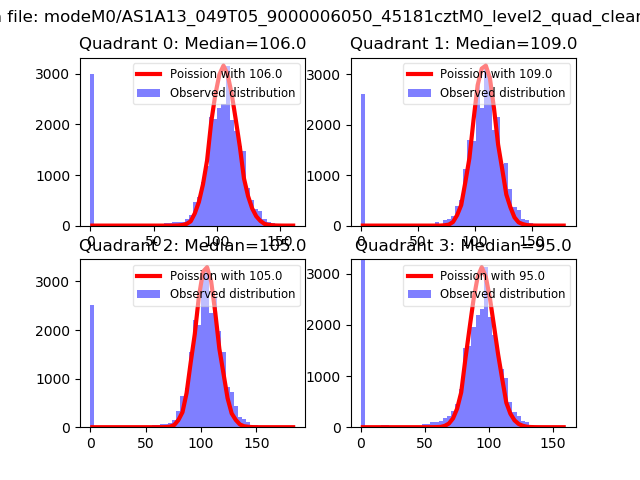 |
 |
| Quadrant-wise count rates Data is divided into 100 sec bins |
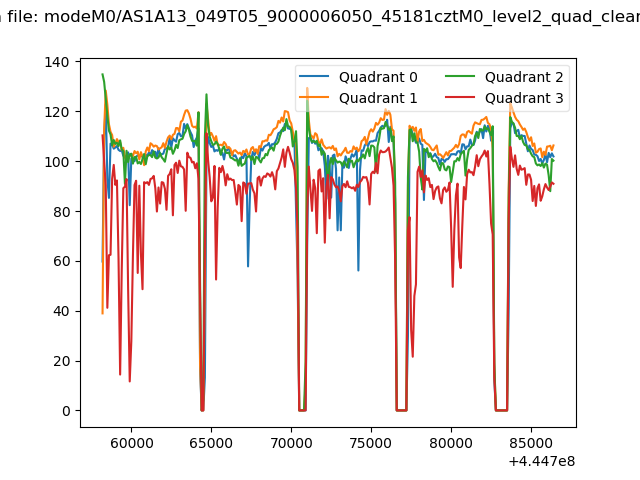 |
|
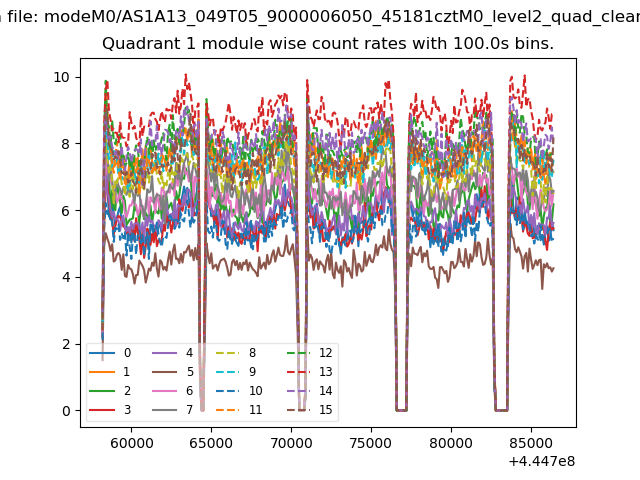
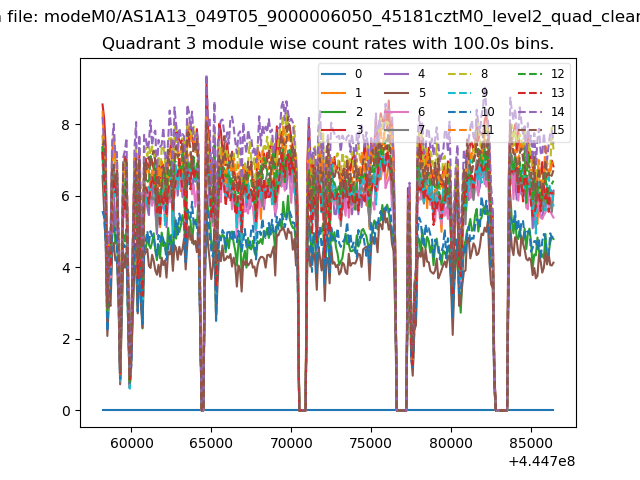
| Module-wise count rates for Quadrant A Data is divided into 100 sec bins |
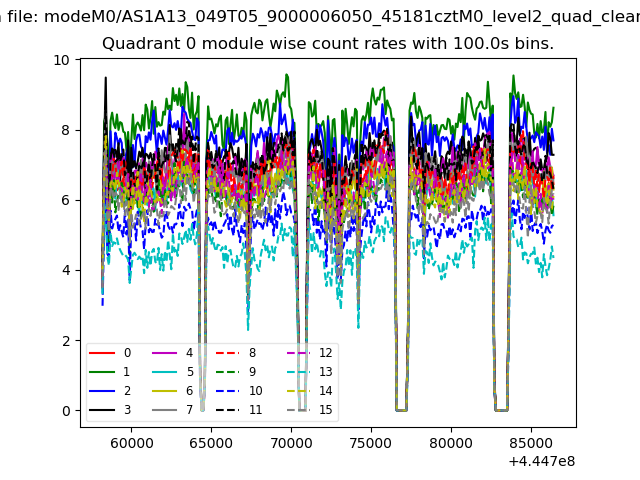 |
 |
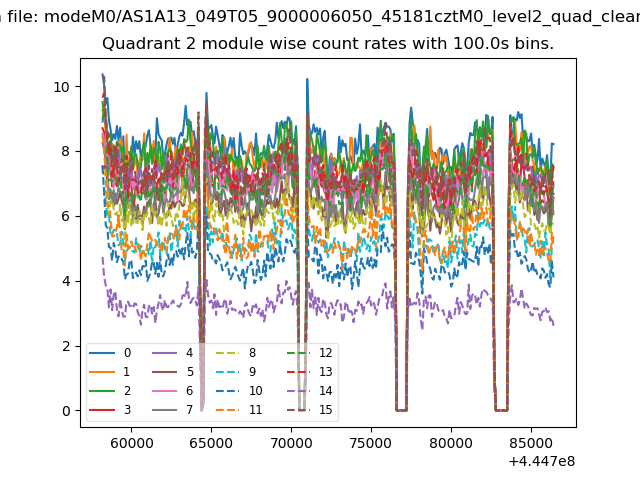
| Module-wise count rates for Quadrant B Data is divided into 100 sec bins |
 |
 |
| Module-wise count rates for Quadrant C Data is divided into 100 sec bins |
 |
 |
| Module-wise count rates for Quadrant D Data is divided into 100 sec bins |
 |
 |
| Parameter | Plot |
|---|---|
| CZT HV Monitor | 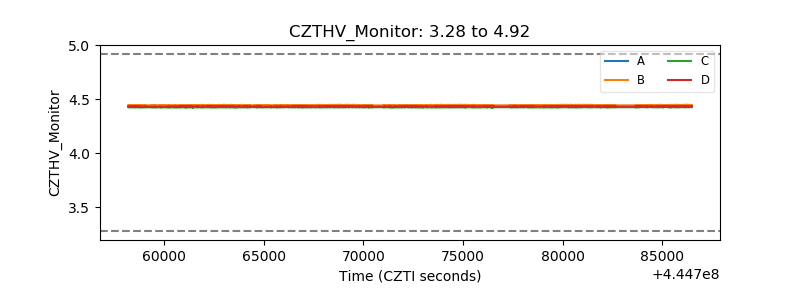 |
| D_VDD | 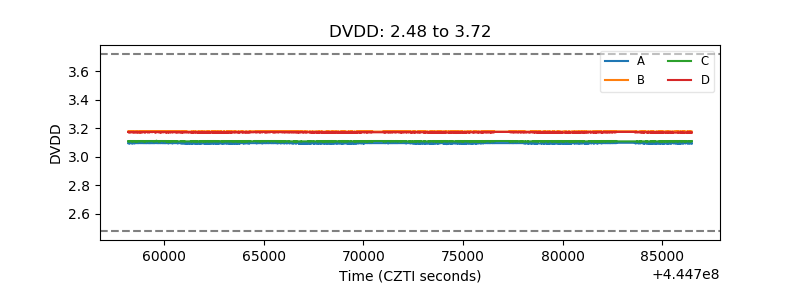 |
| Temperature 1 | 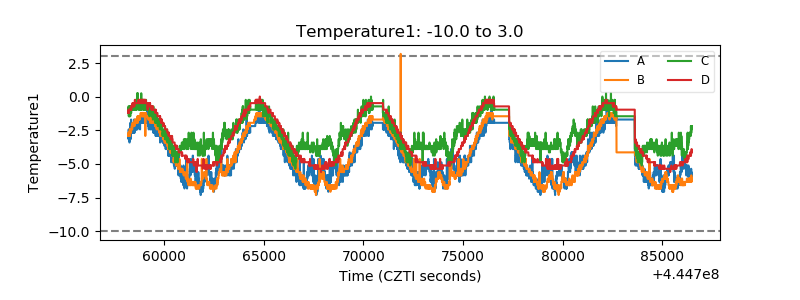 |
| Veto HV Monitor | 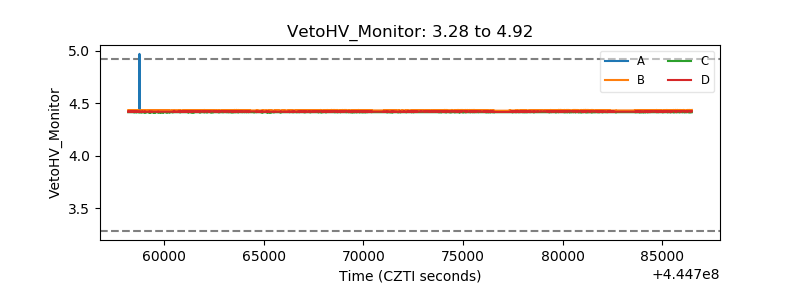 |
| Veto LLD | 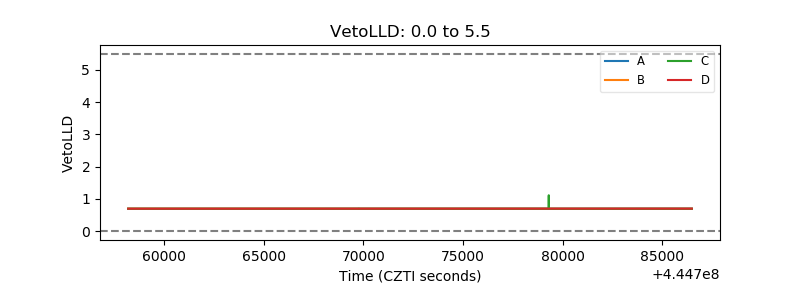 |
| Alpha Counter | 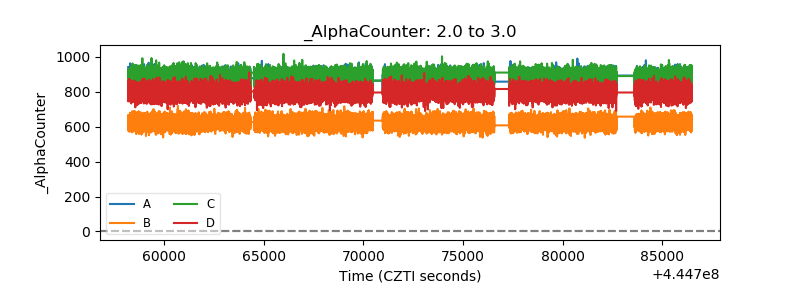 |
| _CPM_Rate | 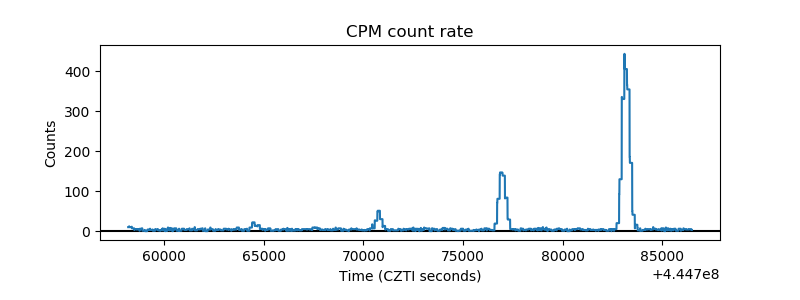 |
| CZT Counter | 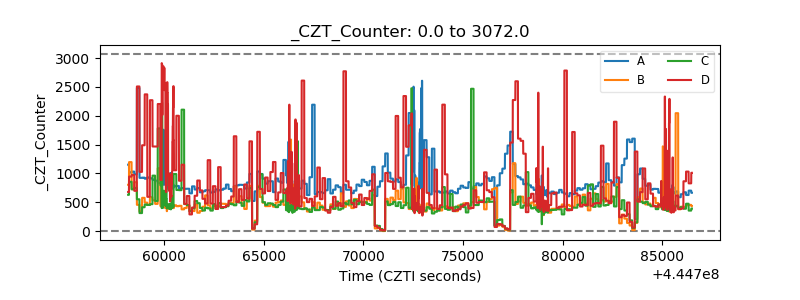 |
| +2.5 Volts monitor | 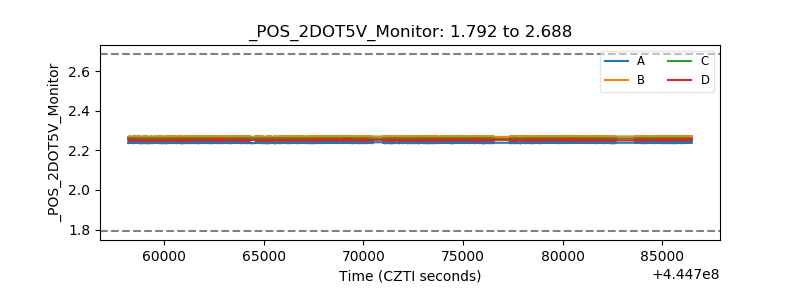 |
| +5 Volts monitor |  |
| _ROLL_ROT | 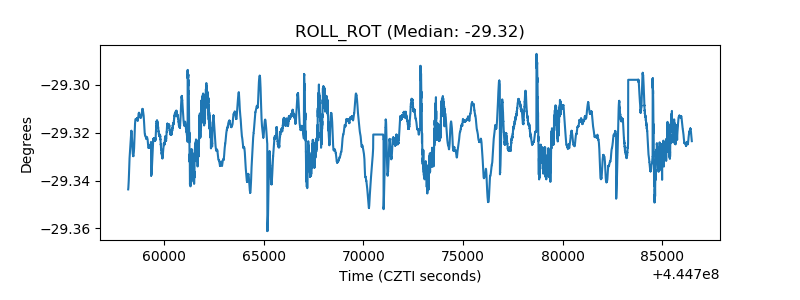 |
| _Roll_DEC | 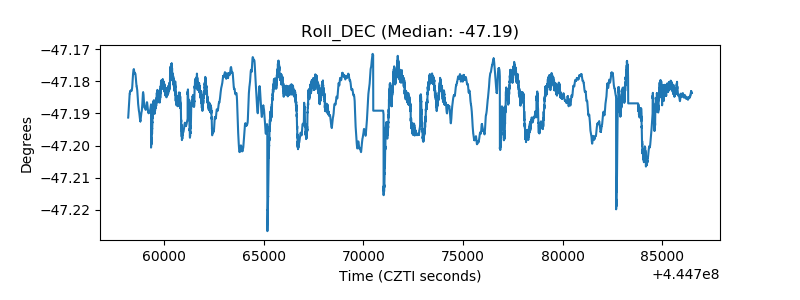 |
| _Roll_RA | 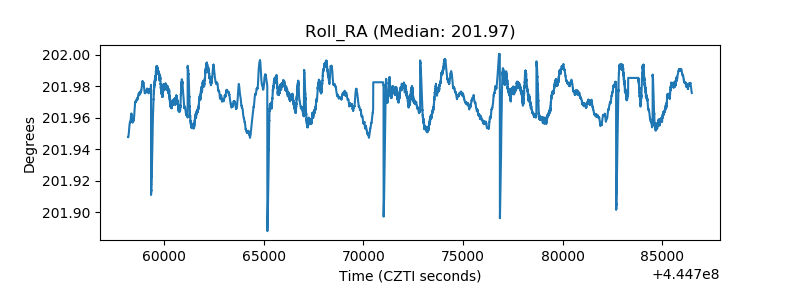 |
| Veto Counter | 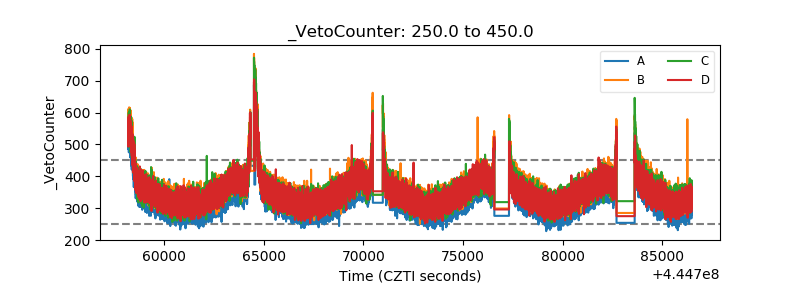 |