| Param | Original file | Final file |
|---|---|---|
| Filename | modeM0/AS1A13_049T05_9000006050_45182cztM0_level2.fits | modeM0/AS1A13_049T05_9000006050_45182cztM0_level2_quad_clean.evt |
| Size (bytes) | 757,019,520 | 161,593,920 |
| Size | 722.0 MB | 154.1 MB |
| Events in quadrant A | 7,884,665 | 1,082,352 |
| Events in quadrant B | 5,230,732 | 1,134,022 |
| Events in quadrant C | 4,878,850 | 1,084,488 |
| Events in quadrant D | 9,269,196 | 912,599 |
| Mode M0 | |||
|---|---|---|---|
| Quadrant | BADHDUFLAG | Total packets | Discarded packets |
| A | 0 | 31104 | 2 |
| B | 0 | 21977 | 2 |
| C | 0 | 20996 | 2 |
| D | 0 | 34368 | 2 |
| Mode M9 | |||
|---|---|---|---|
| Quadrant | BADHDUFLAG | Total packets | Discarded packets |
| A | 0 | 22 | 0 |
| B | 0 | 22 | 0 |
| C | 0 | 22 | 0 |
| D | 0 | 22 | 0 |
| Mode SS | |||
|---|---|---|---|
| Quadrant | BADHDUFLAG | Total packets | Discarded packets |
| A | 0 | 198 | 0 |
| B | 0 | 198 | 0 |
| C | 0 | 198 | 0 |
| D | 0 | 198 | 0 |
| Quadrant | Total seconds | Saturated seconds | Saturation percentage |
|---|---|---|---|
| A | 9806 | 186 | 1.896798% |
| B | 9807 | 107 | 1.091057% |
| C | 9807 | 121 | 1.233813% |
| D | 9807 | 1003 | 10.227389% |
Noise dominated data is calculated using 1-second bins in cleaned event files. If a bin has >2000 counts, and if more than 50% of those come from <1% of pixels, then it is considered to be noise-dominated and hence unusable.
| Quadrant | # 1 sec bins | Bins with >0 counts | Bins with >2000 counts | High rate bins dominated by noise | Noise dominated (total time) | Noise dominated (detector-on time) | Marked lightcurve |
|---|---|---|---|---|---|---|---|
| A | 11971 | 9808 | 37 | 37 | 0.31% | 0.38% | 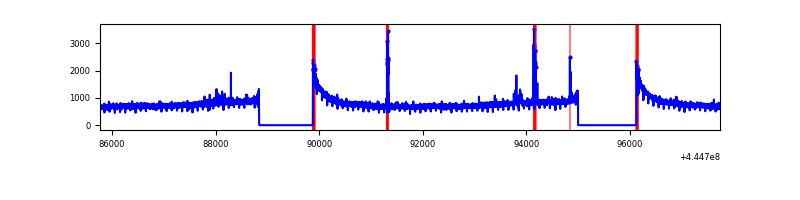 |
| B | 11972 | 9809 | 37 | 37 | 0.31% | 0.38% | 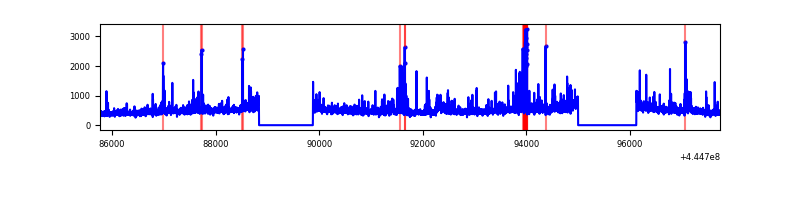 |
| C | 11972 | 9809 | 84 | 84 | 0.70% | 0.86% | 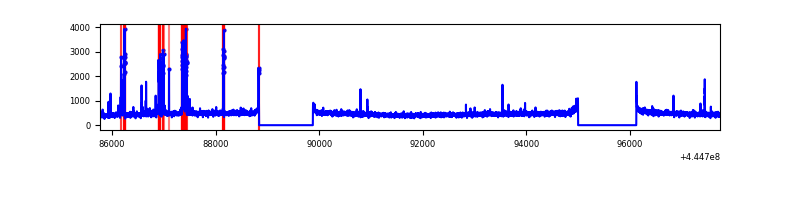 |
| D | 11972 | 9809 | 855 | 855 | 7.14% | 8.72% | 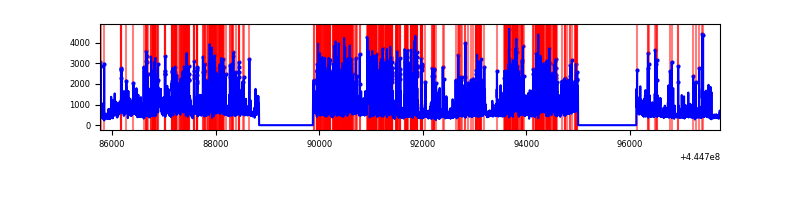 |
Top three noisy pixels from each quadrant. If the there are fewer than three noisy pixels in the level2.evt file, extra rows are filled as -1
| Pixel properties | Quadrant properties | ||||||
|---|---|---|---|---|---|---|---|
| Quadrant | DetID | PixID | Counts | Sigma | Mean | Median | Sigma |
| A | 10 | 83 | 3458293 | 15197.86 | 1106 | 1084 | 227.5 |
| A | 2 | 79 | 63053 | 272.42 | 1106 | 1084 | 227.5 |
| A | 10 | 248 | 31614 | 134.21 | 1106 | 1084 | 227.5 |
| B | 5 | 185 | 283542 | 1298.33 | 1117 | 1081 | 217.6 |
| B | 3 | 112 | 208997 | 955.68 | 1117 | 1081 | 217.6 |
| B | 4 | 170 | 194401 | 888.59 | 1117 | 1081 | 217.6 |
| C | 12 | 250 | 254176 | 972.1 | 1112 | 1116 | 260.3 |
| C | 14 | 220 | 126243 | 480.66 | 1112 | 1116 | 260.3 |
| C | 14 | 254 | 62406 | 235.44 | 1112 | 1116 | 260.3 |
| D | 13 | 249 | 3048929 | 11453.95 | 1061 | 1029 | 266.1 |
| D | 1 | 47 | 935457 | 3511.56 | 1061 | 1029 | 266.1 |
| D | 5 | 222 | 279931 | 1048.11 | 1061 | 1029 | 266.1 |
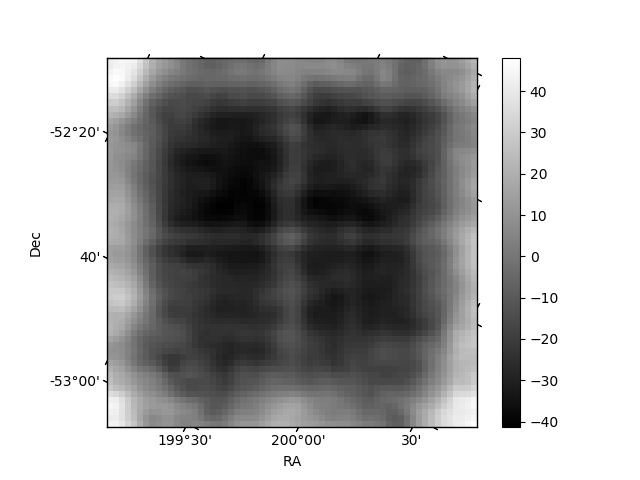
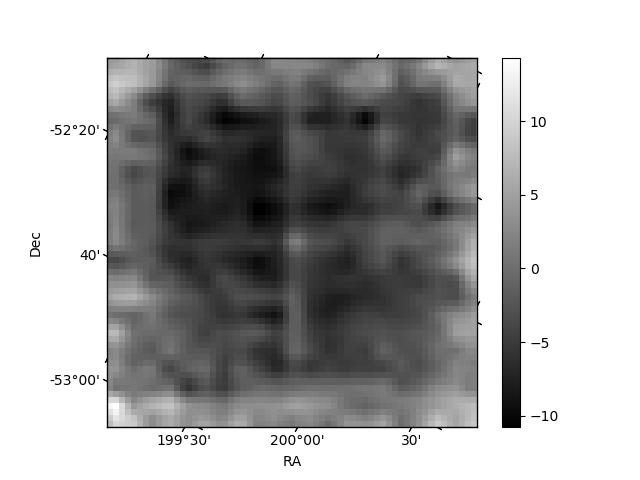
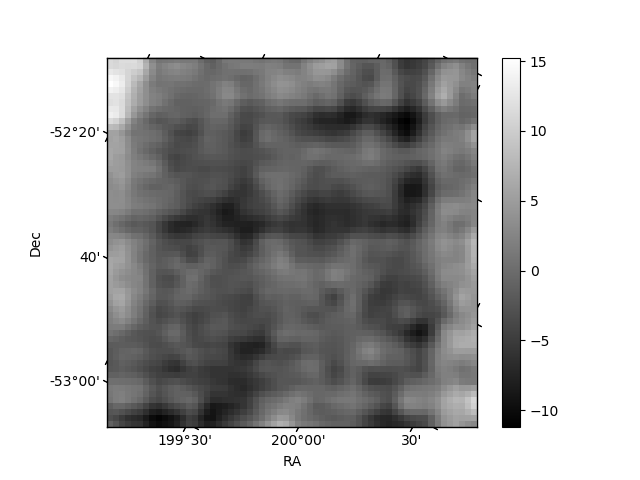
Histogram calculated using DETX and DETY for each event in the final _common_clean file
| Quadrant A | 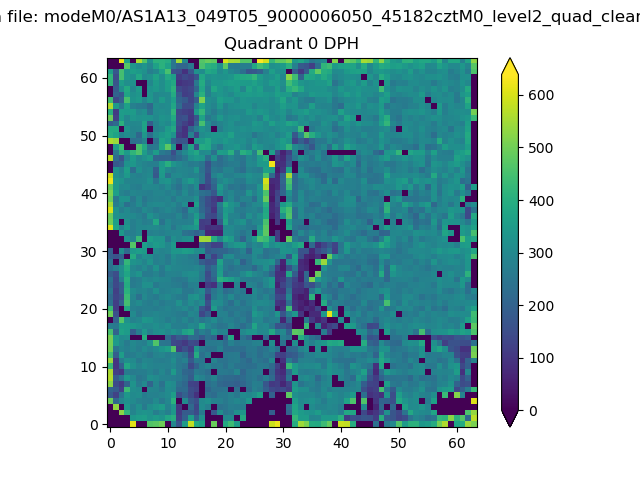 |
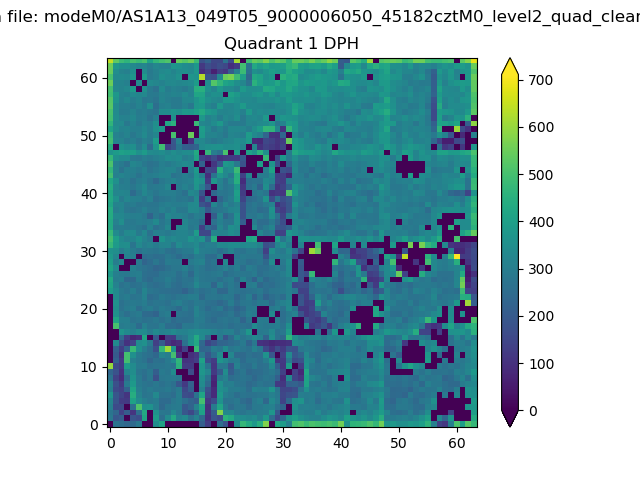 |
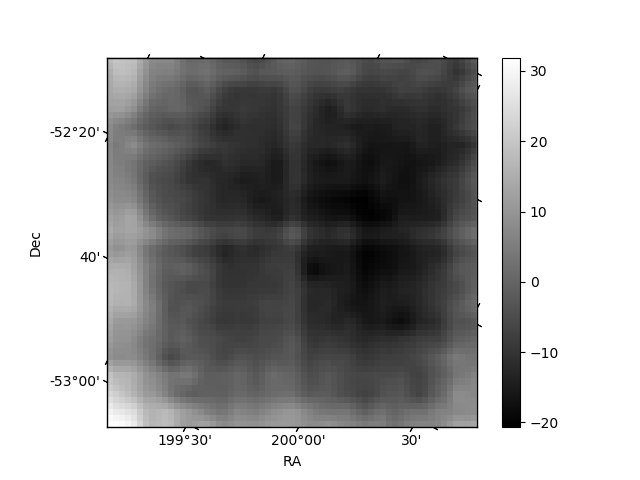
Quadrant B |
|---|---|---|---|
| Quadrant D | 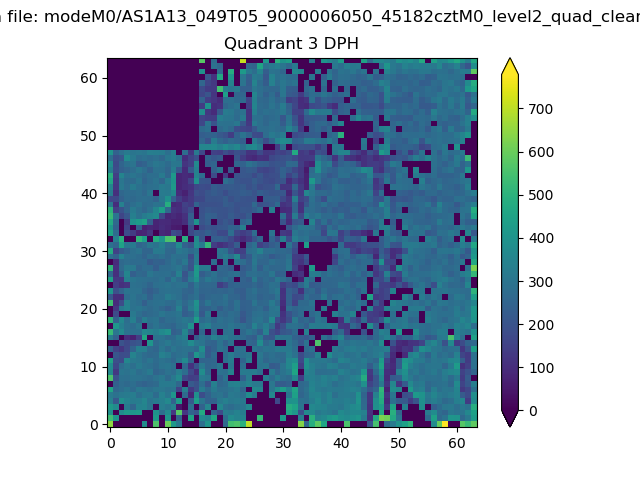 |
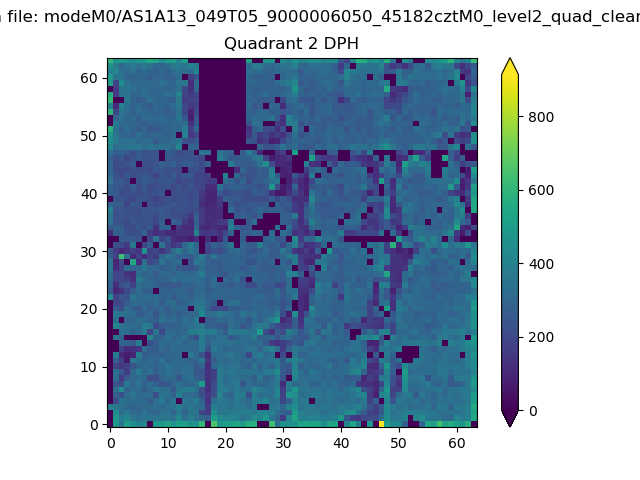 |
Quadrant C |
| Plot type | Count rate plots | Images |
|---|---|---|
| Comparison with Poisson distribution Blue bars denote a histogram of data divided into 1 sec bins. Red curve is a Poisson curve with rate = median count rate of data. |
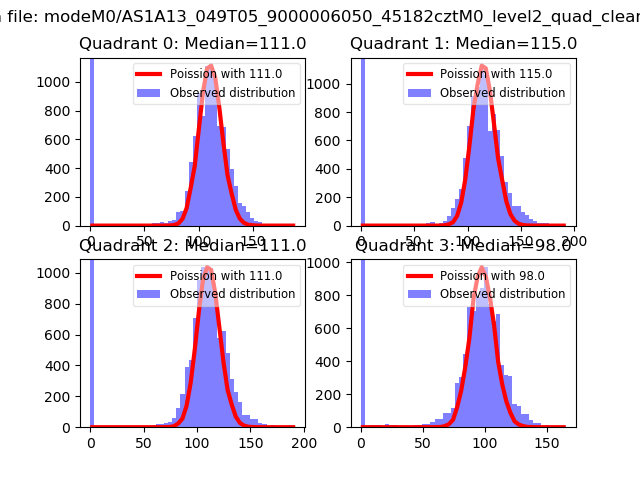 |
 |
| Quadrant-wise count rates Data is divided into 100 sec bins |
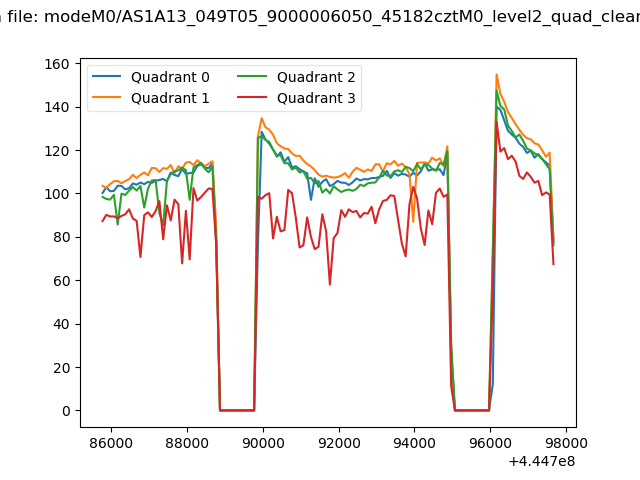 |
|
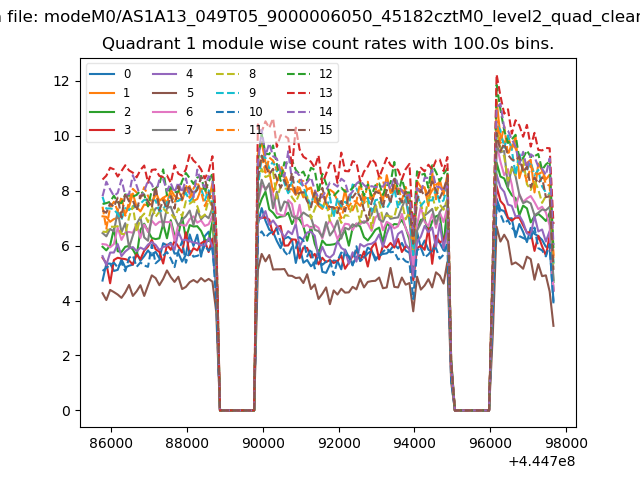
| Module-wise count rates for Quadrant A Data is divided into 100 sec bins |
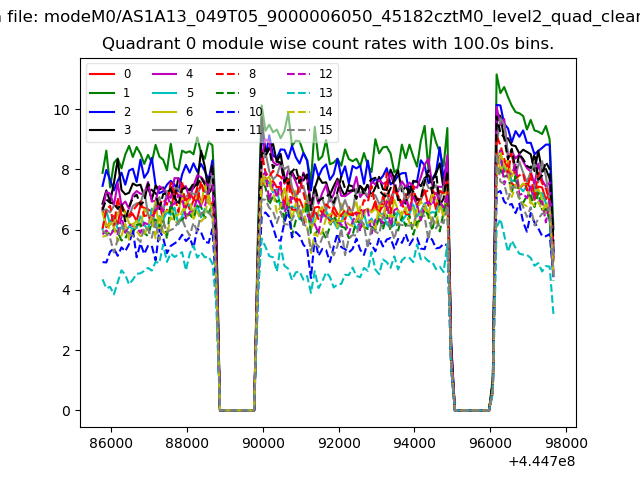 |
 |
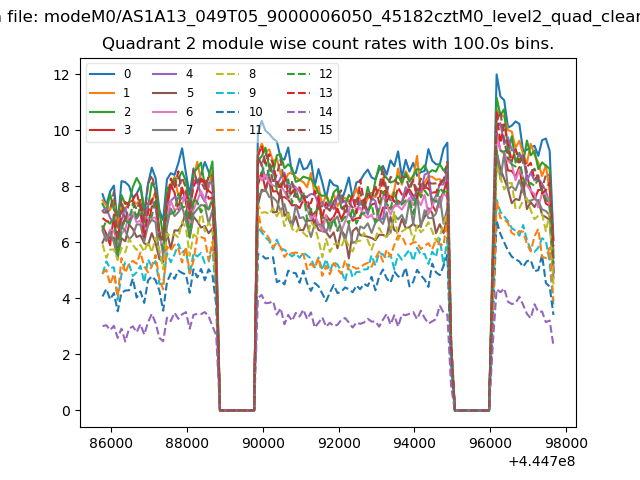
| Module-wise count rates for Quadrant B Data is divided into 100 sec bins |
 |
 |
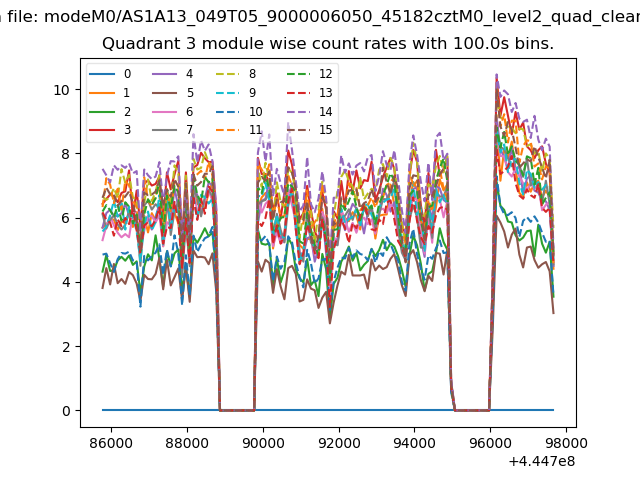
| Module-wise count rates for Quadrant C Data is divided into 100 sec bins |
 |
 |
| Module-wise count rates for Quadrant D Data is divided into 100 sec bins |
 |
 |
| Parameter | Plot |
|---|---|
| CZT HV Monitor | 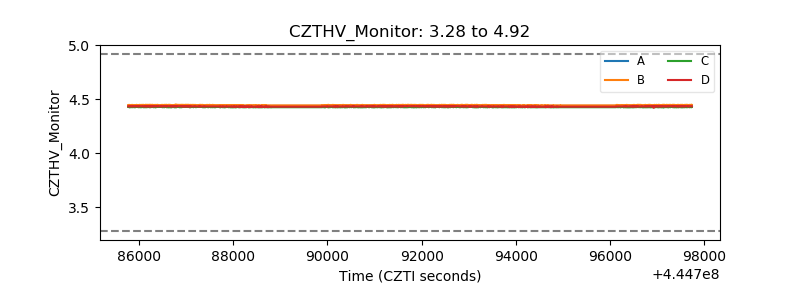 |
| D_VDD | 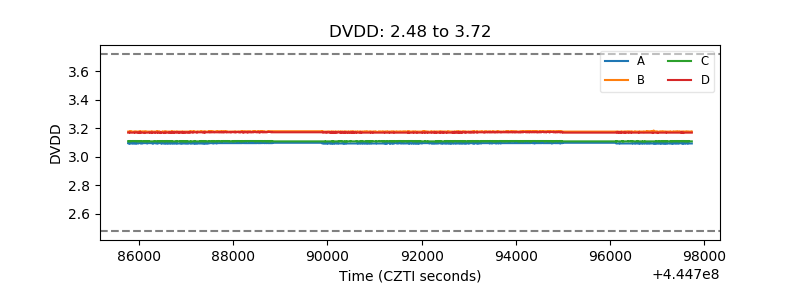 |
| Temperature 1 | 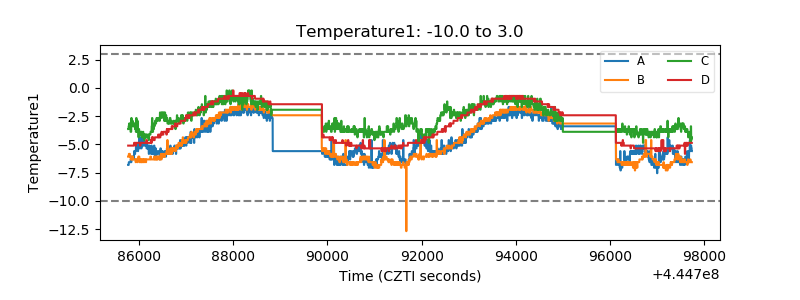 |
| Veto HV Monitor | 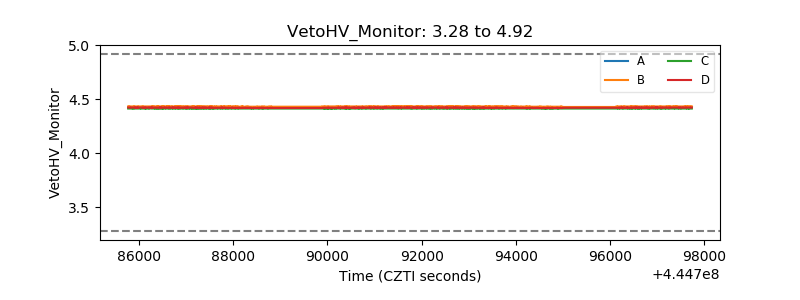 |
| Veto LLD | 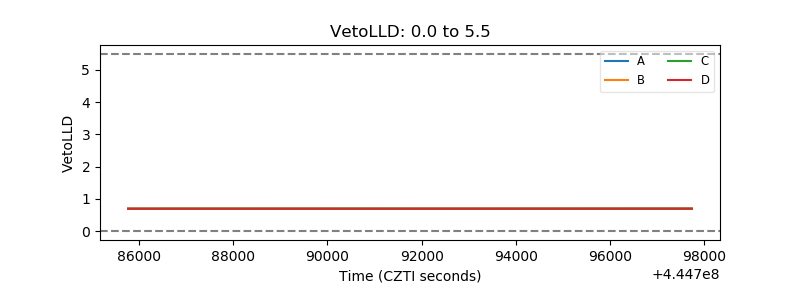 |
| Alpha Counter | 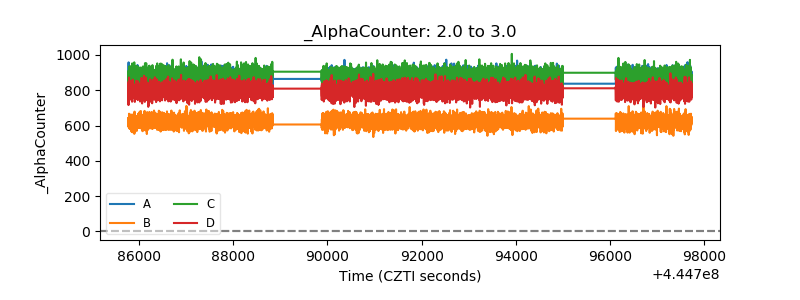 |
| _CPM_Rate | 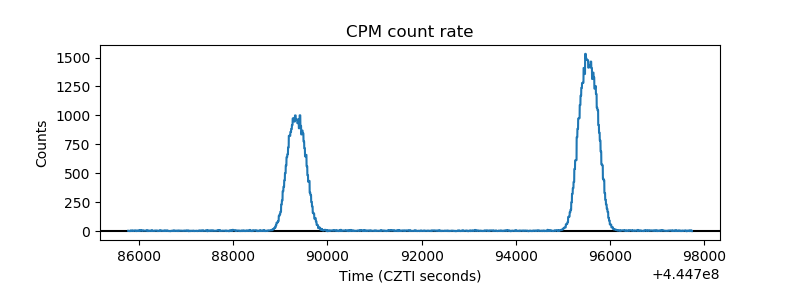 |
| CZT Counter | 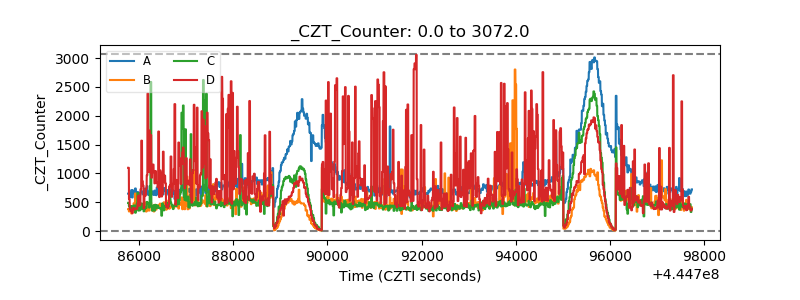 |
| +2.5 Volts monitor | 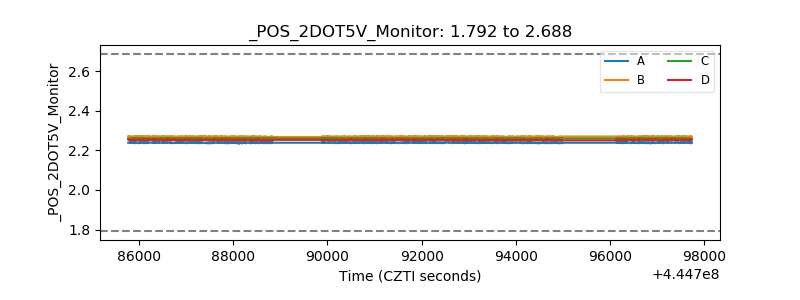 |
| +5 Volts monitor |  |
| _ROLL_ROT | 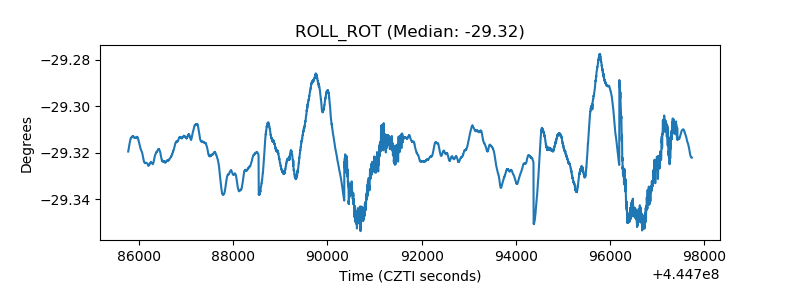 |
| _Roll_DEC | 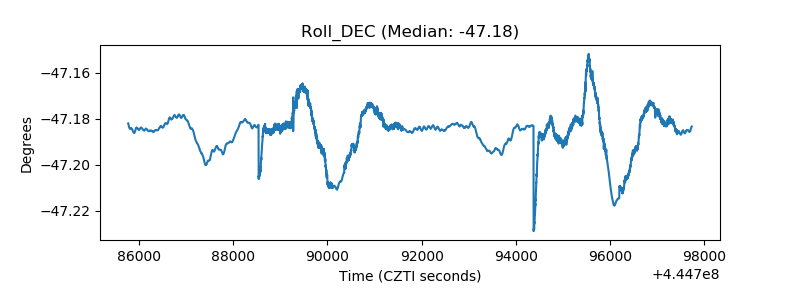 |
| _Roll_RA | 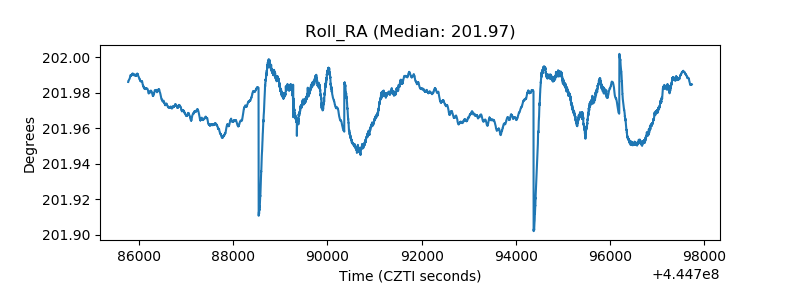 |
| Veto Counter | 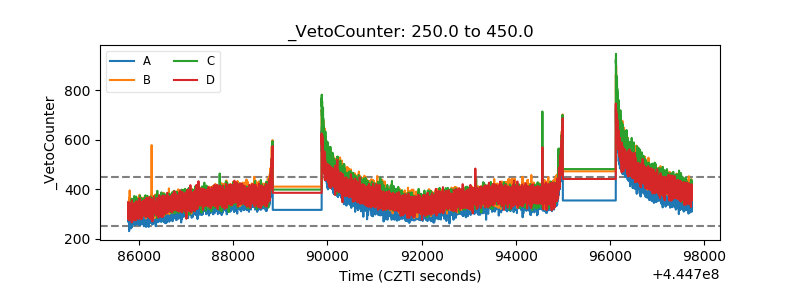 |