| Param | Original file | Final file |
|---|---|---|
| Filename | modeM0/AS1A13_049T05_9000006050_45183cztM0_level2.fits | modeM0/AS1A13_049T05_9000006050_45183cztM0_level2_quad_clean.evt |
| Size (bytes) | 443,128,320 | 97,796,160 |
| Size | 422.6 MB | 93.3 MB |
| Events in quadrant A | 4,599,801 | 660,694 |
| Events in quadrant B | 3,215,878 | 696,685 |
| Events in quadrant C | 2,663,968 | 675,681 |
| Events in quadrant D | 5,478,798 | 528,032 |
| Mode M0 | |||
|---|---|---|---|
| Quadrant | BADHDUFLAG | Total packets | Discarded packets |
| A | 0 | 17917 | 1 |
| B | 0 | 13254 | 1 |
| C | 0 | 11758 | 1 |
| D | 0 | 20221 | 1 |
| Mode M9 | |||
|---|---|---|---|
| Quadrant | BADHDUFLAG | Total packets | Discarded packets |
| A | 0 | 12 | 0 |
| B | 0 | 12 | 0 |
| C | 0 | 12 | 0 |
| D | 0 | 12 | 0 |
| Mode SS | |||
|---|---|---|---|
| Quadrant | BADHDUFLAG | Total packets | Discarded packets |
| A | 0 | 116 | 0 |
| B | 0 | 116 | 0 |
| C | 0 | 116 | 0 |
| D | 0 | 116 | 0 |
| Quadrant | Total seconds | Saturated seconds | Saturation percentage |
|---|---|---|---|
| A | 5724 | 80 | 1.397624% |
| B | 5725 | 68 | 1.187773% |
| C | 5725 | 13 | 0.227074% |
| D | 5725 | 921 | 16.087336% |
Noise dominated data is calculated using 1-second bins in cleaned event files. If a bin has >2000 counts, and if more than 50% of those come from <1% of pixels, then it is considered to be noise-dominated and hence unusable.
| Quadrant | # 1 sec bins | Bins with >0 counts | Bins with >2000 counts | High rate bins dominated by noise | Noise dominated (total time) | Noise dominated (detector-on time) | Marked lightcurve |
|---|---|---|---|---|---|---|---|
| A | 6929 | 5725 | 4 | 4 | 0.06% | 0.07% | 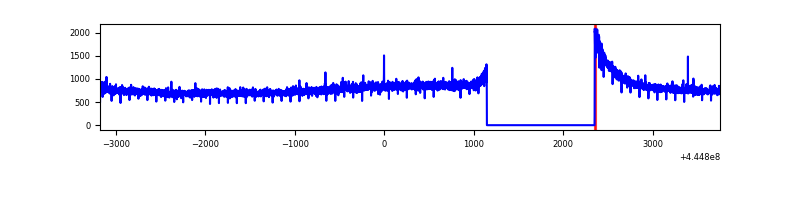 |
| B | 6930 | 5726 | 15 | 15 | 0.22% | 0.26% | 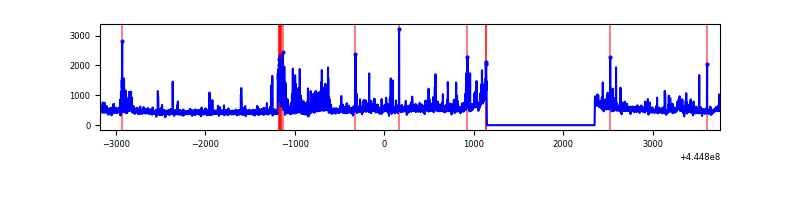 |
| C | 6930 | 5726 | 2 | 2 | 0.03% | 0.03% | 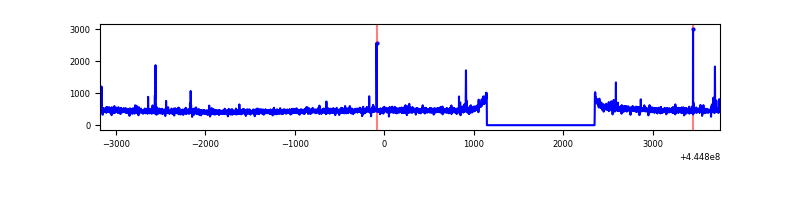 |
| D | 6930 | 5725 | 748 | 748 | 10.79% | 13.07% | 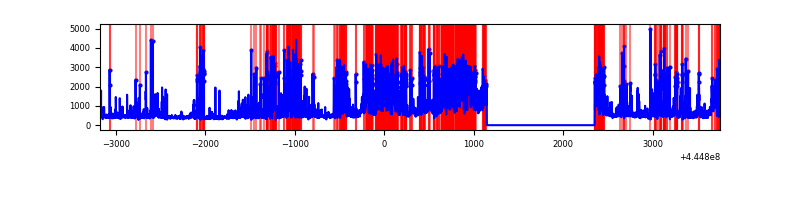 |
Top three noisy pixels from each quadrant. If the there are fewer than three noisy pixels in the level2.evt file, extra rows are filled as -1
| Pixel properties | Quadrant properties | ||||||
|---|---|---|---|---|---|---|---|
| Quadrant | DetID | PixID | Counts | Sigma | Mean | Median | Sigma |
| A | 10 | 83 | 2033589 | 14887.25 | 660 | 646 | 136.6 |
| A | 0 | 243 | 12380 | 85.93 | 660 | 646 | 136.6 |
| A | 3 | 137 | 7191 | 47.93 | 660 | 646 | 136.6 |
| B | 5 | 185 | 224796 | 1726.59 | 665 | 644 | 129.8 |
| B | 3 | 112 | 173156 | 1328.82 | 665 | 644 | 129.8 |
| B | 4 | 170 | 75903 | 579.7 | 665 | 644 | 129.8 |
| C | 1 | 3 | 22641 | 140.17 | 668 | 674 | 156.7 |
| C | 14 | 254 | 13636 | 82.71 | 668 | 674 | 156.7 |
| C | 3 | 233 | 10454 | 62.41 | 668 | 674 | 156.7 |
| D | 13 | 249 | 1530823 | 10053.24 | 611 | 594 | 152.2 |
| D | 5 | 235 | 1002220 | 6580.45 | 611 | 594 | 152.2 |
| D | 1 | 47 | 222068 | 1455.03 | 611 | 594 | 152.2 |
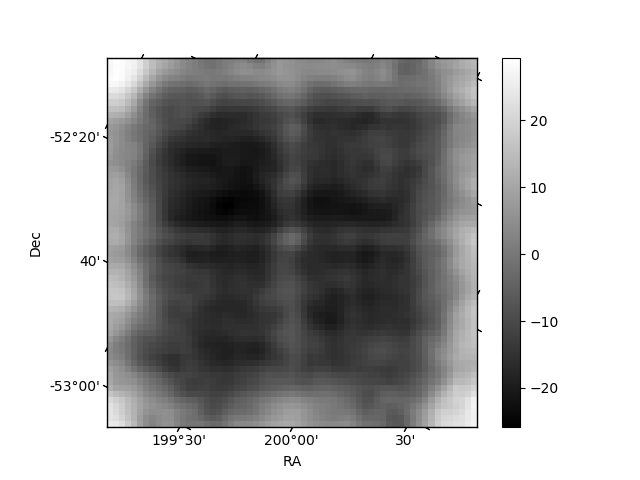
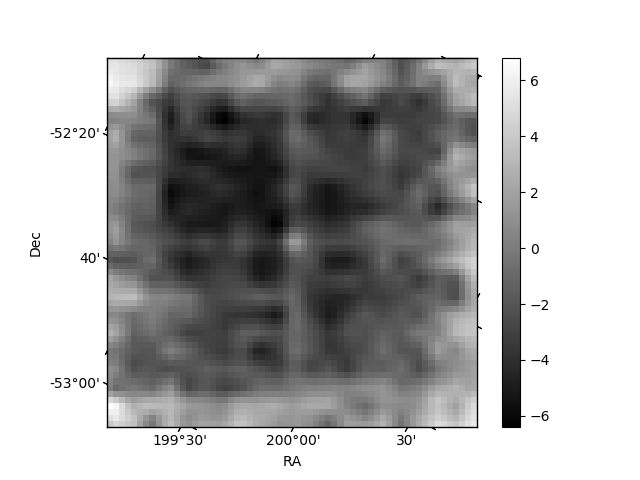
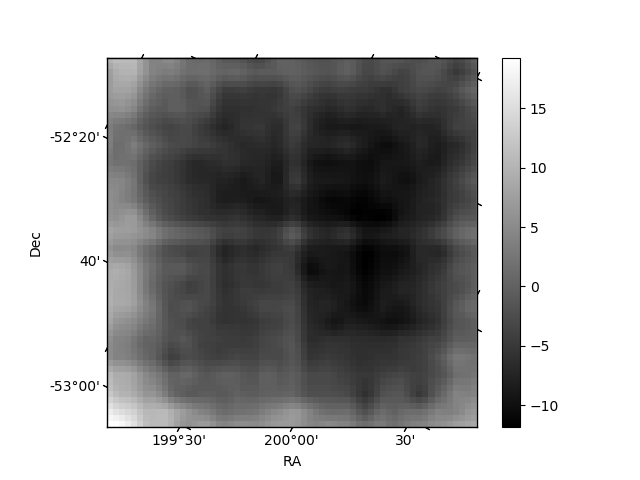
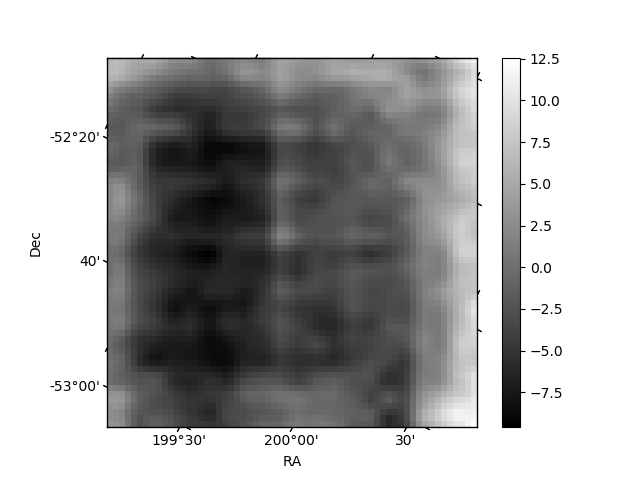
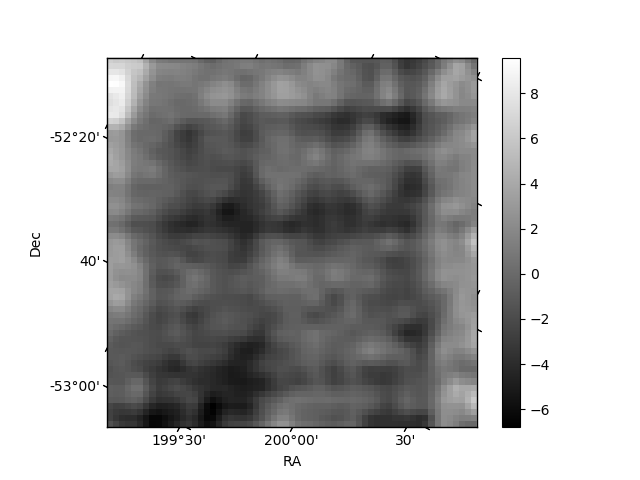
Histogram calculated using DETX and DETY for each event in the final _common_clean file
| Quadrant A | 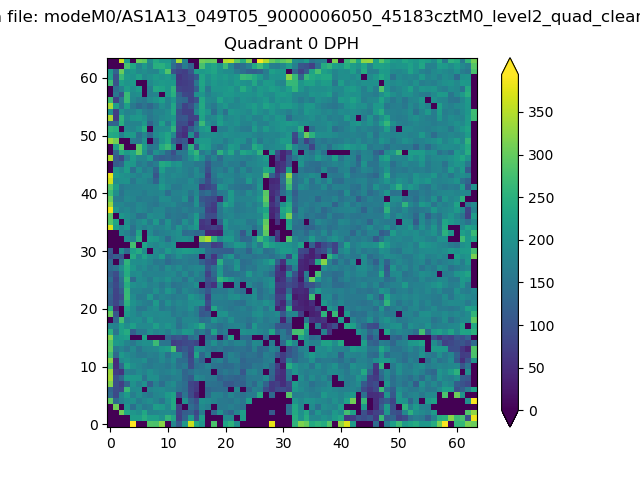 |
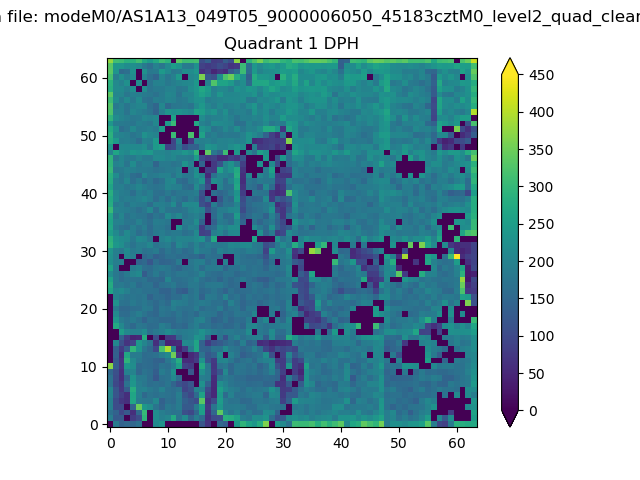 |
Quadrant B |
|---|---|---|---|
| Quadrant D | 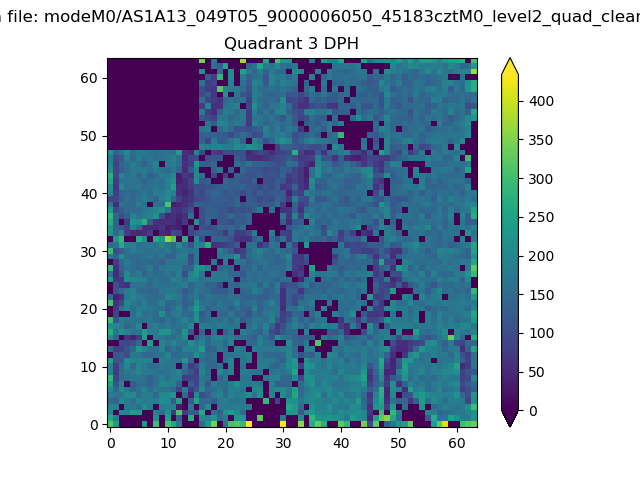 |
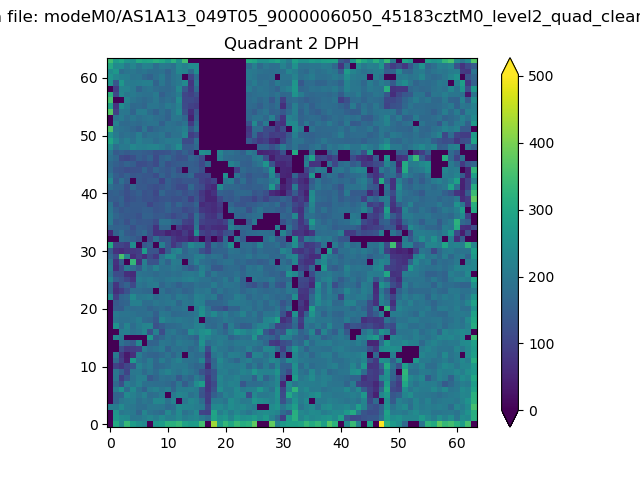 |
Quadrant C |
| Plot type | Count rate plots | Images |
|---|---|---|
| Comparison with Poisson distribution Blue bars denote a histogram of data divided into 1 sec bins. Red curve is a Poisson curve with rate = median count rate of data. |
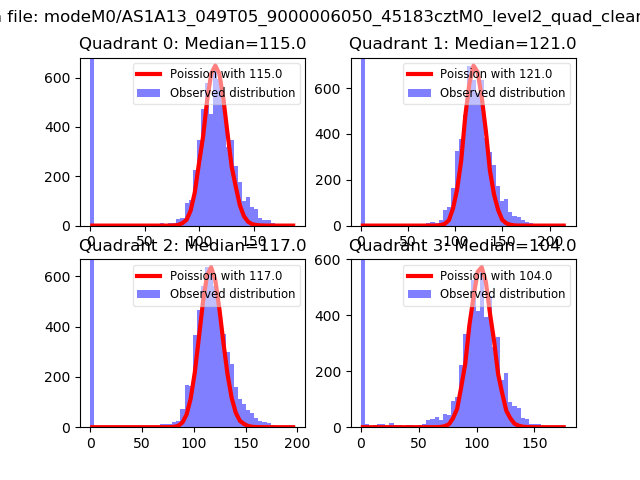 |
 |
| Quadrant-wise count rates Data is divided into 100 sec bins |
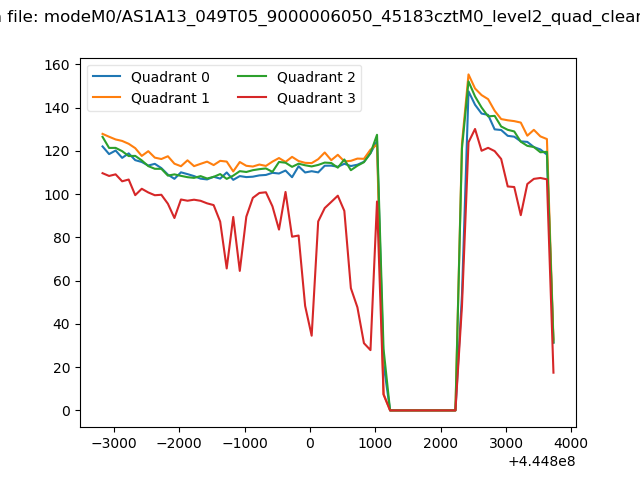 |
|
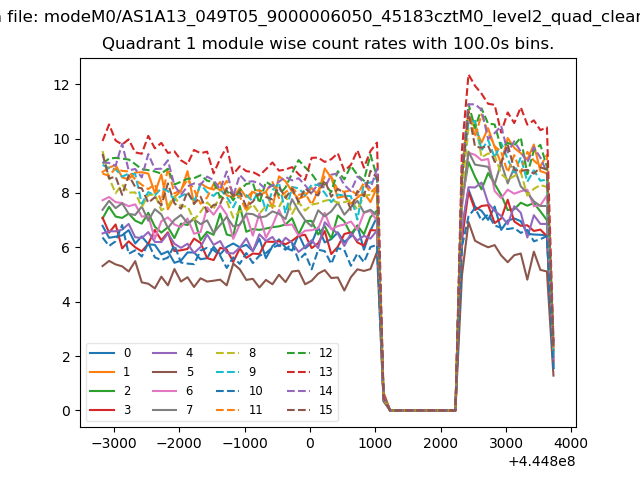
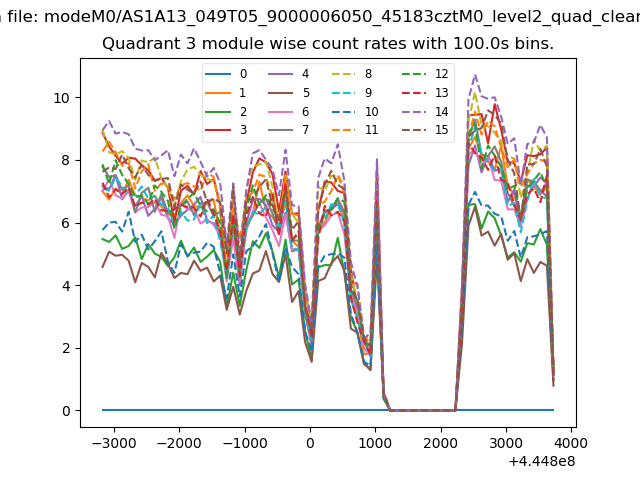
| Module-wise count rates for Quadrant A Data is divided into 100 sec bins |
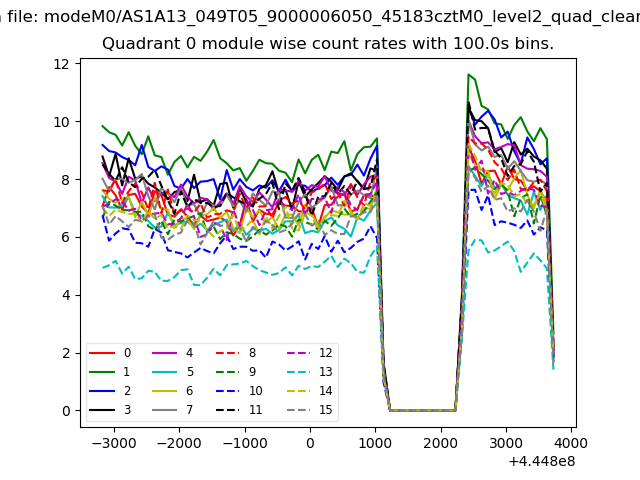 |
 |
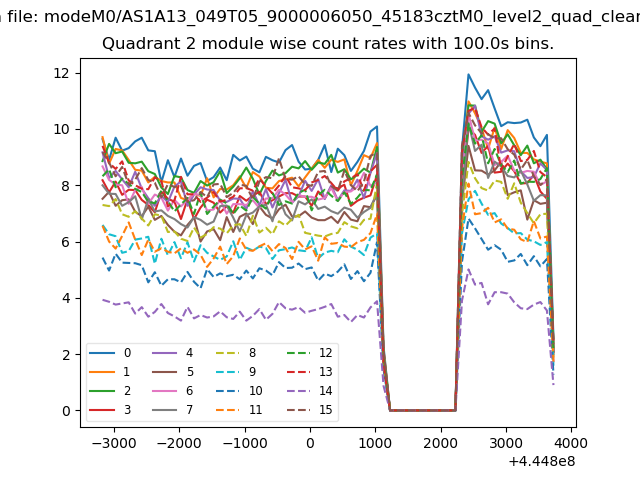
| Module-wise count rates for Quadrant B Data is divided into 100 sec bins |
 |
 |
| Module-wise count rates for Quadrant C Data is divided into 100 sec bins |
 |
 |
| Module-wise count rates for Quadrant D Data is divided into 100 sec bins |
 |
 |
| Parameter | Plot |
|---|---|
| CZT HV Monitor | 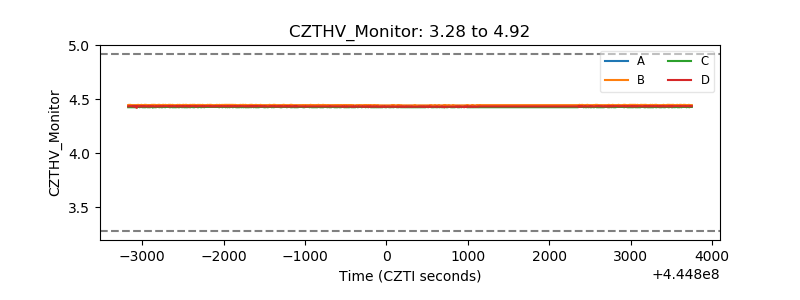 |
| D_VDD | 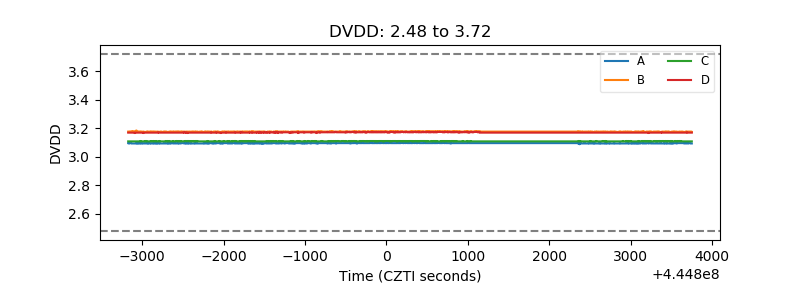 |
| Temperature 1 | 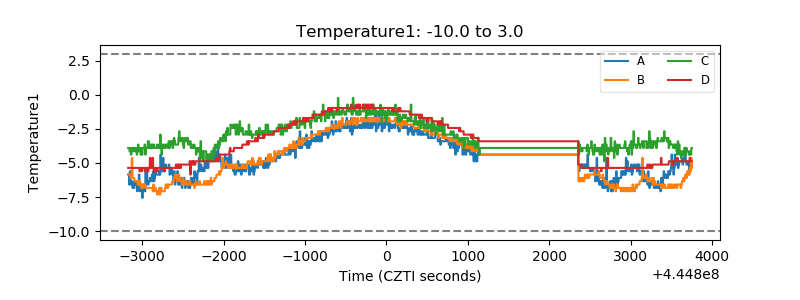 |
| Veto HV Monitor | 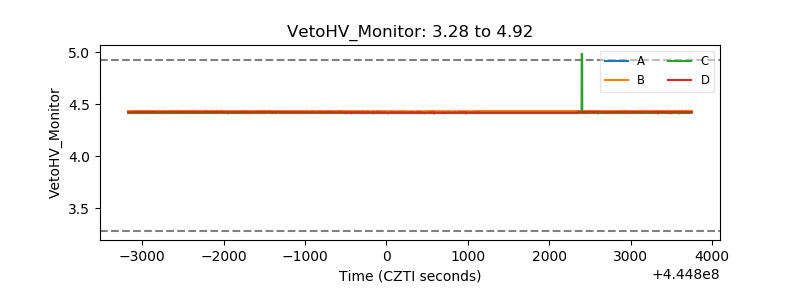 |
| Veto LLD | 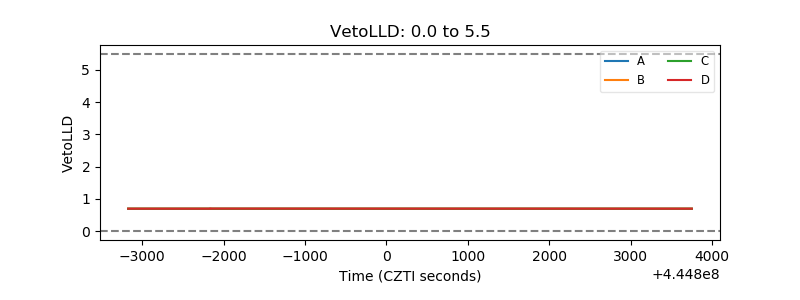 |
| Alpha Counter | 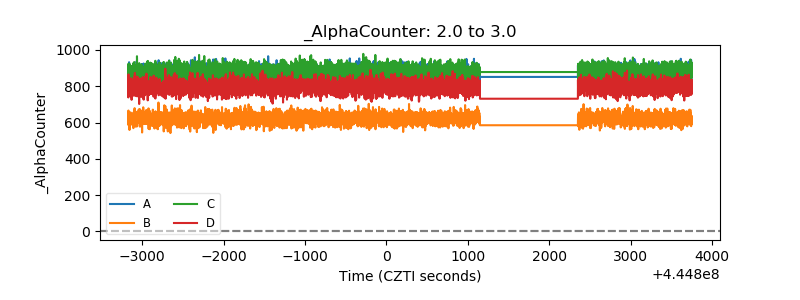 |
| _CPM_Rate | 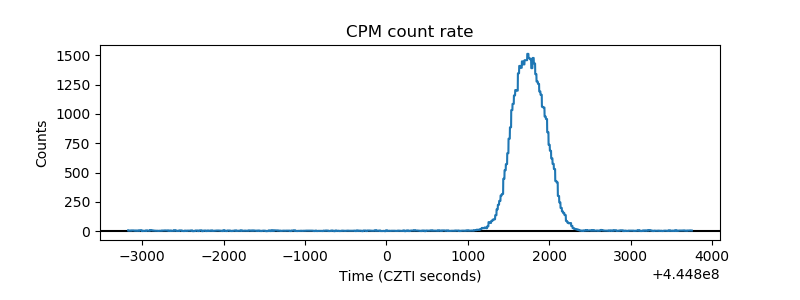 |
| CZT Counter | 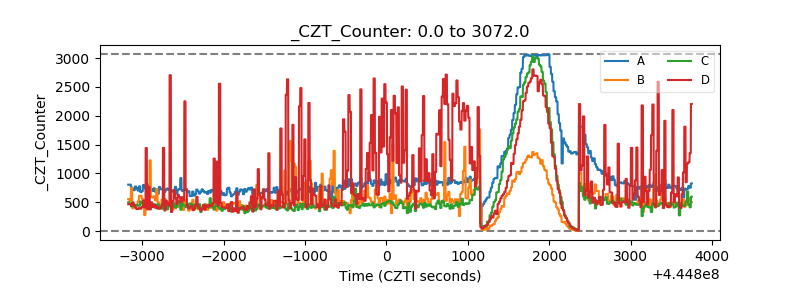 |
| +2.5 Volts monitor | 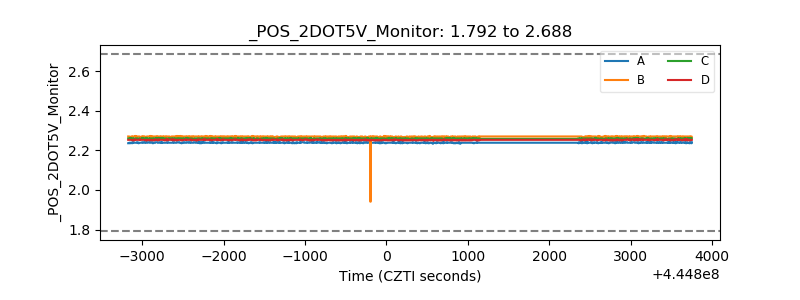 |
| +5 Volts monitor | 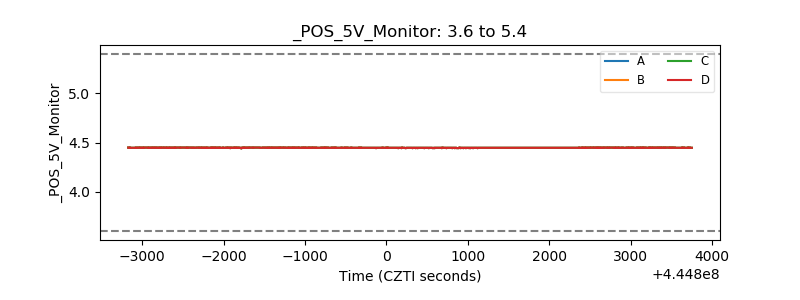 |
| _ROLL_ROT | 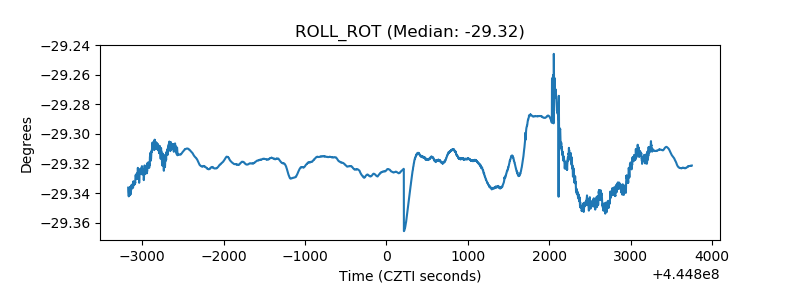 |
| _Roll_DEC | 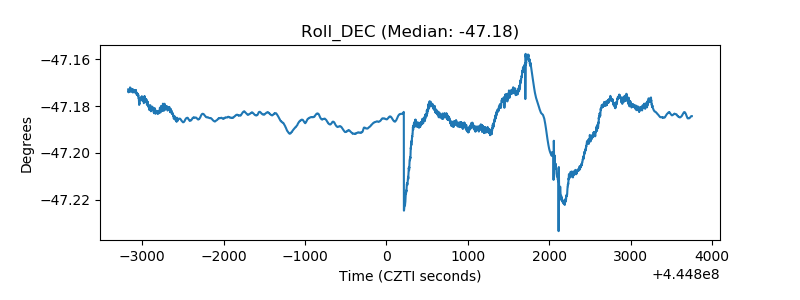 |
| _Roll_RA | 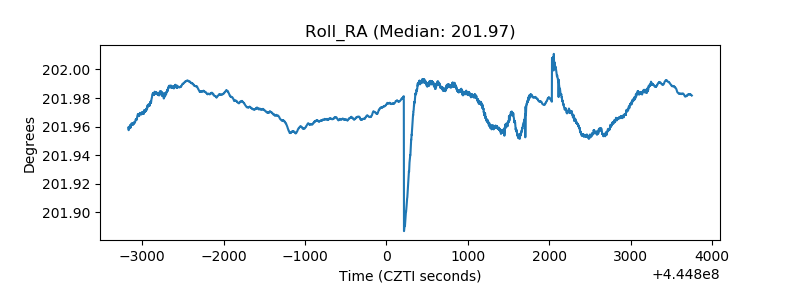 |
| Veto Counter | 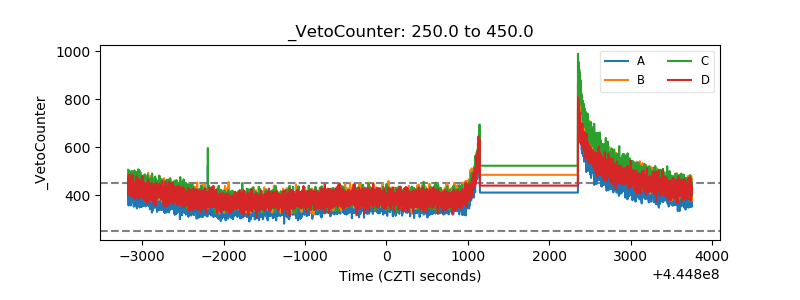 |