| Param | Original file | Final file |
|---|---|---|
| Filename | modeM0/AS1A13_049T05_9000006050_45184cztM0_level2.fits | modeM0/AS1A13_049T05_9000006050_45184cztM0_level2_quad_clean.evt |
| Size (bytes) | 518,561,280 | 112,017,600 |
| Size | 494.5 MB | 106.8 MB |
| Events in quadrant A | 5,428,134 | 758,239 |
| Events in quadrant B | 3,473,865 | 801,301 |
| Events in quadrant C | 3,067,597 | 781,617 |
| Events in quadrant D | 6,729,415 | 604,323 |
| Mode M0 | |||
|---|---|---|---|
| Quadrant | BADHDUFLAG | Total packets | Discarded packets |
| A | 0 | 20620 | 2 |
| B | 0 | 14286 | 2 |
| C | 0 | 13269 | 2 |
| D | 0 | 24367 | 2 |
| Mode M9 | |||
|---|---|---|---|
| Quadrant | BADHDUFLAG | Total packets | Discarded packets |
| A | 0 | 14 | 0 |
| B | 0 | 15 | 0 |
| C | 0 | 15 | 0 |
| D | 0 | 15 | 0 |
| Mode SS | |||
|---|---|---|---|
| Quadrant | BADHDUFLAG | Total packets | Discarded packets |
| A | 0 | 130 | 0 |
| B | 0 | 130 | 0 |
| C | 0 | 130 | 0 |
| D | 0 | 130 | 0 |
| Quadrant | Total seconds | Saturated seconds | Saturation percentage |
|---|---|---|---|
| A | 6400 | 148 | 2.312500% |
| B | 6400 | 66 | 1.031250% |
| C | 6400 | 16 | 0.250000% |
| D | 6400 | 1071 | 16.734375% |
Noise dominated data is calculated using 1-second bins in cleaned event files. If a bin has >2000 counts, and if more than 50% of those come from <1% of pixels, then it is considered to be noise-dominated and hence unusable.
| Quadrant | # 1 sec bins | Bins with >0 counts | Bins with >2000 counts | High rate bins dominated by noise | Noise dominated (total time) | Noise dominated (detector-on time) | Marked lightcurve |
|---|---|---|---|---|---|---|---|
| A | 7625 | 6401 | 6 | 6 | 0.08% | 0.09% | 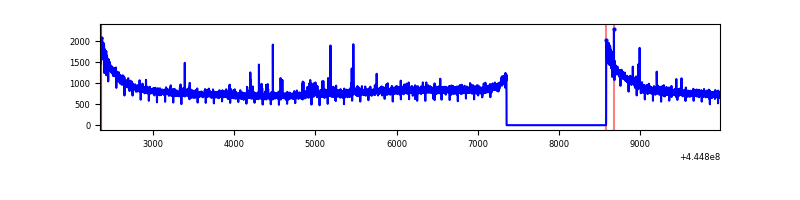 |
| B | 7625 | 6401 | 11 | 11 | 0.14% | 0.17% | 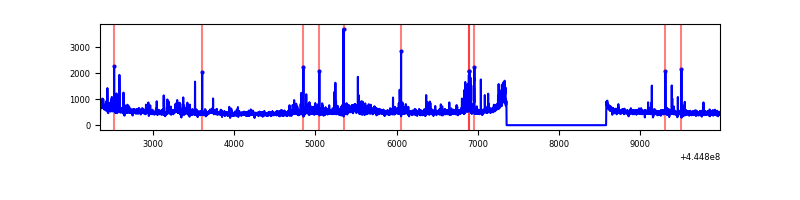 |
| C | 7625 | 6401 | 1 | 1 | 0.01% | 0.02% | 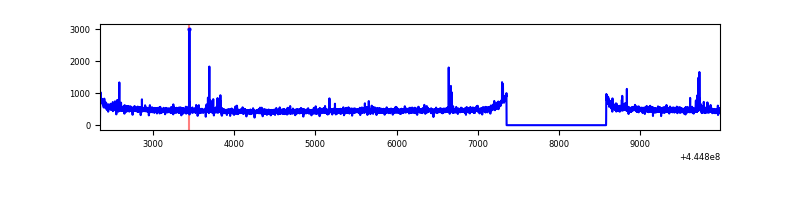 |
| D | 7625 | 6400 | 923 | 923 | 12.10% | 14.42% | 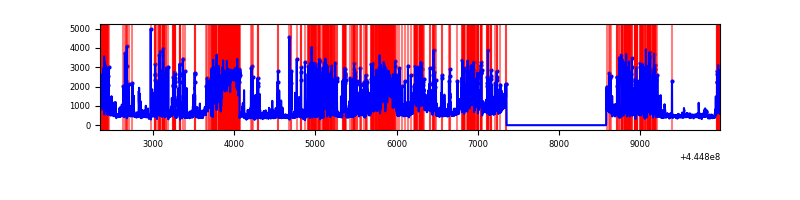 |
Top three noisy pixels from each quadrant. If the there are fewer than three noisy pixels in the level2.evt file, extra rows are filled as -1
| Pixel properties | Quadrant properties | ||||||
|---|---|---|---|---|---|---|---|
| Quadrant | DetID | PixID | Counts | Sigma | Mean | Median | Sigma |
| A | 10 | 83 | 2441120 | 15743.06 | 756 | 740 | 155.0 |
| A | 7 | 3 | 45812 | 290.76 | 756 | 740 | 155.0 |
| A | 0 | 243 | 10497 | 62.94 | 756 | 740 | 155.0 |
| B | 4 | 170 | 114069 | 775.13 | 762 | 739 | 146.2 |
| B | 0 | 183 | 78206 | 529.84 | 762 | 739 | 146.2 |
| B | 3 | 112 | 78049 | 528.76 | 762 | 739 | 146.2 |
| C | 14 | 254 | 43477 | 237.5 | 769 | 775 | 179.8 |
| C | 1 | 3 | 18350 | 97.75 | 769 | 775 | 179.8 |
| C | 3 | 233 | 12153 | 63.28 | 769 | 775 | 179.8 |
| D | 13 | 249 | 2464860 | 13932.02 | 713 | 693 | 176.9 |
| D | 5 | 235 | 422256 | 2383.45 | 713 | 693 | 176.9 |
| D | 5 | 171 | 350810 | 1979.51 | 713 | 693 | 176.9 |
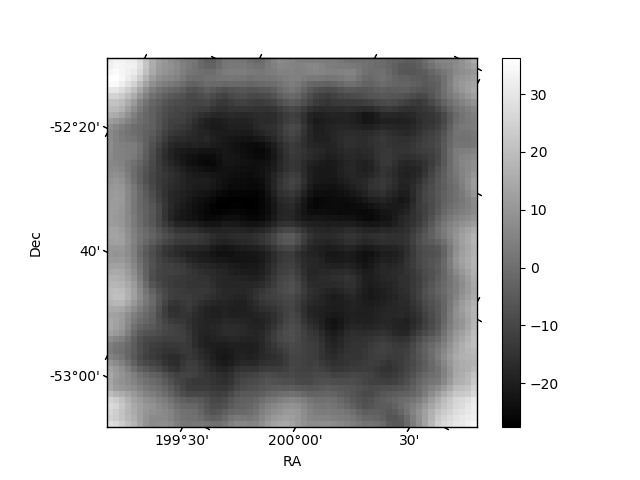
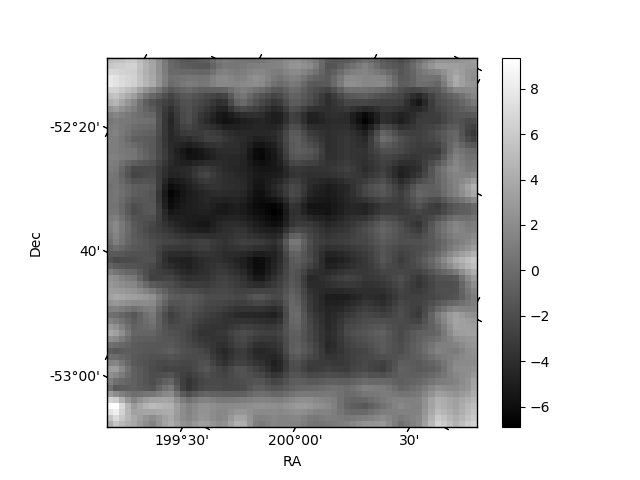
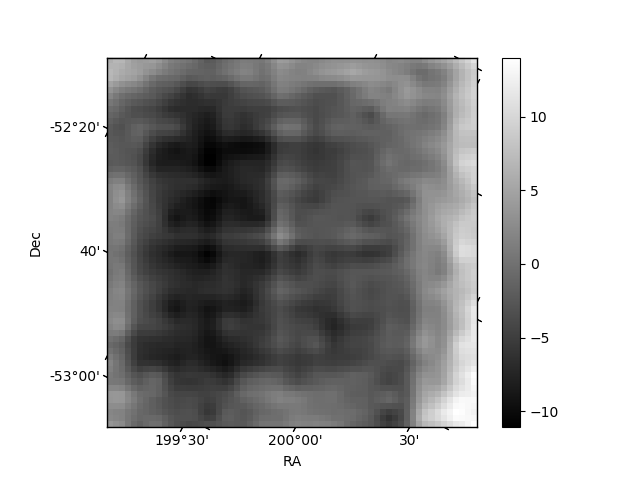
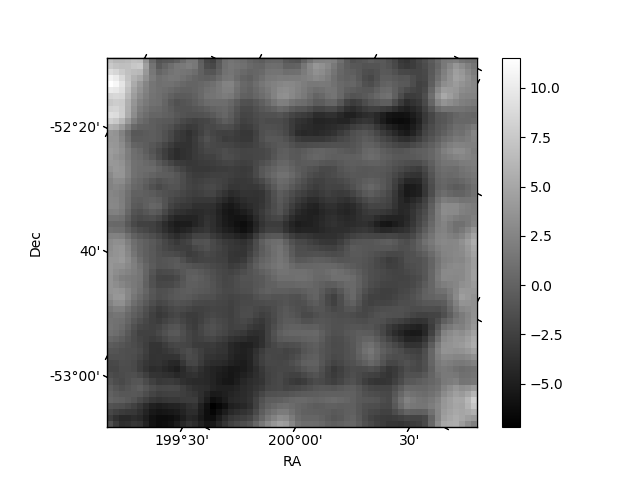
Histogram calculated using DETX and DETY for each event in the final _common_clean file
| Quadrant A | 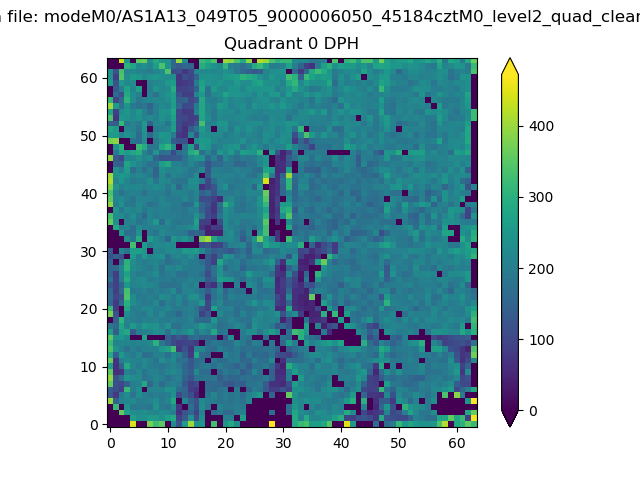 |
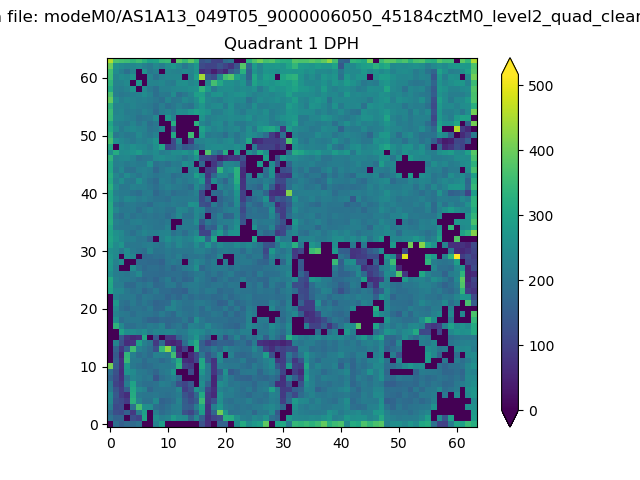 |
Quadrant B |
|---|---|---|---|
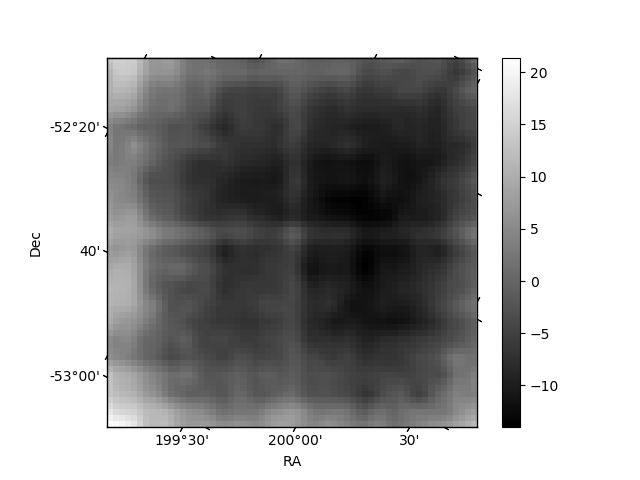
| Quadrant D | 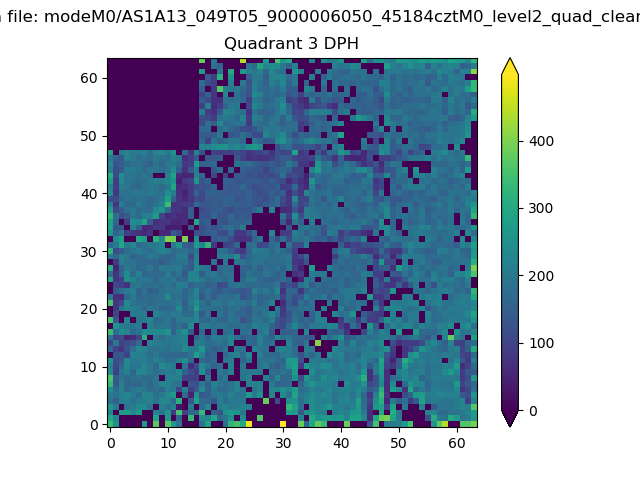 |
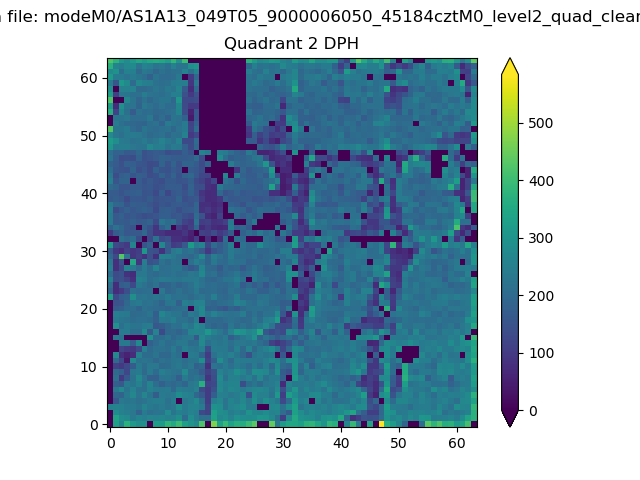 |
Quadrant C |
| Plot type | Count rate plots | Images |
|---|---|---|
| Comparison with Poisson distribution Blue bars denote a histogram of data divided into 1 sec bins. Red curve is a Poisson curve with rate = median count rate of data. |
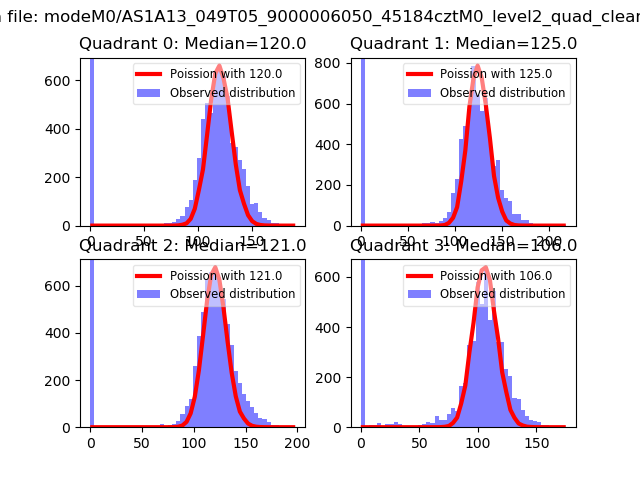 |
 |
| Quadrant-wise count rates Data is divided into 100 sec bins |
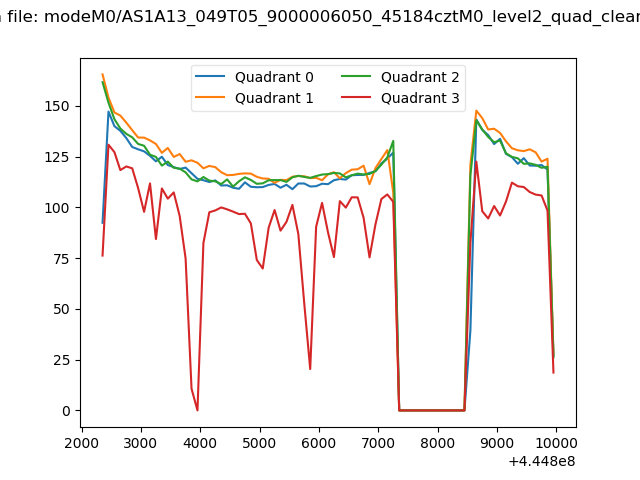 |
|
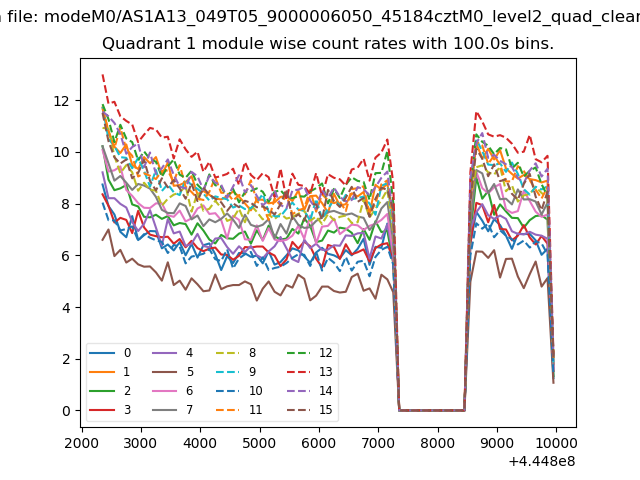
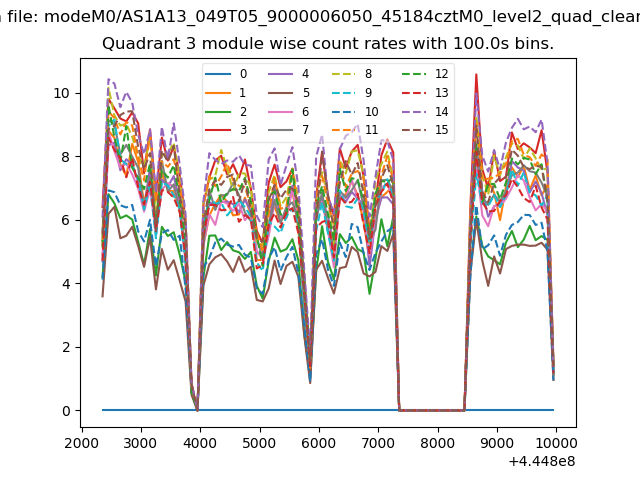
| Module-wise count rates for Quadrant A Data is divided into 100 sec bins |
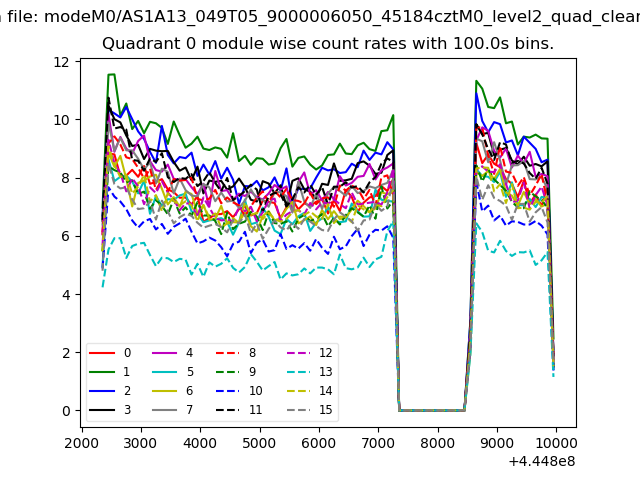 |
 |
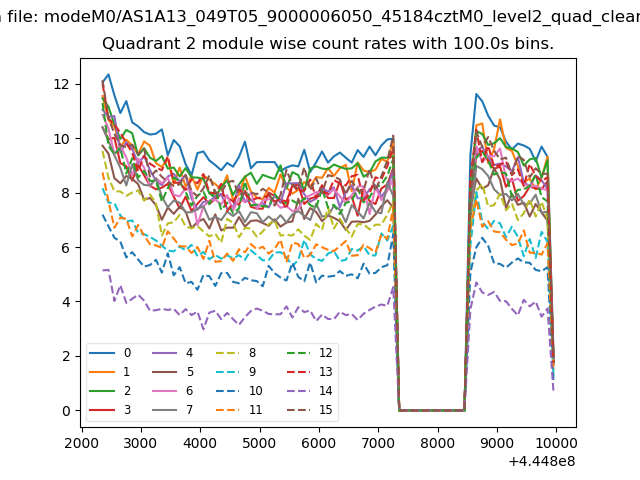
| Module-wise count rates for Quadrant B Data is divided into 100 sec bins |
 |
 |
| Module-wise count rates for Quadrant C Data is divided into 100 sec bins |
 |
 |
| Module-wise count rates for Quadrant D Data is divided into 100 sec bins |
 |
 |
| Parameter | Plot |
|---|---|
| CZT HV Monitor | 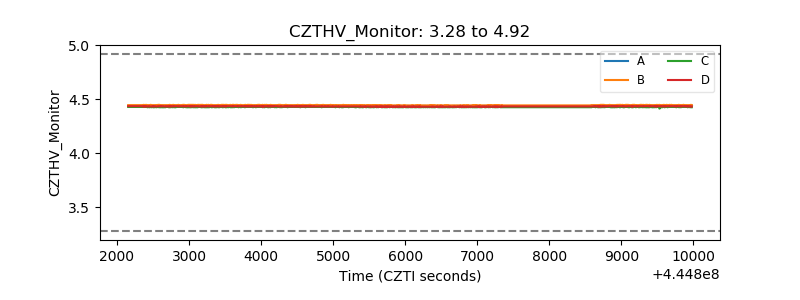 |
| D_VDD | 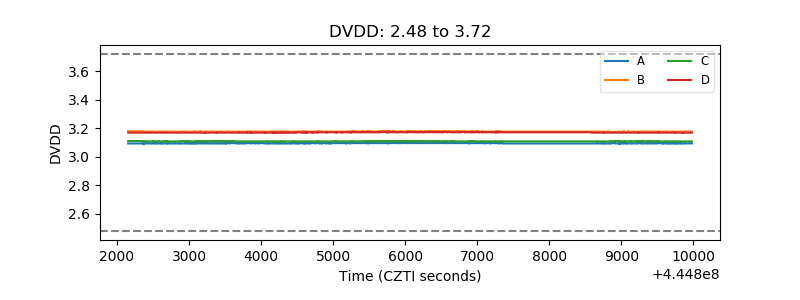 |
| Temperature 1 | 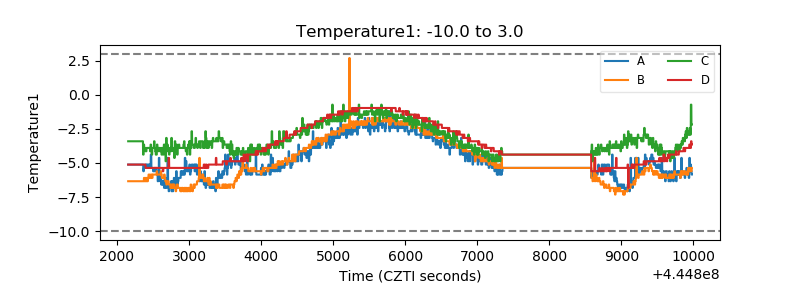 |
| Veto HV Monitor | 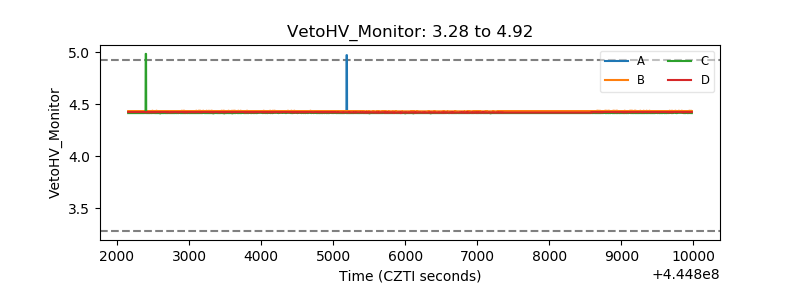 |
| Veto LLD |  |
| Alpha Counter | 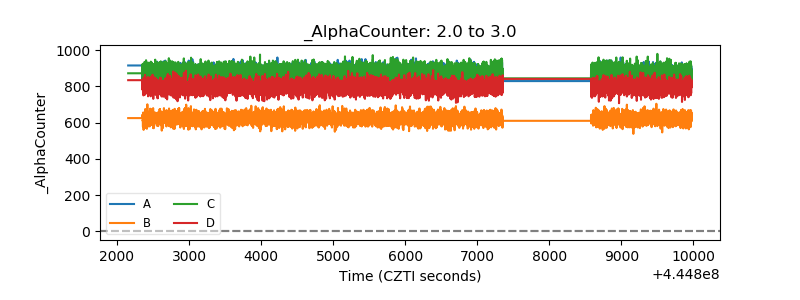 |
| _CPM_Rate | 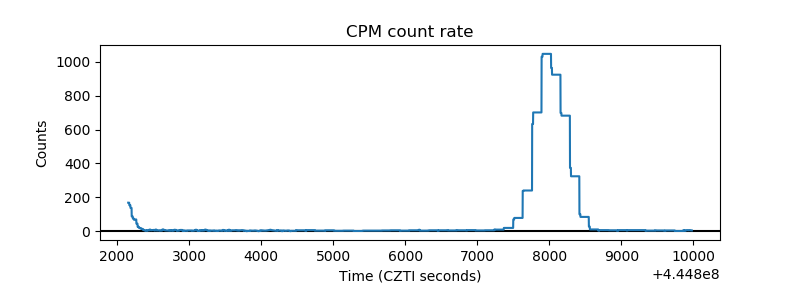 |
| CZT Counter | 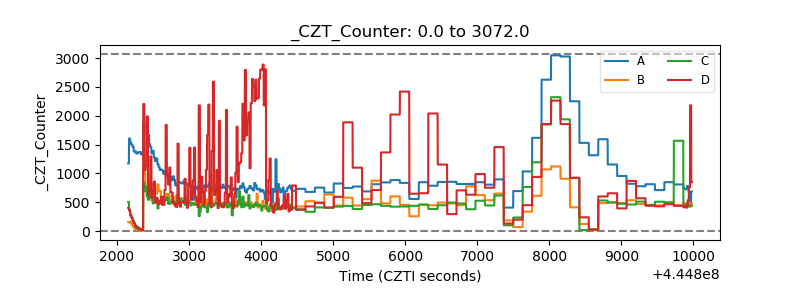 |
| +2.5 Volts monitor | 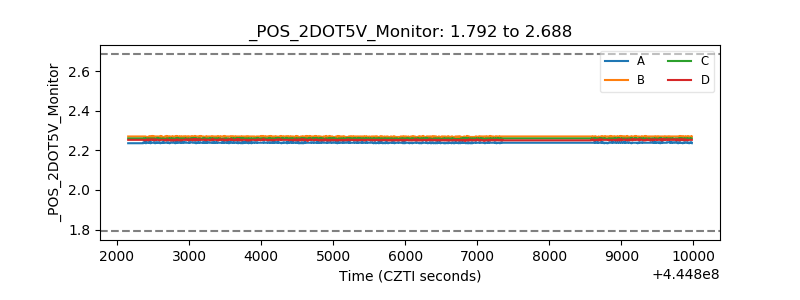 |
| +5 Volts monitor | 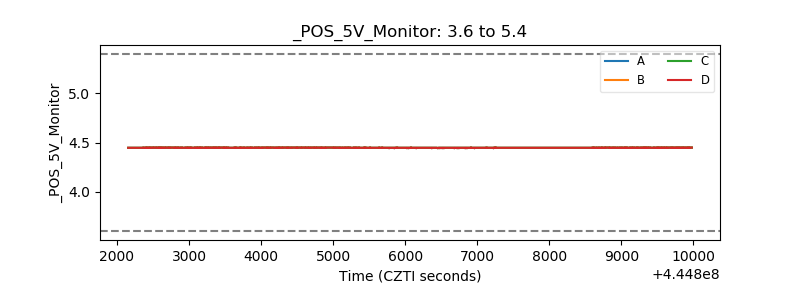 |
| _ROLL_ROT | 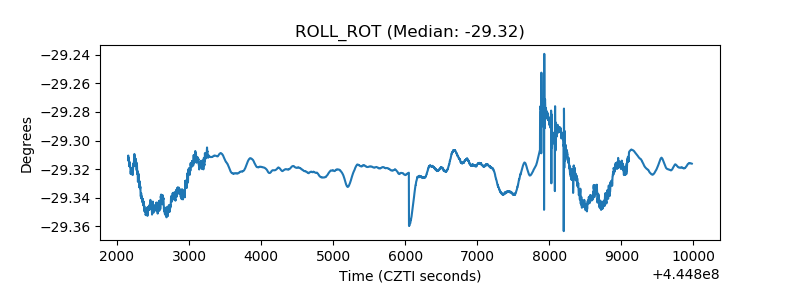 |
| _Roll_DEC | 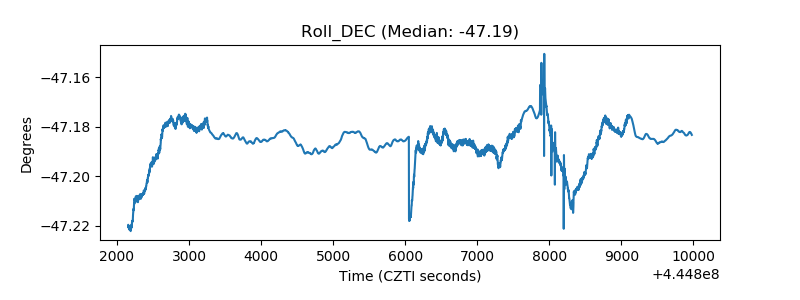 |
| _Roll_RA | 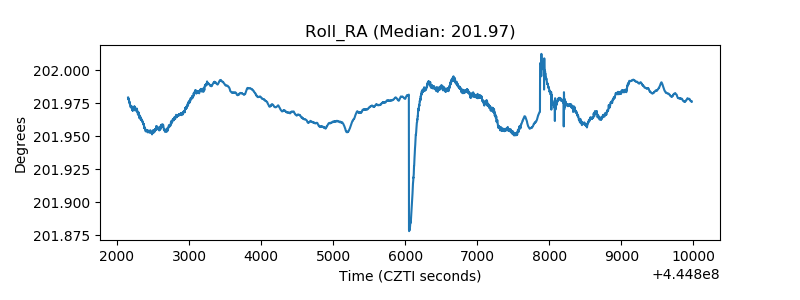 |
| Veto Counter | 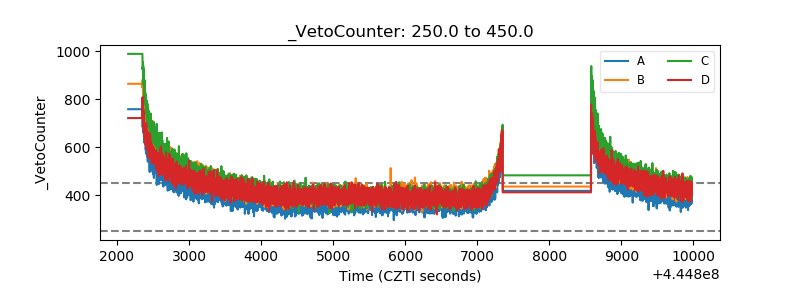 |