| Param | Original file | Final file |
|---|---|---|
| Filename | modeM0/AS1A13_049T05_9000006050_45185cztM0_level2.fits | modeM0/AS1A13_049T05_9000006050_45185cztM0_level2_quad_clean.evt |
| Size (bytes) | 488,327,040 | 106,436,160 |
| Size | 465.7 MB | 101.5 MB |
| Events in quadrant A | 5,179,706 | 716,760 |
| Events in quadrant B | 3,455,146 | 745,560 |
| Events in quadrant C | 3,014,671 | 727,443 |
| Events in quadrant D | 5,941,640 | 596,646 |
| Mode M0 | |||
|---|---|---|---|
| Quadrant | BADHDUFLAG | Total packets | Discarded packets |
| A | 0 | 19801 | 1 |
| B | 0 | 14171 | 1 |
| C | 0 | 13060 | 1 |
| D | 0 | 21876 | 1 |
| Mode M9 | |||
|---|---|---|---|
| Quadrant | BADHDUFLAG | Total packets | Discarded packets |
| A | 0 | 11 | 0 |
| B | 0 | 11 | 0 |
| C | 0 | 11 | 0 |
| D | 0 | 11 | 0 |
| Mode SS | |||
|---|---|---|---|
| Quadrant | BADHDUFLAG | Total packets | Discarded packets |
| A | 0 | 128 | 0 |
| B | 0 | 128 | 0 |
| C | 0 | 128 | 0 |
| D | 0 | 128 | 0 |
| Quadrant | Total seconds | Saturated seconds | Saturation percentage |
|---|---|---|---|
| A | 6250 | 166 | 2.656000% |
| B | 6250 | 170 | 2.720000% |
| C | 6251 | 88 | 1.407775% |
| D | 6251 | 858 | 13.725804% |
Noise dominated data is calculated using 1-second bins in cleaned event files. If a bin has >2000 counts, and if more than 50% of those come from <1% of pixels, then it is considered to be noise-dominated and hence unusable.
| Quadrant | # 1 sec bins | Bins with >0 counts | Bins with >2000 counts | High rate bins dominated by noise | Noise dominated (total time) | Noise dominated (detector-on time) | Marked lightcurve |
|---|---|---|---|---|---|---|---|
| A | 7380 | 6251 | 16 | 16 | 0.22% | 0.26% | 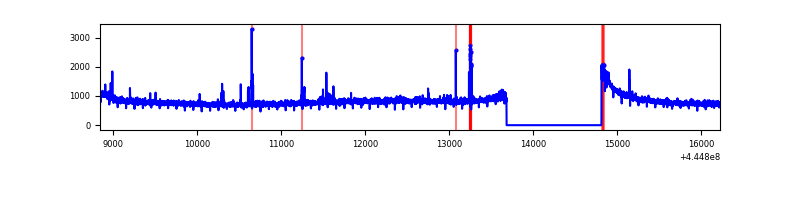 |
| B | 7380 | 6250 | 38 | 38 | 0.51% | 0.61% | 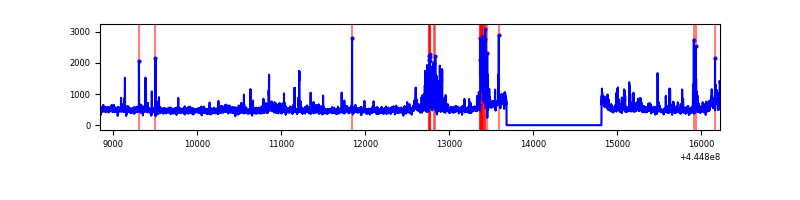 |
| C | 7381 | 6252 | 14 | 14 | 0.19% | 0.22% | 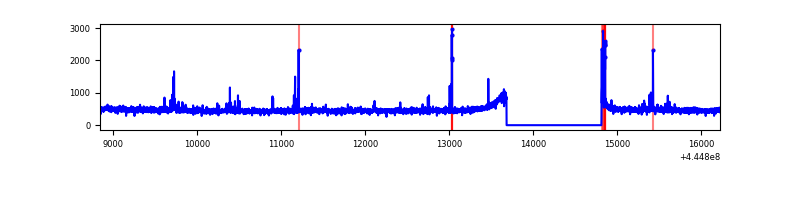 |
| D | 7381 | 6251 | 635 | 635 | 8.60% | 10.16% | 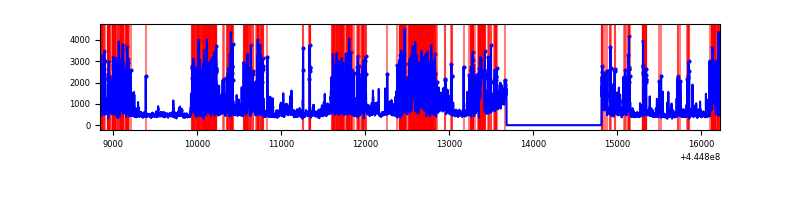 |
Top three noisy pixels from each quadrant. If the there are fewer than three noisy pixels in the level2.evt file, extra rows are filled as -1
| Pixel properties | Quadrant properties | ||||||
|---|---|---|---|---|---|---|---|
| Quadrant | DetID | PixID | Counts | Sigma | Mean | Median | Sigma |
| A | 10 | 83 | 2248249 | 14774.58 | 733 | 715 | 152.1 |
| A | 7 | 3 | 38486 | 248.29 | 733 | 715 | 152.1 |
| A | 15 | 174 | 34210 | 220.19 | 733 | 715 | 152.1 |
| B | 4 | 170 | 205562 | 1439.97 | 732 | 711 | 142.3 |
| B | 5 | 255 | 125279 | 875.63 | 732 | 711 | 142.3 |
| B | 3 | 112 | 80809 | 563.04 | 732 | 711 | 142.3 |
| C | 12 | 2 | 43276 | 246.0 | 738 | 741 | 172.9 |
| C | 3 | 233 | 36388 | 206.16 | 738 | 741 | 172.9 |
| C | 14 | 254 | 33677 | 190.48 | 738 | 741 | 172.9 |
| D | 5 | 235 | 1372403 | 7914.21 | 696 | 676 | 173.3 |
| D | 13 | 249 | 764780 | 4408.51 | 696 | 676 | 173.3 |
| D | 2 | 249 | 436007 | 2511.65 | 696 | 676 | 173.3 |
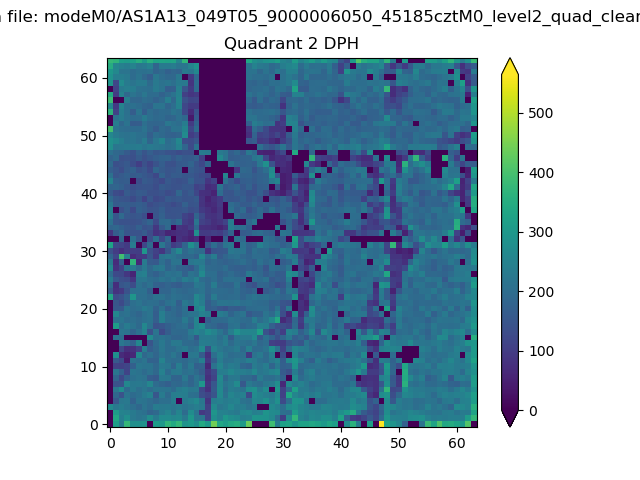
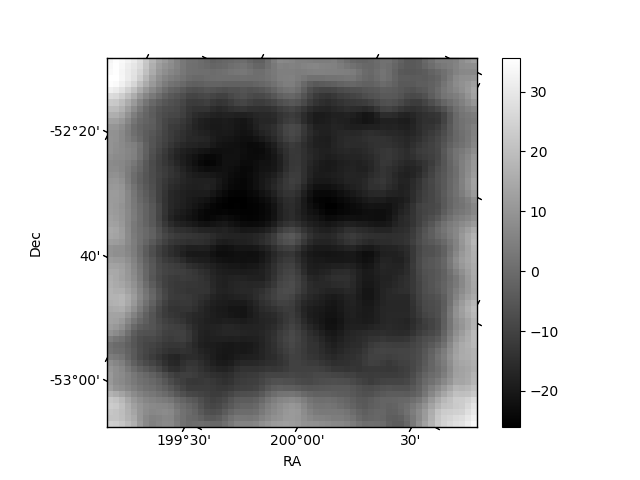
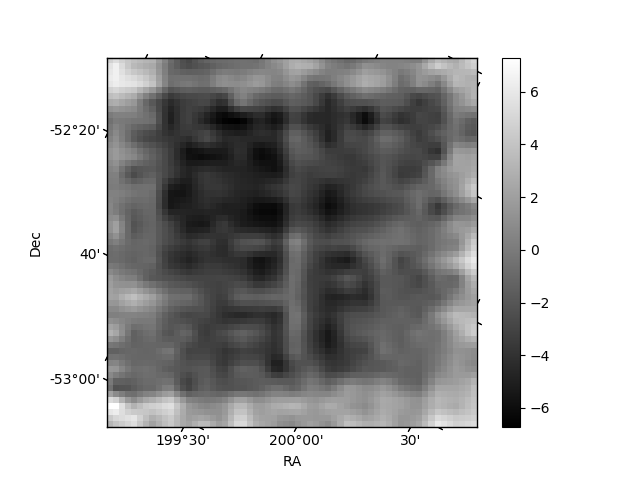
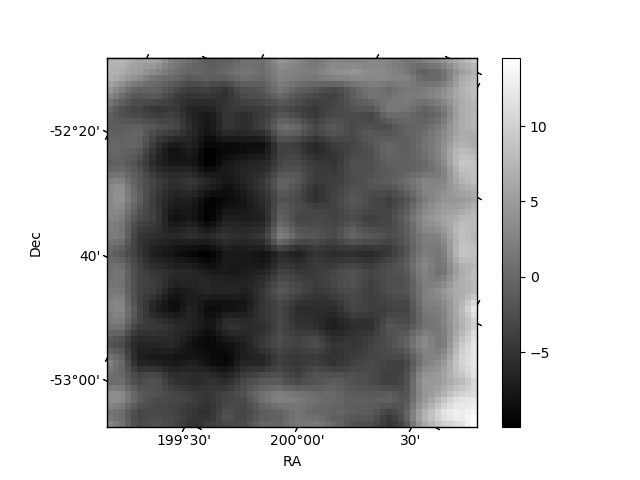
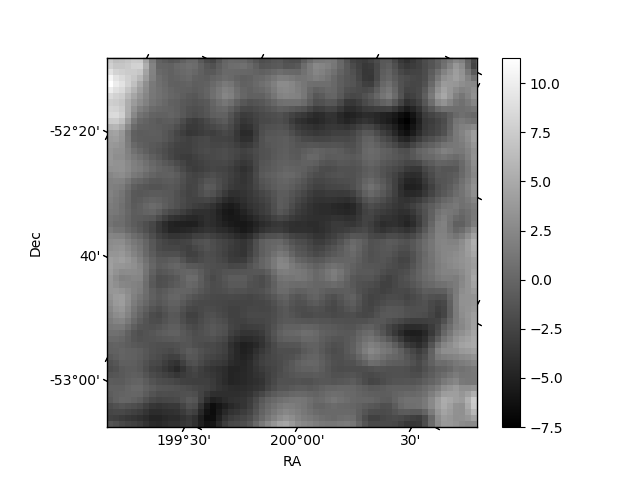
Histogram calculated using DETX and DETY for each event in the final _common_clean file
| Quadrant A | 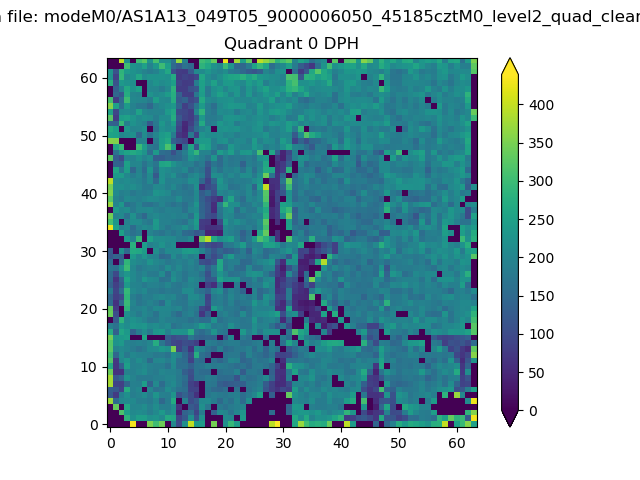 |
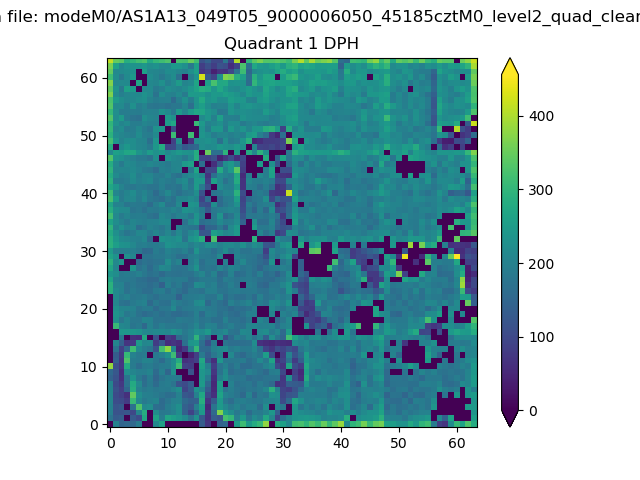 |
Quadrant B |
|---|---|---|---|
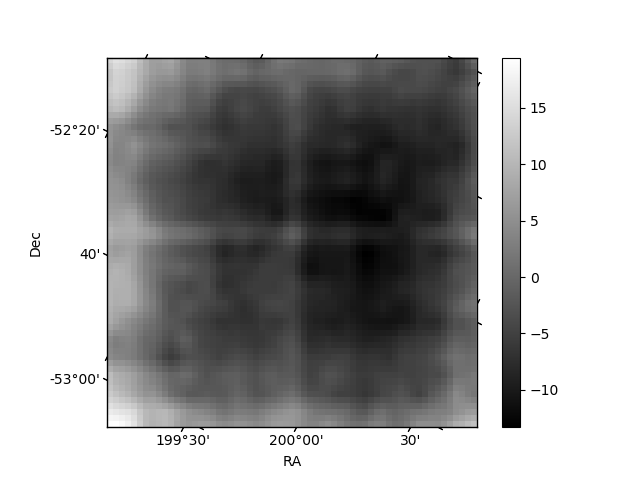
| Quadrant D | 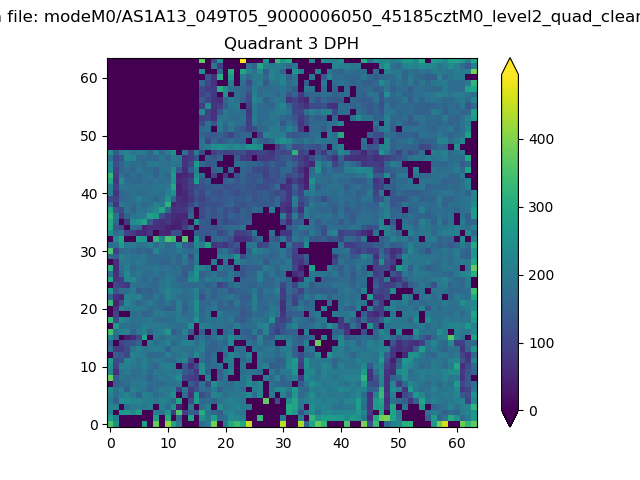 |
 |
Quadrant C |
| Plot type | Count rate plots | Images |
|---|---|---|
| Comparison with Poisson distribution Blue bars denote a histogram of data divided into 1 sec bins. Red curve is a Poisson curve with rate = median count rate of data. |
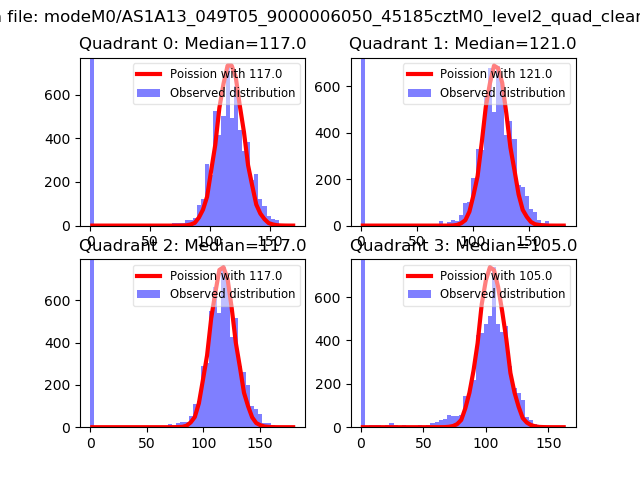 |
 |
| Quadrant-wise count rates Data is divided into 100 sec bins |
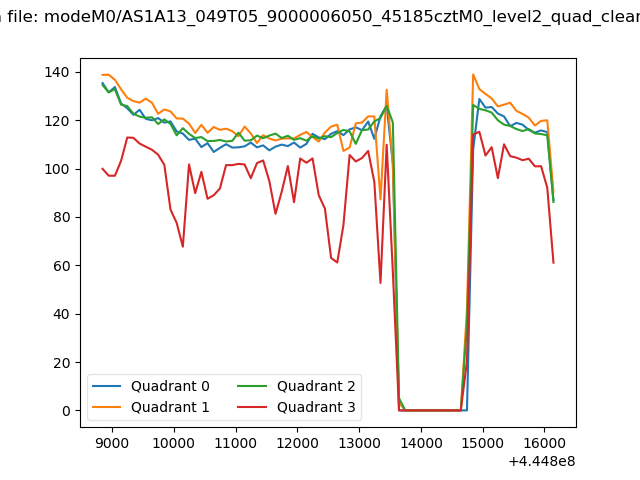 |
|
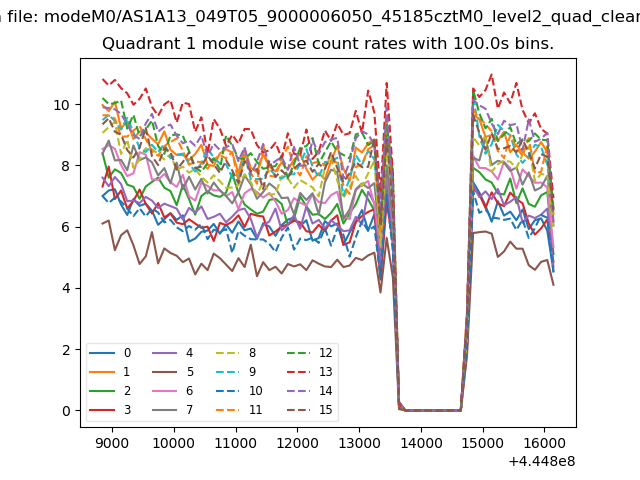
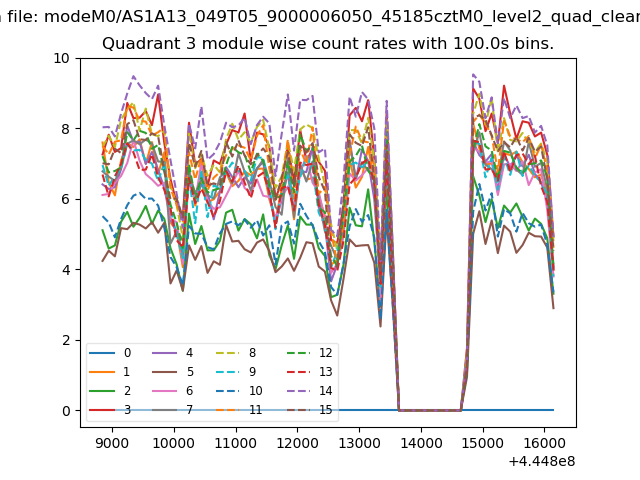
| Module-wise count rates for Quadrant A Data is divided into 100 sec bins |
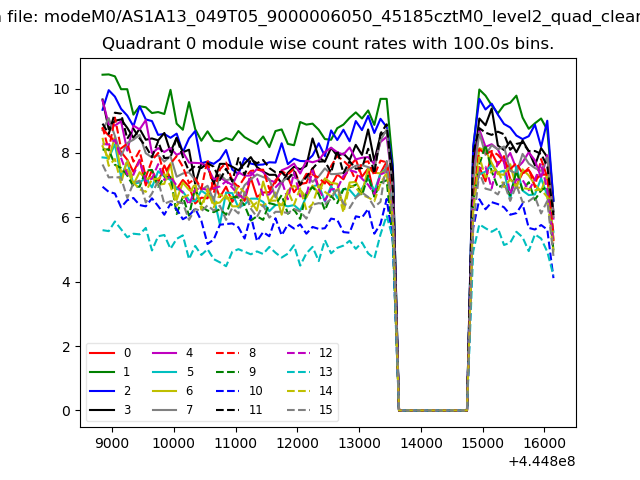 |
 |
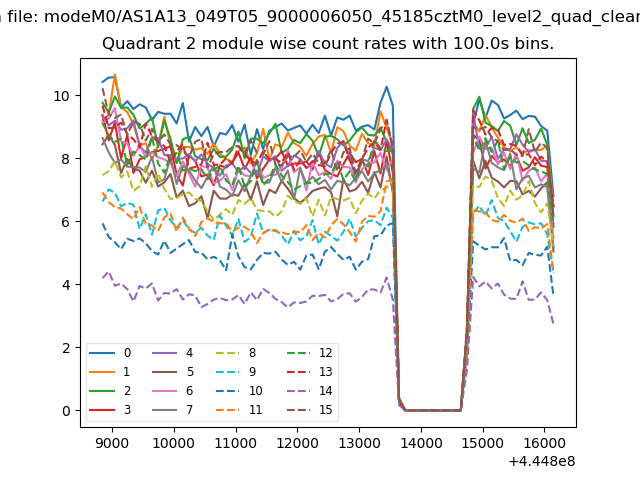
| Module-wise count rates for Quadrant B Data is divided into 100 sec bins |
 |
 |
| Module-wise count rates for Quadrant C Data is divided into 100 sec bins |
 |
 |
| Module-wise count rates for Quadrant D Data is divided into 100 sec bins |
 |
 |
| Parameter | Plot |
|---|---|
| CZT HV Monitor |  |
| D_VDD | 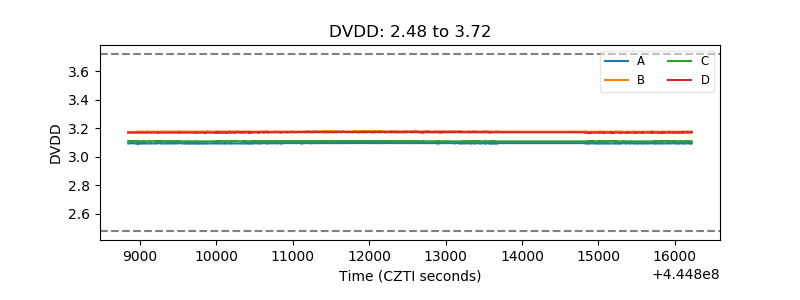 |
| Temperature 1 | 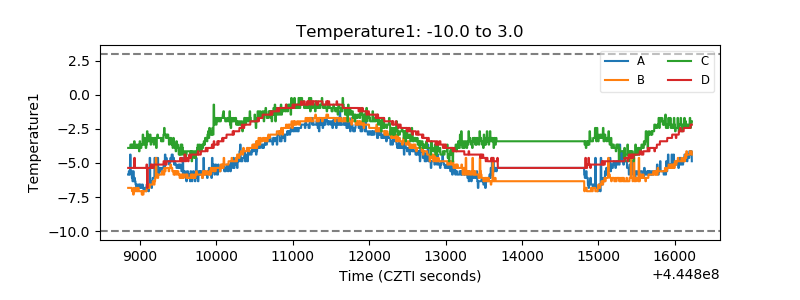 |
| Veto HV Monitor | 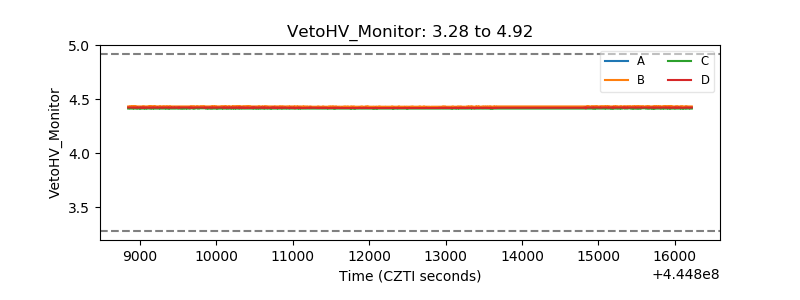 |
| Veto LLD | 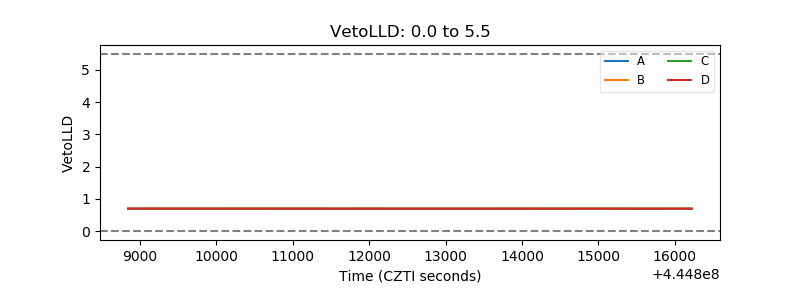 |
| Alpha Counter | 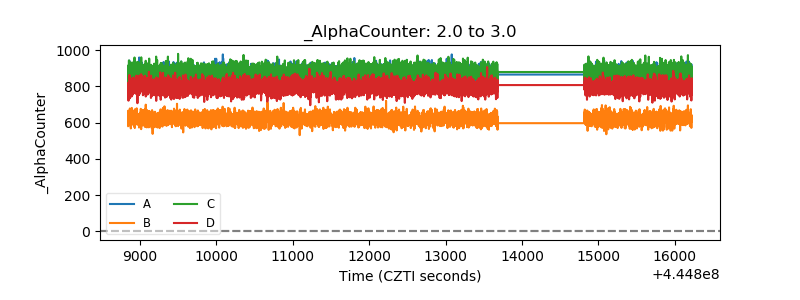 |
| _CPM_Rate | 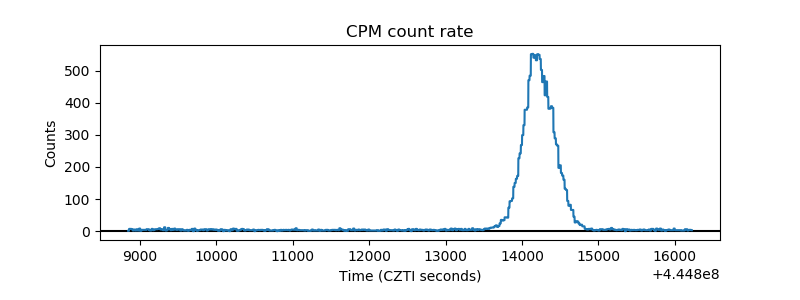 |
| CZT Counter | 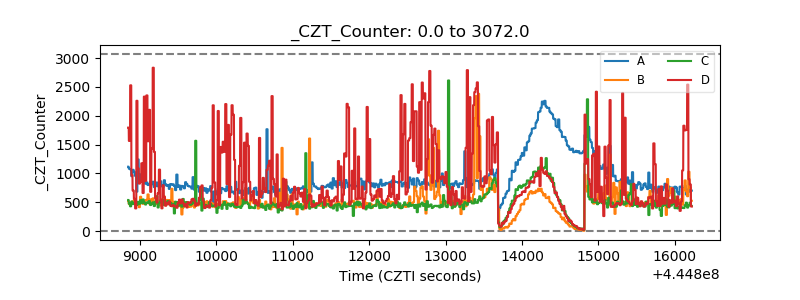 |
| +2.5 Volts monitor | 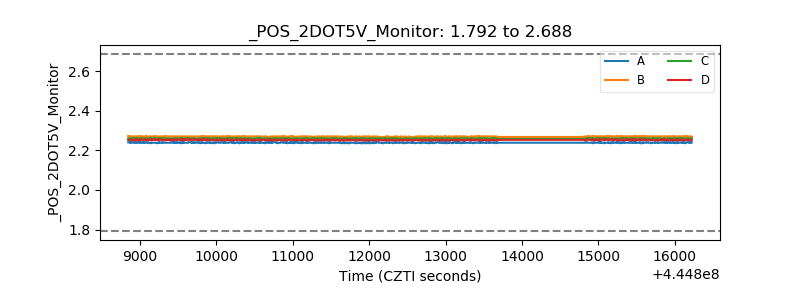 |
| +5 Volts monitor | 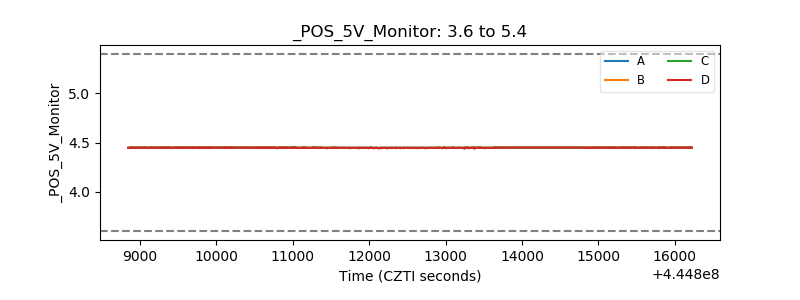 |
| _ROLL_ROT | 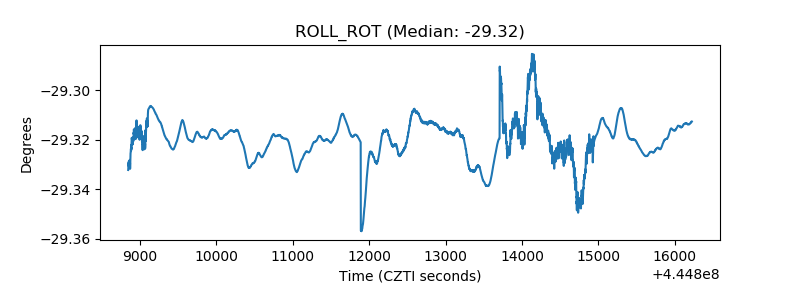 |
| _Roll_DEC | 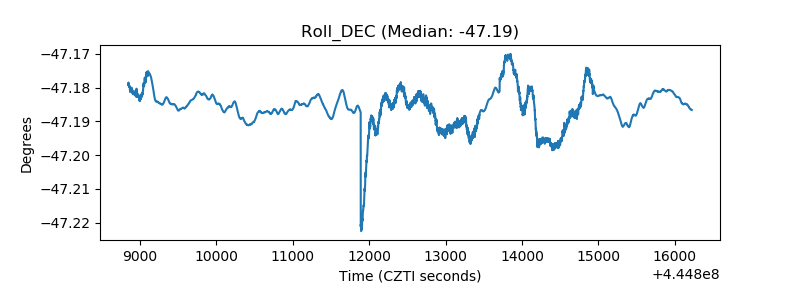 |
| _Roll_RA | 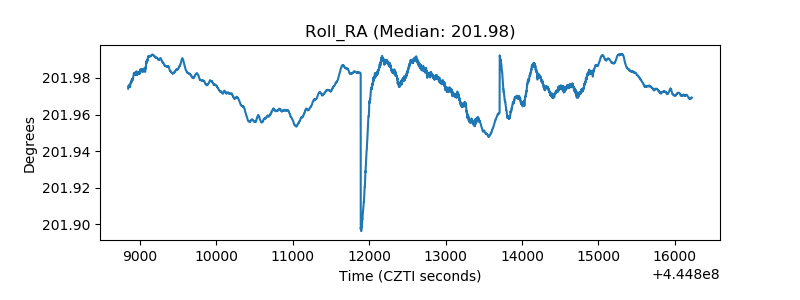 |
| Veto Counter | 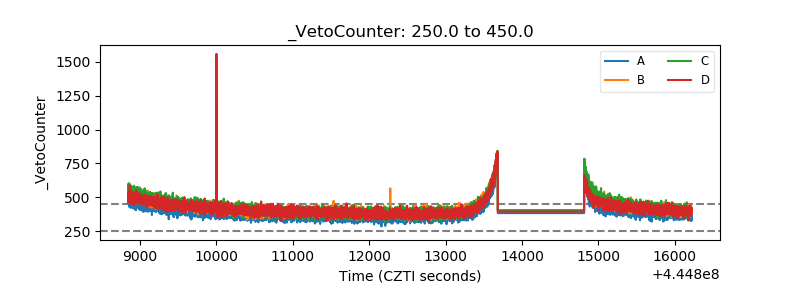 |